Abstract
Background
While birthplace data are routinely collected in the participating Surveillance, Epidemiology, and End Results (SEER) registries, such data are missing in a non-random manner for a large proportion of cases. This hinders analysis of nativity-related cancer disparities. We evaluate multiple imputation of nativity status among Hispanic patients diagnosed with cervix, prostate, and colorectal cancer and demonstrate the effect of multiple imputation on apparent nativity disparities in survival.
Methods
We used multiple imputation by logistic regression to generate nativity values (U.S.- versus foreign-born) using a priori-defined variables. The accuracy of the method was evaluated among a subset of cases. We used Kaplan-Meier curves to illustrate the effect of imputation by comparing survival among U.S.- and foreign-born Hispanics, with and without imputation of nativity.
Results
Birthplace was missing for 31%, 49%, and 39% of cervical, prostate, and colorectal cancer cases, respectively. The sensitivity of the imputation strategy for detecting foreign-born status was ≥ 90% and the specificity ≥ 86%. The agreement between the true and imputed values was ≥ 0.80 and the misclassification error was ≤ 10%. Kaplan-Meier survival curves indicated different associations between nativity and survival when nativity was imputed versus when cases with missing birthplace were omitted from the analysis.
Conclusions
Multiple imputation using variables available in the SEER data file can be used to accurately detect foreign-born status. This simple strategy may aid researchers to disaggregate analyses by nativity and uncover important nativity disparities in regard to cancer diagnosis, treatment, and survival.
Keywords: Emigration and immigration, SEER Program, Multiple Imputation, Hispanic Americans, Health Status Disparities
INTRODUCTION
The study of the effects of immigration on cancer patterns has become increasingly important for health disparities research. Immigrants currently comprise 13% (nearly 40 million persons) of the U.S. population.1 While immigrants generally have lower overall cancer mortality than their U.S.-born counterparts,2 they have higher mortality from infection-associated cancers (e.g., gastric, liver, and cervical cancer) and screenable cancers (e.g., cervical and colorectal cancer). For screenable cancers, disparities in access and utilization of early detection services may lead to disparities in incidence, stage at diagnosis, and cancer-specific survival.3–6
The Surveillance, Epidemiology, and End Results (SEER) program of the National Cancer Institute provides population-based data on cancer incidence and survival in the U.S.7 and has been used extensively to evaluate cancer health disparities.8 However, analyses by immigrant status are lacking due to inadequate denominator data and to incomplete reporting of immigrant status. Although data on birthplace are routinely collected in participating SEER registries, such data are missing for a large proportion of cases. Furthermore, the distribution of missing data is non-random and is related to variables including nativity, vital status, age, gender, ethnicity, and certain hospital characteristics.9–13 Of particular concern for nativity disparities research is the observation that missing birthplace data are more common among U.S.- versus foreign-born cases12 and among cancer survivors versus the deceased, given that birthplace is often ascertained from the death certificate when it is not available from other sources.9, 10 Due to the non-random distribution of missing birthplace data, strategies such as listwise deletion and allocation proportional to the distribution of birthplace in the population may cause significant bias in estimates. Nonetheless, these strategies have been commonly used in nativity disparities research.14–26
Multiple imputation is a strategy whereby missing values are replaced with two or more values representing a distribution of probabilities.27, 28 It has been used extensively to deal with missing data in complex health datasets.29 However, to our knowledge, there have not been any studies to evaluate the accuracy of multiple imputation of nativity in the SEER data file. While Choe et al. used multiple imputation of nativity, ethnicity, and stage of diagnosis,9 the purpose of their analysis was to compare cancer-specific survival among U.S.- and foreign-born Asian and Pacific Islander colorectal cancer cases. In this study, we specifically evaluate the accuracy of multiple imputation for detecting foreign-born status and demonstrate how multiple imputation of nativity may overcome significant biases that occur in cancer survival analyses when cases with missing birthplace information are simply omitted from the database and ignored during analysis. We conducted our analysis among Hispanic patients diagnosed with invasive cervix, prostate, and colorectal cancer, the primary screenable cancers for females, males, and both sexes, respectively. We focused on Hispanics because they are the largest and fastest growing minority group in the U.S. with a large proportion of foreign-born individuals (over 40%).30
METHODS
Data Source
Data were obtained from the SEER Program (June 2012 release). SEER registries cover 18 geographic areas (Alaska, Arizona, Connecticut, Hawaii, Iowa, Louisiana, Kentucky, New Jersey, New Mexico, Utah, San Jose-Monterey, Los Angeles, San Francisco-Oakland, Greater California, Rural Georgia, Atlanta, Detroit, and Seattle-Puget Sound), which together represent approximately 28% of the U.S. population and 41% of the U.S. Hispanic population.7
Cases were Hispanic women and men living in a SEER catchment area who were diagnosed with microscopically-confirmed, primary invasive cervical (International Classification of Diseases for Oncology, 3rd edition [ICD-O-3] codes C53.0 -53.9), prostate (ICD-O-3 code C619), or colorectal cancer (ICD-O-3 codes C180, C182-C189, C199, C209, C260)31 between January 1, 1988 and December 31, 2009. The year 1988 was chosen as the lower time limit because it was the first year in which Hispanic ethnicity was collected for all SEER cases.32 We included cases with known Hispanic ethnicity as well as those with evidence of Hispanic ethnicity based on surname.33 The number of Hispanic origin patients with a confirmed diagnosis of cervical, prostate, or colorectal cancer was 10,399; 52,346; and 32,880, respectively. Of these, we excluded the 2% or less of cases with unknown age at diagnosis (2; 447; and 4 in the cervical, prostate, and colorectal cancer databases, respectively), cancer-directed surgery (cervical: 18, prostate: 145, colorectal: 48), and radiation therapy (cervical: 164, prostate: 785, colorectal: 348).
Imputation of nativity
After exclusion of cases based on the criteria described above, nativity was the only variable with missing values (monotone missing pattern). As discussed in the Introduction, missing nativity follows a non-random pattern. We used the SAS Multiple Imputation procedure to generate nativity values by the logistic regression imputation method [PROC MI with LOGISTIC in the MONOTONE statement, SAS version 9.2 (SAS Institute, Cary, NC)].34, 35 Specifically, among those not missing nativity data, a logistic regression model was fitted for nativity (the dependent variable) by the maximum likelihood method using a group of independent variables selected a priori for each cancer separately. Candidate independent variables were those known to be associated with missing nativity status,11–13 those significantly associated with nativity in our dataset, and others of clinical relevance. They included age at diagnosis, stage at diagnosis, receipt of cancer-directed surgery, receipt of radiation therapy, SEER site, Hispanic origin, reporting source, sex (colorectal cancer only), and anatomical subsite (colorectal cancer only). Independent variables were omitted from the model if they did not increase the model’s accuracy according to the global F-test. Area under the receiver operator curves (ROC) and R-squared values were used to describe how well the models fit the data.
Age at diagnosis was treated as a continuous variable in the model. Tumor stage at diagnosis was defined using the SEER historic staging scheme, which classifies cervical and colorectal tumors as local, regional, or distant, and prostate tumors as local/regional or distant.36 Cases missing stage of diagnosis (4.52%, 15.45%, and 4.43% of cervical, prostate, and colorectal cancer cases, respectively) were kept in the dataset and categorized as unknown. The receipt of cancer-directed surgery and radiation therapy variables were categorized dichotomously (yes/no). Hispanic origin was based on the SEER recoded variable and categorized as specified Spanish/Hispanic origin, not otherwise specified Spanish/Hispanic origin, and surname match only. Specified Spanish/Hispanic origin included those of Mexican, Puerto Rican, Cuban, Dominican Republic, South or Central American (excluding Brazilian) origin and those of other specified Spanish/Hispanic origins (including European). Reporting source was categorized as hospital inpatient, physician’s office, or other. Anatomical subsite was used for colorectal cancer only and was categorized as proximal, distal, rectum, or other.
To impute the missing values for nativity, we randomly divided cases with known nativity into a test group (80% of cases) and a validation group (20%). In the test group, a new regression model was simulated over 20 iterations for each cancer using the posterior predictive distribution27 of parameters based on the fitted regression coefficients. For each iteration, missing nativity was imputed as either 1 (foreign-born) or 0 (U.S.-born). The imputed values were then averaged across all iterations. Missing nativity values in the final dataset for each cancer were recoded as 1 (foreign-born) if the mean imputed value across the 20 datasets was > 0.5 or 0 (U.S. born) if the mean imputed value was ≤ 0.5. The imputation strategy was then used in the validation group to calculate the sensitivity and specificity for detecting foreign-born cases, the proportion of misclassified cases, and kappa statistics to measure the agreement between true and imputed values. Kappa values greater than 0.8 indicate excellent agreement, while values 0.61 to 0.8 and 0.41 to 0.60 indicate substantial and moderate agreement, respectively.37 Finally, we used the full dataset with known nativity (test and validation groups) to impute nativity for those with missing birthplace.
To elucidate the effect of multiple imputation on nativity differences in cause-specific survival, we constructed Kaplan-Meier curves comparing survival among U.S.- and foreign-born Hispanics, with and without imputation of nativity. For the analyses without imputation, cases with missing birthplace data were omitted from the dataset (listwise deletion). Survival was defined as the number of months from the date of diagnosis to the date of death or last follow-up (December 31, 2009). Deaths were defined as cervical, prostate, or colorectal cancer-specific mortality; individuals who died of other causes and those alive at the date of last follow-up were censored. We used the log-rank test to assess the statistical significance of the observed differences between the cancer-specific survival curves by nativity.
RESULTS
Between 1988 and 2009, there were 10,215 cervical; 51,400 prostate; and 32,480 colorectal cancer cases among Hispanics reported in SEER that met our inclusion criteria. Of these, birthplace data were missing for 3,191 (31.24%) cervical; 24,998 (48.63%) prostate; and 12,575 (38.72%) colorectal cancer cases. There were significant differences between those with and without birthplace data (Table 1). Notably, cases with unknown birthplace were significantly more like to be diagnosed at a localized or regional stage, to be reported by a physician’s office, and to have non-specified Hispanic origin or to be classified as Hispanic based on surname match only. For example, 68.44% of cervical cancer cases with missing birthplace data were of non-specified Hispanic origin, compared to 17.77% of cases with known birthplace. There were also significant differences in receipt of cancer-directed surgery and radiation between those with and without birthplace information.
TABLE 1.
Demographic, tumor, and treatment characteristics of cases of cervical, prostate, and colorectal cancer with and without available birthplace information.
| Cervix Cancer |
Prostate Cancer |
Colorectal Cancer |
|||||||
|---|---|---|---|---|---|---|---|---|---|
| Place of birth available (n=7,024; 69.76%) |
Place of birth missing (n=3,191; 31.24%) |
p-value | Place of birth available (n=26,402; 51.37%) |
Place of birth missing (n=24,998; 48.63%) |
p-value | Place of birth available (n=19,905; 61.28%) |
Place of birth missing (n=12,575; 38.72%) |
p-value | |
| Age at diagnosis | <0.0001 | <0.0001 | <0.0001 | ||||||
| ≤29 | 6.38 | 8.90 | 0.02 | 0.02 | 1.42 | 1.18 | |||
| 30–39 | 24.67 | 29.87 | 0.04 | 0.10 | 4.55 | 4.42 | |||
| 40–49 | 29.06 | 28.52 | 2.53 | 2.98 | 10.66 | 11.38 | |||
| 50–59 | 18.34 | 15.39 | 17.06 | 18.44 | 20.34 | 22.35 | |||
| ≥60 | 21.55 | 17.33 | 80.35 | 78.47 | 63.04 | 60.68 | |||
| Stage at diagnosis | <0.0001 | <0.0001 | |||||||
| Localized | 46.07 | 60.70 | 75.18* | 84.31* | 33.43 | 44.63 | <0.0001 | ||
| Regional | 39.51 | 29.61 | 37.95 | 35.17 | |||||
| Distant | 9.85 | 5.26 | 6.23 | 3.55 | 24.02 | 16.05 | |||
| Missing | 4.57 | 4.42 | 18.59 | 12.13 | 4.60 | 4.15 | |||
| Reporting source | <0.0001 | <0.0001 | <0.0001 | ||||||
| Hospital inpatient | 98.93 | 95.89 | 95.06 | 79.26 | 98.60 | 96.35 | |||
| Physician's office | 0.46 | 2.38 | 3.08 | 16.52 | 0.84 | 2.47 | |||
| Other | 0.61 | 1.72 | 1.86 | 4.22 | 0.56 | 1.18 | |||
| Hispanic Origin | <0.0001 | <0.0001 | <0.0001 | ||||||
| Specified | 77.25 | 12.10 | 63.54 | 23.99 | 58.19 | 9.85 | |||
| Unspecified | 17.77 | 68.44 | 27.96 | 66.46 | 31.75 | 69.47 | |||
| Surname match only | 4.98 | 19.46 | 8.50 | 9.55 | 10.06 | 20.68 | |||
| Received surgery | 57.46 | 68.13 | <0.0001 | 45.66 | 39.63 | <0.0001 | 84.58 | 87.60 | <0.0001 |
| Received radiation | 57.43 | 40.08 | <0.0001 | 32.89 | 29.35 | <0.0001 | 17.45 | 11.91 | <0.0001 |
| Registry Site | <0.0001 | <0.0001 | <0.0001 | ||||||
| San Francisco-Oakland SMSA | 5.27 | 7.08 | 6.42 | 7.62 | 6.83 | 10.00 | |||
| Connecticut | 3.45 | 3.45 | 3.70 | 2.63 | 4.71 | 2.95 | |||
| Metropolitan Detroit | 0.58 | 1.54 | 0.96 | 1.28 | 1.15 | 1.11 | |||
| Hawaii | 0.27 | 0.16 | 0.71 | 0.17 | 0.79 | 0.13 | |||
| Iowa | 0.24 | 0.97 | 0.30 | 0.44 | 0.35 | 0.56 | |||
| New Mexico | 4.97 | 10.37 | 11.77 | 11.80 | 12.16 | 11.93 | |||
| Seattle | 0.90 | 1.50 | 1.05 | 1.15 | 1.22 | 0.97 | |||
| Utah | 0.93 | 3.67 | 1.23 | 1.70 | 1.32 | 1.92 | |||
| Metropolitan Atlanta | 0.93 | 2.29 | 0.78 | 0.91 | 1.04 | 1.10 | |||
| Alaska | - | - | - | - | 0.00 | 0.01 | |||
| San Jose-Monterey | 4.98 | 5.23 | 3.86 | 7.05 | 3.73 | 7.36 | |||
| Los Angeles | 51.37 | 23.00 | 39.28 | 26.41 | 36.16 | 22.32 | |||
| Rural Georgia | 0.03 | 0.00 | - | - | 0.01 | 0.02 | |||
| Greater California (excluding San Francisco, Los Angeles and San Jose) | 20.19 | 29.52 | 21.87 | 28.83 | 22.04 | 31.85 | |||
| Kentucky | 0.09 | 0.47 | 0.11 | 0.18 | 0.17 | 0.33 | |||
| New Jersey | 5.00 | 9.24 | 7.45 | 9.00 | 7.65 | 6.59 | |||
| Greater Georgia (excluding Atlanta and Rural Georgia) | 0.83 | 1.50 | 0.52 | 0.82 | 0.68 | 0.87 | |||
| Male sex** | 54.28 | 54.60 | 0.5696 | ||||||
| Anatomical subsite** | <0.0001 | ||||||||
| Proximal | 35.69 | 36.05 | |||||||
| Distal | 26.71 | 28.50 | |||||||
| Rectum | 34.21 | 32.83 | |||||||
| Other | 3.38 | 2.62 | |||||||
For prostate cancer, stage at diagnosis is classified as localized/regional versus distant
Sex and anatomical subsite were only used to impute nativity for colorectal cancer
Cervix cancer
Covariates used to impute nativity status for cervix cancer were: age at diagnosis, stage at diagnosis, surgery, radiation, reporting source, Hispanic origin, and SEER site. The area under the ROC was 0.942, indicating excellent agreement between the model and the data, while the R-squared value was 0.7534 (See Supplemental Table 1a). After imputation, 2,816 (88.25%) cases with unknown birthplace were classified as U.S.-born and 375 (11.75%) were classified as foreign-born (Table 2). In the validation group, the correlation between the true and imputed nativity values was 0.82, and 6.83% of cases were misclassified (Table 3a). Misclassification of nativity was 12.43% and 4.83% among U.S.- and foreign-born cases, respectively. The sensitivity for detecting foreign-born status was 95.17%, and the specificity was 87.57%.
TABLE 2.
Comparison of nativity distribution before and after imputation for cervical, prostate, and colorectal cancer.
| Before imputation | After imputation | |||||
|---|---|---|---|---|---|---|
| Foreign-born n(%) |
U.S.-born n(%) |
Place of Birth Missing |
Foreign-born n(%) |
U.S.-born n (%) |
% Missing Allocated to U.S.-born |
|
| Cervical Cancer | N = 7,024 | N=3,191 | N = 10,215 | 88.25 | ||
| 5,229(74.44) | 1,795(25.56) | 5,604(54.86) | 4,611(45.14) | |||
| Prostate Cancer | N = 26,402 | N=24,998 | N = 51,400 | 86.28 | ||
| 14,884(56.37) | 11,518(43.63) | 18,313(35.63) | 33,087(64.37) | |||
| Colorectal Cancer | N = 19,905 | N=12,575 | N = 32,480 | 89.61 | ||
| 10,032(50.40) | 9,873(49.60) | 11,338(34.91) | 21,142(65.09) | |||
TABLE 3.
Cross-validation of imputation method for a) cervix, b) prostate, and c) colorectal cancer
| a. Cervix Cancer | ||||
| Imputed value | ||||
| Real value | Foreign-born | U.S.-born | Total | |
| Foreign-born | 986(70.13%) | 50(3.56%) | 1,026(73.02%) | |
| U.S.-born | 46(3.27%) | 324(23.04%) | 370(26.32%) | |
| Total | 1,032(73.40%) | 374(26.60%) | 1,406 (100.0%) | |
| % misclassified | 6.83% | |||
| Kappa | 0.8245 | |||
| Sensitivity | 95.17% | |||
| Specificity | 86.81% | |||
| b. Prostate Cancer | ||||
| Imputed value | ||||
| Real value | Foreign-born | U.S.-born | Total | |
| Foreign-born | 2,839(53.79%) | 183(3.47%) | 3,022(57.22%) | |
| U.S.-born | 234(4.473%) | 2,025(38.35%) | 2,259(42.78%) | |
| Total | 3,073(58.19%) | 2,208(41.81%) | 5,281 (100.0%) | |
| % misclassified | 7.90% | |||
| Kappa | 0.8382 | |||
| Sensitivity | 93.94% | |||
| Specificity | 89.64% | |||
| c. Colorectal Cancer | ||||
| Imputed value | ||||
| Real value | Foreign-born | U.S.-born | Total | |
| Foreign-born | 1,818(45.67%) | 186(4.67%) | 2,004(50.34%) | |
| U.S.-born | 199(5.00%) | 1,778(44.66%) | 1,977(49.66%) | |
| Total | 2,017(50.67%) | 1,964(49.33%) | 4382 (100.0%) | |
| % misclassified | 9.67% | |||
| Kappa | 0.8066 | |||
| Sensitivity | 90.72% | |||
| Specificity | 89.93% | |||
Prostate cancer
Covariates used to impute nativity status for prostate cancer were: age at diagnosis, stage at diagnosis, surgery, radiation, reporting source, Hispanic origin, and SEER site. There was excellent agreement between the model and the data (area under the ROC = 0.947) and the R-squared value was 0.7697 (See Supplemental Table 1b). Cases with unknown birthplace were predominantly classified as U.S.-born (86.28%, Table 2). In the validation group, the correlation between the true and imputed nativity values was 0.84, and 7.90% of cases were misclassified (Table 3b). Misclassification of nativity was 10.36% and 6.06% among U.S.- and foreign-born cases, respectively. The sensitivity for detecting foreign-born status was 93.94%, and the specificity was 89.64%.
Colorectal cancer
Covariates used to impute nativity status for colorectal cancer were: age at diagnosis, stage at diagnosis, surgery, radiation, reporting source, Hispanic origin, SEER site, sex, and anatomical subsite. There was excellent agreement between the model and the data (area under the ROC = 0.939) and the R-squared value was 0.7383 (see Supplemental Table 1c). After imputation, 89.61% of cases with unknown birthplace were classified as U.S.-born (Table 2). In the validation group, the correlation between the true and imputed nativity values was 0.81, and 9.67% of cases were misclassified (Table 3c). Misclassification of nativity was 10.07% and 9.28% among U.S.- and foreign-born cases, respectively. The sensitivity for detecting foreign-born status was 90.72%, and the specificity was 89.93%.
Effect of imputation on nativity differences in cancer-specific survival
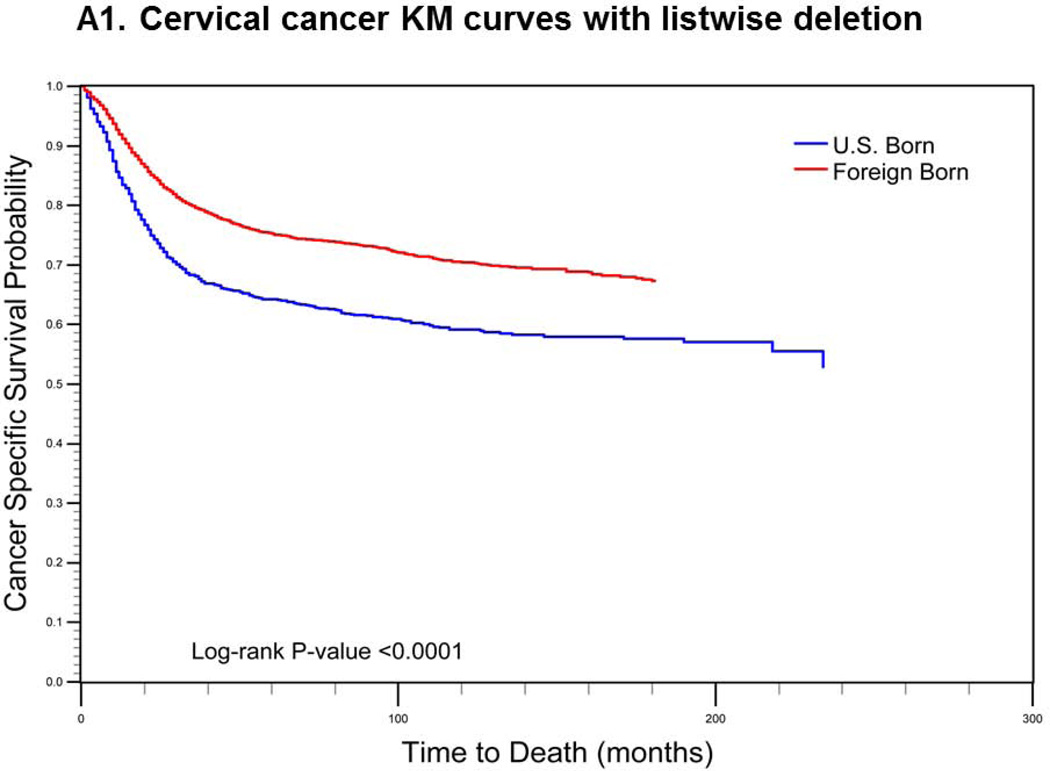
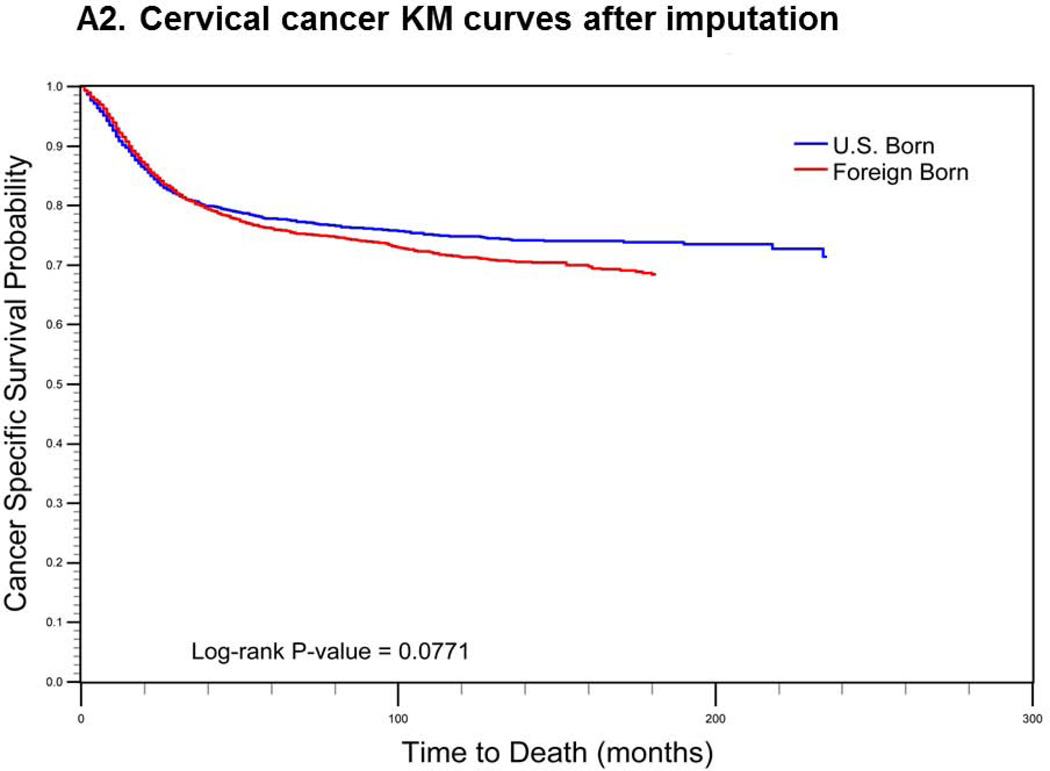
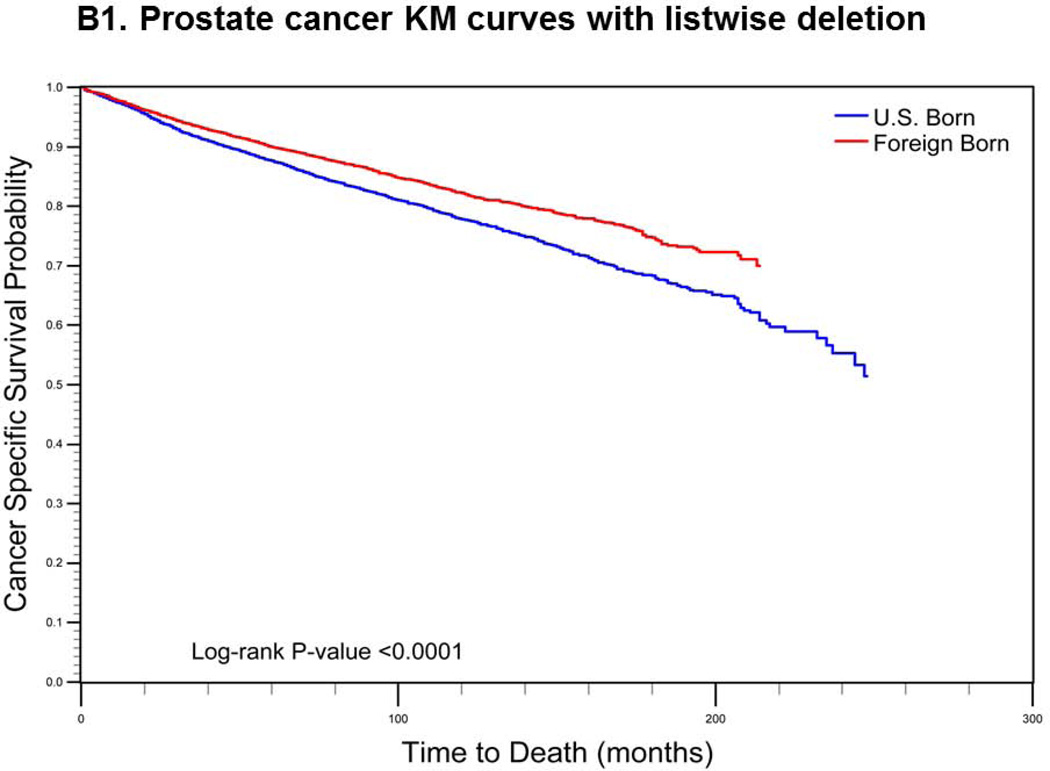
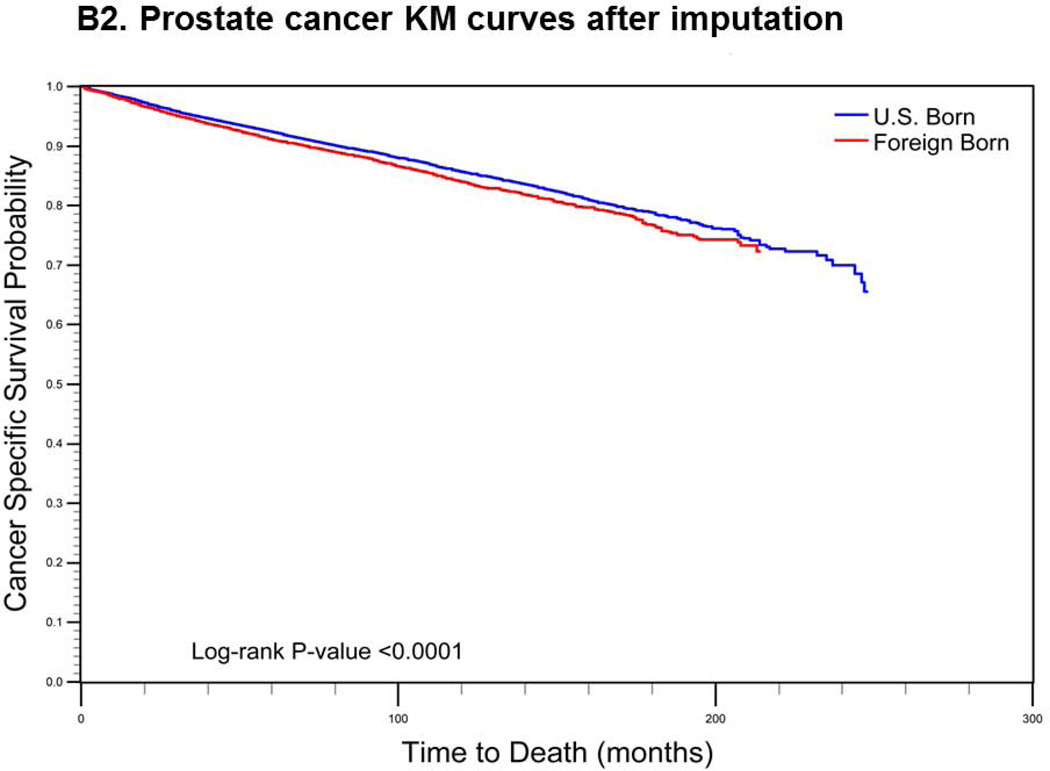
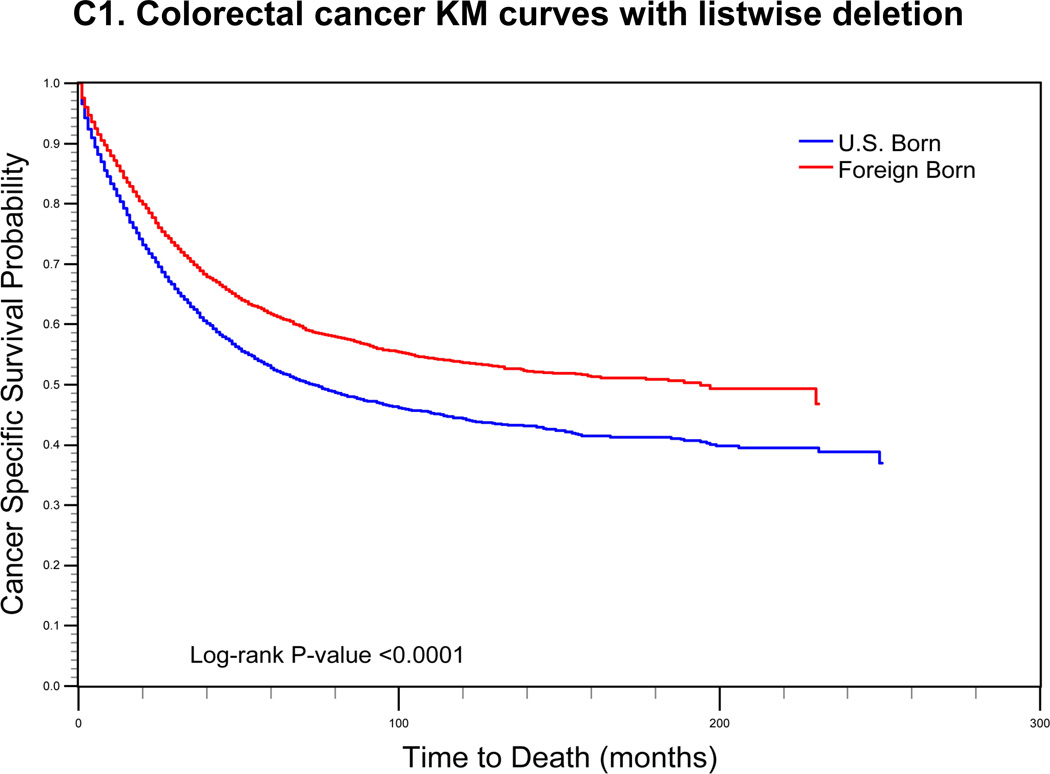
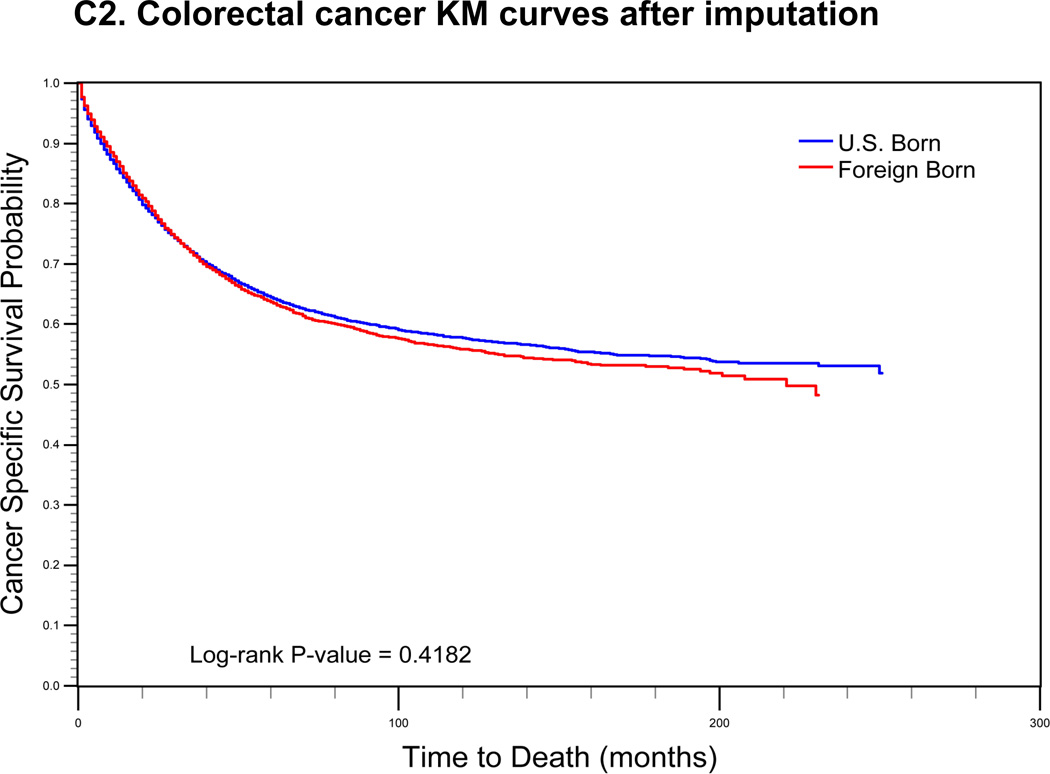
For cervical cancer (Fig. 1a), the pre-imputation Kaplan-Meier curves (using listwise deletion of cases with missing nativity) indicated that cervical cancer-specific survival was significantly poorer among U.S.-born versus foreign-born cases (log-rank p-value < 0.0001). After imputation, however, the mean length of survival among U.S.-born cases increased while remaining largely unchanged for foreign-born cases. The new Kaplan-Meier curves indicated an opposite association between nativity and survival, with improved (but not statistically significant) cancer-specific survival among U.S.-born cases (log-rank p-value = 0.0771). For prostate cancer (Fig 1b), the pre-imputation Kaplan-Meier curves also indicated significantly poorer cancer-specific survival among U.S.-born versus foreign-born cases (log-rank p-value <0.0001), while after imputation, there was a significant survival advantage among U.S.-born cases (log-rank p-value <0.0001). Finally, for colorectal cancer (Fig 1c), the apparent survival advantage among foreign-born cases (log-rank p-value<0.0001) became null after imputation of nativity (log-rank p-value = 0.4183).
FIGURE 1.
Comparison of log-rank test and Kaplan-Meier (KM) curves of cancer-specific mortality using listwise deletion versus multiple imputation of missing nativity for a) cervical, b) prostate, and c) colorectal cancer patients.
DISCUSSION
Multiple imputation by logistic regression performed well for imputing nativity status for cervical, prostate, and colorectal cancer cases, with a sensitivity ≥ 90% and a specificity ≥ 86% for detecting foreign-born status, with slightly higher sensitivity among cervical and prostate cancer cases (≥ 93%). Using the subset of cases with known nativity status, the agreement between the true and imputed values was excellent (kappa ≥ 0.8) and the misclassification error was 10% or less for all three cancers.
Using California Cancer Registry data, Gomez et al. developed an algorithm to impute nativity based on age at receipt of a social security number5 that is highly sensitive and specific for detecting foreign-born status (sensitivity = 84% and specificity = 80% among Asian breast cancer cases5; sensitivity = 81% and specificity = 80% among Hispanic gastric cancer cases4). While we did not evaluate the same populations, our data suggest that multiple imputation by logistic regression may more accurately impute nativity status than the imputation algorithm based on date of receipt of a social security number. Perhaps more importantly, multiple imputation uses variables available in the SEER data file, making it less labor intensive and more accessible to researchers who do not have administrative rights over the data. Additionally, multiple imputation allows for analyses across larger geographic areas spanning multiple cancer registries. Even for analyses limited to individual registries for which the researcher may obtain social security number data, multiple imputation may be more feasible for imputing nativity in ethnic groups and geographic areas in which a large proportion of the foreign-born population is undocumented and thus lacking a social security number. In 2005, over half of the Hispanic immigrant population in the U.S. (primarily Mexicans) was undocumented38 and in new settlement states, such as those in the Southeast U.S., the rapid growth in the foreign-born population is primarily driven by undocumented immigration.39
Our data indicate that the majority of Hispanic cancer cases lacking birthplace information are U.S.-born, and more commonly diagnosed at an early stage. This non-random distribution of missing data makes common analytic strategies, such as listwise deletion and allocation proportional to the distribution of nativity in the population, extremely prone to bias. Survival analyses are particularly biased given that missing birthplace is significantly more prevalent among cancer survivors.9, 10 For example, among cervical cancer cases, birthplace data were missing for 36.77% of living cases versus 17.04% of the deceased. For this reason, our Kaplan-Meier survival curves indicate drastically different associations between nativity and survival when nativity is imputed by logistic regression versus when cases with missing nativity data are dropped from the dataset. For colorectal cancer, listwise deletion of cases with missing birthplace data resulted in Kaplan-Meier curves suggesting a survival advantage for foreign-born versus U.S.-born Hispanics. However, these survival differences became null after imputing nativity status for those with missing data. For prostate and cervical cancer, the apparent survival advantage of foreign-born men and women was reversed or made null when cases with missing birthplace data were included in the analysis and assigned nativity through multiple imputation.
Our study is subject to a few potential limitations. First, while the sensitivity and specificity of classification are higher than prior methods, our data suggest that imputation by logistic regression misclassifies between seven to 10% of cases with missing data. The misclassification appears to be differential, affecting U.S.-born cases more frequently than foreign-born cases, and may slightly bias the results of the survival analyses. However, as our results indicate, the biases introduced by multiple imputation are substantially smaller than those introduced when cases with missing birthplace information are omitted from the database. Second, certain variables used to impute nativity status, specifically Hispanic origin, which is determined based on medical record review and surname, are also subject to misclassification that varies by subgroup.40 The Hispanic origin variable weighs heavily in the multiple imputation procedure and significantly influences its sensitivity, specificity, and percent misclassification. Third, the Hispanic immigrant population is heterogeneous, with evidence of disparities in cancer incidence and survival among subgroups.41, 42 However, further disaggregation by country/region of origin is not possible given that multiple imputation by logistic regression can only be used to impute a binary variable and thus allocate missing birthplace cases to either U.S.- or foreign-born status.
In conclusion, multiple imputation by logistic regression can be used to impute missing nativity data for the large number of cases that are missing birthplace information using variables readily available in the SEER data file. While we do not prescribe a set group of candidate variables to be used for imputation, the proposed procedure allows for customizable variable selection depending on factors that may be clinically relevant to any particular cancer (e.g., anatomical subsite for colorectal cancer). We propose this multiple imputation strategy as a tool that will allow researchers to disaggregate analyses by nativity and uncover important nativity disparities in regard to cancer diagnosis, treatment, and survival. As the foreign-born population continues to grow, such disaggregation is imperative to cancer disparities research.
Supplementary Material
Acknowledgements
This research is partly supported by a grant from the National Institutes of Health (Grant P01CA082710, PI: M. Follen). JRM and RZ are supported by a UTHealth Innovation for Cancer Prevention Research Postdoctoral (JRM)/Predoctoral (RZ) Fellowship (The University of Texas School of Public Health – Cancer Prevention and Research Institute of Texas grant # RP101503). The content of this manuscript is solely the responsibility of the authors and does not necessarily represent the official views of the National Institutes of Health or the Cancer Prevention and Research Institute of Texas.
Footnotes
Financial Disclosures: The authors do not have any financial disclosures.
REFERENCES
- 1.Grieco ME, Acosta YD, de la Cruz GP, et al. The foreign-born population in the United States: 2010. American Community Survey Reports ACS-19. Washington, DC: U.S. Census Bureau; 2012. [Accessed December 5, 2012]. Available at: http://www.census.gov/prod/2012pubs/acs-19.pdf. [Google Scholar]
- 2.Singh GK, Hiatt RA. Trends and disparities in socioeconomic and behavioural characteristics, life expectancy, and cause-specific mortality of native-born and foreign-born populations in the United States: 1979–2003. Int J Epidemiol. 2006;35(4):903–919. doi: 10.1093/ije/dyl089. [DOI] [PubMed] [Google Scholar]
- 3.Seeff LC, McKenna MT. Cervical cancer mortality among foreign-born women living in the United States: 1985 to 1996. Cancer Detect Prev. 2003;27:203–208. doi: 10.1016/s0361-090x(03)00062-x. [DOI] [PubMed] [Google Scholar]
- 4.Chang ET, Gomez SL, Fish K, et al. Gastric cancer incidence among Hispanics in California: Patterns by time, nativity, and neighborhood characteristics. Cancer Epidemiol Biomarkers Prev. 2012;21(5):709–719. doi: 10.1158/1055-9965.EPI-11-1208. [DOI] [PMC free article] [PubMed] [Google Scholar]
- 5.Gomez SL, Quach T, Horn-Ross PL, et al. Hidden breast cancer disparities in Asian women: Disaggregating incidence rates by ethnicity and migrant status. Am J Public Health. 2010;100(Suppl 1):S125–S131. doi: 10.2105/AJPH.2009.163931. [DOI] [PMC free article] [PubMed] [Google Scholar]
- 6.Nielsen SS, He Y, Ayanian JZ, et al. Quality of cancer care among foreign-born and US-born patients with lung or colorectal cancer. Cancer. 2010;116(23):5497–5506. doi: 10.1002/cncr.25546. [DOI] [PMC free article] [PubMed] [Google Scholar]
- 7. [accessed April 20, 2012];National Cancer Institute, Surveillance, Epidemiology, and End Results (SEER) Program. About SEER. Available from URP: http://seer.cancer/gov/about/
- 8.Clegg LX, Reichman ME, Hankey BF, et al. Quality of race, Hispanic ethnicity, and immigrant status in population-based cancer registry data: Implications for health disparity studies. Cancer Causes & Control. 2007;18(2):177–187. doi: 10.1007/s10552-006-0089-4. [DOI] [PubMed] [Google Scholar]
- 9.Choe JH, Koepsell TD, Heagerty PJ, Taylor VM. Colorectal cancer among Asians and Pacific Islanders in the U.S.: Survival disadvantage for the foreign-born. Cancer Detect Prev. 2005;9(4):361–368. doi: 10.1016/j.cdp.2005.06.002. [DOI] [PubMed] [Google Scholar]
- 10.Lin SS, O'Malley CD, Lui SW. Factors associated with missing birthplace information in a population-based cancer registry. Ethn Dis. 2001;11:598–605. [PubMed] [Google Scholar]
- 11.Lin SS, Clarke CA, O'Malley CD, Le GM. Studying cancer incidence and outcomes in immigrants: Methodological concerns. Am J Public Health. 2002;92(11):1757–1759. doi: 10.2105/ajph.92.11.1757-a. [DOI] [PMC free article] [PubMed] [Google Scholar]
- 12.Gomez SL, Glaser SL, Kelsey JL, Lee MM. Bias in completeness of birthplace data for Asian groups in a population-based cancer registry (United States) Cancer Causes Control. 2004;15(3):243–253. doi: 10.1023/B:CACO.0000024244.91775.64. [DOI] [PubMed] [Google Scholar]
- 13.Gomez SL, Glaser SL. Quality of cancer registry birthplace data for Hispanics living in the United States. Cancer Causes Control. 2005;16(6):713–723. doi: 10.1007/s10552-005-0694-7. [DOI] [PubMed] [Google Scholar]
- 14.Hedeen AN, White E. Breast cancer size and stage in Hispanic American women, by birthplace: 1992–1995. Am J Public Health. 2001;91(1):122–125. doi: 10.2105/ajph.91.1.122. [DOI] [PMC free article] [PubMed] [Google Scholar]
- 15.Hedeen AN, White E, Taylor V. Ethnicity and birthplace in relation to tumor size and stage in Asian American women with breast cancer. Am J Public Health. 1999;89(8):1248–1252. doi: 10.2105/ajph.89.8.1248. [DOI] [PMC free article] [PubMed] [Google Scholar]
- 16.Pineda MD, White E, Kristal AR, Taylor V. Asian breast cancer survival in the US: A comparison between Asian immigrants, US-born Asian Americans and Caucasians. Int J Epidemiol. 2001;30(5):976–982. doi: 10.1093/ije/30.5.976. [DOI] [PubMed] [Google Scholar]
- 17.Cook LS, Goldoft M, Schwartz SM, Weiss NS. Incidence of adenocarcinoma of the prostate in Asian immigrants to the United States and their descendants. J Urol. 1999;161(1):152–155. [PubMed] [Google Scholar]
- 18.Flood DM, Weiss NS, Cook LS, Emerson JC, Schwartz SM, Potter JD. Colorectal cancer incidence in Asian migrants to the United States and their descendants. Cancer Causes Control. 2000;11(5):403–411. doi: 10.1023/a:1008955722425. [DOI] [PubMed] [Google Scholar]
- 19.Kouri EM, He Y, Winer EP, Keating NL. Influence of birthplace on breast cancer diagnosis and treatment for Hispanic women. Breast Cancer Res Treat. 2010;121(3):743–751. doi: 10.1007/s10549-009-0643-3. [DOI] [PubMed] [Google Scholar]
- 20.Herrinton LJ, Goldoft M, Schwartz SM, Weiss NS. The incidence of non-hodgkin's lymphoma and its histologic subtypes in Asian migrants to the United States and their descendants. Cancer Causes Control. 1996;7(2):224–230. doi: 10.1007/BF00051298. [DOI] [PubMed] [Google Scholar]
- 21.Stanford JL, Herrinton LJ, Schwartz SM, Weiss NS. Breast cancer incidence in Asian migrants to the United States and their descendants. Epidemiology. 1995;6(2):181–183. doi: 10.1097/00001648-199503000-00017. [DOI] [PubMed] [Google Scholar]
- 22.Herrinton LJ, Stanford JL, Schwartz SM, Weiss NS. Ovarian cancer incidence among Asian migrants to the United States and their descendants. J Natl Cancer Inst. 1994;86(17):1336–1339. doi: 10.1093/jnci/86.17.1336. [DOI] [PubMed] [Google Scholar]
- 23.Rosenblatt KA, Weiss NS, Schwartz SM. Liver cancer in Asian migrants to the United States and their descendants. Cancer Causes Control. 1996;7(3):345–350. doi: 10.1007/BF00052940. [DOI] [PubMed] [Google Scholar]
- 24.Liao CK, Rosenblatt KA, Schwartz SM, Weiss NS. Endometrial cancer in Asian migrants to the United States and their descendants. Cancer Causes Control. 2003;14(4):357–360. doi: 10.1023/a:1023925010837. [DOI] [PubMed] [Google Scholar]
- 25.Rossing MA, Schwartz SM, Weiss NS. Thyroid cancer incidence in Asian migrants to the United States and their descendants. Cancer Causes Control. 1995;6(5):439–444. doi: 10.1007/BF00052184. [DOI] [PubMed] [Google Scholar]
- 26.Kamineni A, Williams MA, Schwartz SM, Cook LS, Weiss NS. The incidence of gastric carcinoma in Asian migrants to the United States and their descendants. Cancer Causes Control. 1999;10(1):77–83. doi: 10.1023/a:1008849014992. [DOI] [PubMed] [Google Scholar]
- 27.Rubin DB. Multiple imputation for nonresponse in surveys. New York: John Wiley & Sons, Inc; 1987. [Google Scholar]
- 28.Rubin DB, Schenker N. Multiple imputation in health-care databases: An overview and some application. Stat Med. 1991;10:585–598. doi: 10.1002/sim.4780100410. [DOI] [PubMed] [Google Scholar]
- 29.Barnard J MX. Applications of multiple imputation in medical studies: From AIDS to NHANES. Stat Methods Med Res. 1999;8:17–36. doi: 10.1177/096228029900800103. [DOI] [PubMed] [Google Scholar]
- 30.Pew Hispanic Center. Statistical portrait of hispanics in the united states, 2009. 2011 [Google Scholar]
- 31.Fritz A, Jack A, Parkin DM, Percy C, Shanmugarathan S, Sobin L, Whelan S. International classification of diseases for oncology. 3rd ed. Geneva, Switzerland: World Health Organization; 2000. [Google Scholar]
- 32.Surveillance, Epidemiology, and End Results (SEER) Program ( www.seer.cancer.gov). Research data (1973–2008) National Cancer Institute, DCCPS, Surveillance Research Program, Surveillance Systems Branch. Released April 2012.
- 33.Patel DA, Barnholtz-Sloan JS, Patel MK, Malone JM, Chuba PJ, Schwartz K. A population-based study of racial and ethnic differences in survival among women with invasive cervical cancer: Analysis of Surveillance, Epidemiology, and End Results data. Gynecol Oncol. 2005;97(2):550–558. doi: 10.1016/j.ygyno.2005.01.045. [DOI] [PubMed] [Google Scholar]
- 34.SAS OnlineDoc, version 8. Cary, NC: SAS Institute Inc; 2000. SAS Institute Inc. Chapter 9: The MI procedure; pp. 129–200. [Google Scholar]
- 35.Yuan YC. Multiple imputation for missing data: Concepts and new development (version 9.0) Cary, NC: SAS Institute; 2000. [Accessed October 10, 2012]. Available at: http://support.sas.com/rnd/app/stat/papers/multipleimputation.pdf. [Google Scholar]
- 36.Howlader N, Noone AM, Krapcho M, et al. SEER cancer statistics review: 1975–2008 (Vintage 2008 Populations) Bethesda, MD: National Cancer Institute; Available from URL: http://seer.cancer.gov/csr/1975_2008/, based on November 2010 SEER data submission, posted to the SEER web site, April 2011. [Google Scholar]
- 37.Landis JR, Koch GG. The measurement of observer agreement for categorical data. Biometrics. 1977;33:159–174. [PubMed] [Google Scholar]
- 38.Passel JS. Size and characteristics of the unauthorized migrant population in the U.S. Washington, DC: Pew Hispanic Center; 2006. [Accessed: November 29, 2012]. Available at: http://www.pewhispanic.org/2006/03/07/size-and-characteristics-of-the-unauthorizedmigrant-population-in-the-us/ [Google Scholar]
- 39.Passel JS. Estimates of the size and characteristics of the undocumented population. Washington, DC: Pew Hispanic Center; 2005. [Accessed December 10, 2012]. Available at: http://pewhispanic.org/files/reports/44.pdf. [Google Scholar]
- 40.Swallen KC, West DW, Stewart SL, Glaser SL, Horn-Ross PL. Predictors of misclassification of Hispanic ethnicity in a population-based cancer registry. Ann Epidemiol. 1997;7(3):200–206. doi: 10.1016/s1047-2797(96)00154-8. [DOI] [PubMed] [Google Scholar]
- 41.Pinheiro PS, Williams M, Miller EA, Easterday S, Moonie S, Trapido EJ. Cancer survival among Latinos and the Hispanic paradox. Cancer Causes Control. 2011;22(4):553–561. doi: 10.1007/s10552-011-9727-6. [DOI] [PubMed] [Google Scholar]
- 42.Martinez-Tyson D, Pathak EB, Soler-Vila H, Flores AM. Looking under the Hispanic umbrella: Cancer mortality among Cubans, Mexicans, Puerto Ricans and other Hispanics in Florida. J Immigr Minor Health. 2009;11(4):249–257. doi: 10.1007/s10903-008-9152-4. [DOI] [PMC free article] [PubMed] [Google Scholar]
Associated Data
This section collects any data citations, data availability statements, or supplementary materials included in this article.


