

Abstract
OBJECTIVE
The NLRP3 inflammasome plays an important regulatory role in obesity-induced insulin resistance. NSAID activated gene-1 (NAG-1) is a divergent member of the TGF-β superfamily. NAG-1 Tg mice are resistant to dietary- and genetic-induced obesity and have improved insulin sensitivity. Our objective was to examine whether NLRP3 inflammasome activity is associated with this observed phenotype in NAG-1 Tg mice.
DESIGN AND METHODS
Key components of the NLRP3 inflammasome were examined in NAG-1 Tg mice on both regular and high fat diet (HFD) conditions.
RESULTS
The expression of caspase-1 and ASC, key components of the NLRP3 inflammasome, is significantly reduced at mRNA and protein levels in white adipose tissue (WAT) of NAG-1 Tg mice. HFD increases the expression of caspase-1 and ASC in WT mice, but their expression is reduced in NAG-1 Tg mice. Furthermore, there is reduced IL-18, IL-1β, and TNF-α expression in the WAT of NAG-1 Tg mice. NAG-1 Tg mice have significantly lower serum leptin and insulin levels and reduced expression of macrophage infiltration markers (F4/80, CD11b, and CD11c) in WAT.
CONCLUSIONS
Our study suggests the lower NLRP3 inflammasome activity may play a role in the resistance of NAG-1 Tg mice to diet-induced obesity and improved insulin sensitivity.
Keywords: NAG-1, WAT, inflammasome, caspase-1, IL-1β
Introduction
Obesity and chronic inflammation are key contributors to insulin resistance and type 2 diabetes (1). The mechanistic link between obesity-induced chronic inflammation and insulin resistance has been extensively investigated over the past decades. Accumulating evidence suggests that cytokines of the interleukin-1 (IL-1) family, particularly IL-1β and IL-18, are involved in obesity-associated inflammation and cause insulin resistance (2). IL-1β treatment reduces the insulin-induced glucose uptake in murine 3T3 adipocytes (3). During adipocyte differentiation, IL-1β strongly reduces the expression of the insulin sensitivity gene PPARγ, adiponectin, and GLUT4, and decreases adipocyte differentiation and fat accumulation (4). In addition, IL-1β deletion protects against high fat diet (HFD)-induced adipose tissue inflammation (5). Mice on a HFD show increased IL-1β protein levels in adipose tissue compared to low fat diet mice (6). These results strongly suggest that IL-1β released from adipose tissue is associated with obesity and insulin resistance. Similarly, circulating IL-18 has been positively associated with increased risk of insulin resistance and type 2 diabetes (7, 8). However, IL-18 or IL-18 receptor deficient mice were reported to exhibit hyperphagia and insulin resistance (9), suggesting a more complex role for IL-18 in the homeostasis of energy intake and insulin sensitivity.
Pro-IL-1β and pro-IL-18 have no biological activity until they are processed by the cysteine protease caspase-1, which is activated by a multiprotein complex called the NLRP3 inflammasome (2). Caspase-1 itself is activated by conformational changes in the NLRP3 inflammasome, consisting of caspase-1 and proteins of the NACHT-LRR (NLR) family, including NLRP3 (also called Cryopyrin) and the apoptosis-associated speck-like protein (ASC) (10). Although NLRP3 is the most extensively studied inflammasome, other inflammasomes have been identified, including NLR family pyrin domain-containing 1 (NLRP1), NLRP6, AIM2 and IPAF (10). Several studies link the activation of the NLRP3 inflammasome to metabolic disorders (11, 12). Researchers have studied the role of inflammasome-dependent activation of caspase-1 in adipose tissue. Inhibition of caspase-1 by the specific inhibitor pralnacasan in obese ob/ob mice reduces weight gain and significantly enhances insulin sensitivity (4). In addition, mice genetically deficient for caspase-1 are protected against HFD-induced insulin resistance and obesity (4, 13). Furthermore, mice deficient in NLRP3 and ASC are also resistant to development of HFD-induced obesity (11). Collectively, these data suggest that the inflammasome NLRP3 is a central player in the induction of obesity and increased insulin resistance.
Nonsteroidal anti-inflammatory drug (NSAID) activated gene-1, NAG-1, is a divergent member of the transforming growth factor-beta (TGF-β) superfamily that plays a complex, but poorly understood role in several human diseases (14). Previous studies from our laboratory suggest that the NAG-1 transgenic mouse, which ubiquitously over-expresses the human NAG-1 gene (hNAG-1), has reduced body weight and fat mass (15). Recently, we found that NAG-1 Tg mice have increased glucose tolerance accompanied by increased oxidative metabolism and energy expenditure (submitted). Further, we found that NAG-1 Tg mice are resistant to both dietary- and genetic-induced obesity upon HFD treatment (submitted). These data suggest that NAG-1 plays a protective role in the development of obesity and insulin resistance.
NAG-1 Tg mice have a reduced inflammatory response to LPS exhibited by a reduction in the release of cytokines KC, IL-6, MCP-1 and TNF-α (16), suggesting a role for NAG-1 in inflammation. However, the role of the inflammasome in NAG-1 Tg mice has not been characterized. The similarity between the ASC and caspase-1 knockout mice, and NAG-1 Tg mice points to NAG-1 potentially having an effect on inflammasome. We suspected that a reduction in inflammasome activity could be a contributing factor to the resistance of NAG-1 Tg mice to dietary induced obesity and improved insulin sensitivity.
To test this hypothesis, we examined the activity of the NLRP3 inflammasome and inflammatory cytokine expressions, including IL-1β, IL-18, and TNF-α, under basal and HFD conditions in the NAG-1 Tg mice. A lower expression of NLRP3 proteins and a lower NLRP3 inflammasome activity was observed in the NAG-1 Tg mice fed with either low-fat or high fat diet. This finding provides a potential mechanism for the resistance of NAG-1 Tg mice to diet-induced obesity and improved insulin sensitivity.
Materials and Methods
Materials
Polyclonal TMS1 (ASC or PYCARD) was purchased from Cell Signaling (Danvers, MA). Polyclonal caspase-1 (P10) was obtained from Santa Cruz Biotechnology (Santa Cruz, CA), and polyclonal NALP3 (NLRP3) was from Thermo Scientific (Cincinnati, OH). Taqman® Gene Expression Assay kits were all purchased from Applied Biosystems (Foster City, CA). Mouse leptin and adiponectin ELISA kits were from R&D (Minneapolis, MN) and insulin ELISA kit was from Alpco (Salem, NH).
Animal Study
NAG-1 transgenic mice were previously generated to ubiquitously express human NAG-1 using protamine Cre mice (15) on C57/BL6 background. Experiments were performed in accordance with the “NIH Guidelines for the Use and Care of Laboratory Animals” at the National Institute of Environmental Health Sciences (NIEHS) animal facility under an approved animal protocol. Both female and male mice at 30 week old on normal NIH31 chow diet were used for basal expression level of inflammatory cytokines and inflammasome components (n=5 to 6/ genotype for each gender). For the HFD study, 20 week old male or female mice (6/group per gender) were placed on LFD and HFD (10% and 60% kcal fat from Research Diets, New Brunswick, NJ) for 12 weeks. At endpoints, mice were euthanized by CO2. Body weights and abdominal WAT mass were measured. Abdominal WATs were snap-frozen in liquid nitrogen and stored at for further biological analysis. A small section of WAT was fixed in formalin for histology analysis. Due to the similarity between male and female mice only data from male mice are presented.
Real-time PCR
Total RNA from WAT was isolated using QIAzol reagent from Qiagen (Valencia, CA) and further purified using RNeasy kit according to instructions. Gene expression was analyzed using qRT-PCR as described (17). GAPDH was used as the reference gene.
Western Blot
Western Blot was performed as previously described (17). Briefly, a total of 45 μg protein from WAT was electrophoresed and transferred. After blocking, blots were probed overnight at 4°C with following antibodies, TMS1 (PYCARD), caspase-1 (P10), and NLRP3, at the dilutions as recommended by their manufactures. GAPDH was used for loading control.
ELISA Analysis
Serum samples were collected at necropsy. ELISA for mLeptin, mInsulin, and mAdiponectin were performed according to manufacturer’s instructions.
Insulin Tolerance Test
Fifteen week old male WT or NAG-1 transgenic mice (8/genotype) were fasted 4 h before 0.8 U/kg insulin was intraperitoneally injected. Blood glucose was measured at the indicated time points via tail bleeding using Alpha Trak Glucometer from Abbot Laboratories (Chicago, IL).
Statistical Analysis
Data were analyzed by Dr. Grace Kissling at NIEHS Biostatistics Branch to determine the appropriate method and p-value (Student’s t- test and Two-way RM ANOVA). The data is presented as mean ± S. E. and p value at 0.05 for statistical significance.
Results
NAG-1 Tg mice have reduced body/WAT weight and reduced IL-18 and IL-1β expression
Consistent with previous findings, mean body weights of NAG-1 Tg mice are significantly reduced compared to WT littermates (Figure 1A, p<0.01). Total WAT weight for NAG-1 mice is also significantly reduced by almost 70% compared to WT littermates (Figure 1B, p<0.001). Because IL-18 and IL-1β are produced upon inflammasome activation and associated with insulin resistance, we measured the expressions of IL-18 and IL-1β by qRT-PCR in WAT from 18 week-old mice fed a normal chow diet. Interestingly, IL-18 mRNA expression in WAT in NAG-1 Tg mice is approximately 50% of WT littermates (Figure 1C, p<0.001). Similarly, the mRNA level of IL-1β is also about 50% reduced in WAT in NAG-1 Tg mice as compared to WT littermates (Figure 1D, p<0.05). Thus, the basal level of the pro-inflammatory cytokines IL-18 and IL-1β are reduced in NAG-1 Tg mice, suggesting NAG-1 may inhibit their expression directly or indirectly.
Figure 1. NAG-1 Tg mice have reduced body/WAT weight and reduced IL-18 and IL-1β expression.

(A) Body weight is reduced in 30 wk old male NAG-1 Tg mice (n=6 mice per group) fed on chow diet. (B) Total WAT is reduced in NAG-1 Tg mice (n=6) fed on chow diet. (C) Expression of IL-18 at mRNA level in WAT is reduced in NAG-1 Tg mice. (D) Expression of IL-β at mRNA level in WAT is reduced in NAG-1 Tg mice. The solid bars are the wild-type littermates and open bars are the NAG-1 mice (n=6 mice per group). Data are presented as mean ± SE. *p<0.05, **p<0.01 and ***p<0.001 as determined by Student’s t-test.
Expression of the components of the NLRP3 inflammasome are reduced in NAG-1 Tg mice
Because the NLRP3 inflammasome is recognized as an important regulator of the production of IL-18 and IL-1β, we measured the expression of the components of the NLRP3 inflammasome in WAT of NAG-1 Tg mice. As shown in Figure 2A, the relative gene expression levels of caspase-1 is significantly reduced by 48% in the WAT of NAG-1 Tg mice compared to WT littermates as determined by qRT-PCR. In addition, Western blot analysis reveals that the pro-caspase-1 expression (45kDa) is lower in NAG-1 Tg mice compared to WT littermates (Figure 2B). There is a dramatic reduction in the level of cleaved caspase-1 (10kDa) observed in WAT in NAG-1 Tg mice (Figure 2B), suggesting reduced caspase-1 activity in the NAG-1 Tg mice compared to WT mice. The mRNA expression of ASC (PYCARD) is reduced in NAG-1 Tg mice compared to WT littermates, but is not statistically significant. However, the expression of ASC is greatly reduced in the WAT of NAG-1 Tg mice compared to the WT littermates as determined by Western blot (Figure 2B). In contrast, neither the expression of NLRP3 at mRNA or protein levels was different in the WAT between NAG-1 Tg and WT mice (Figure 2A and 2B). These data suggest that NAG-1 Tg mice have lower expression of key components of NLRP3 inflammasome and a reduced inflammasome activity.
Figure 2. NAG-1 Tg mice have reduced caspase-1 activity determined by qRT-PCR and Western blot.
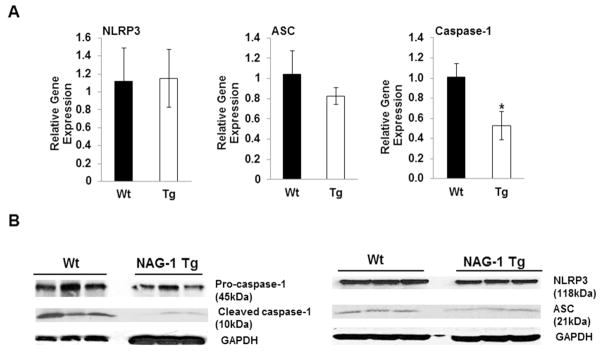
(A) Real-time PCR analysis of mNLRP3, PYCARD and caspase-1 gene expressions at mRNA level in WAT of 15 wk old NAG-1 Tg and WT mice fed on chow diet (n=6 mice per group). (B) Western blot analyses of NLRP3 (NALP3), ASC (PYCARD), pro-caspase-1 (45kDa), and cleaved-caspase-1 (10kDa) basal expression levels in WAT fed on chow diet. GAPDH was used as a loading control. Expressions of PYCARD and both pro- and cleaved-caspase-1 are lower in NAG-1 Tg mice compared to WT mice (data represent 3 mice per group). Data is presented as ± SE. *p<0.05 as determined by Student’s t-test.
Levels of proinflammatory cytokines are lower in NAG-1 Tg mice on HFD diet
We next examined whether the level of inflammatory cytokines are inhibited in WAT of NAG-1 Tg mice on HFD. We confirmed NAG-1 Tg mice are resistant to HFD-induced body weight gain and WAT mass gain (Figure 3A, 3B). As shown in Figure 3, HFD significantly increased the mRNA level of IL-18, IL-1β and TNF-α in WAT compared to LFD in WT mice. The relative gene expressions of IL-18, IL-1β and TNF-α in the WAT are significantly lower in NAG-1 Tg mice on both LFD and HFD treatment compared to WT littermates (Figure 3C–E). Collectively, these data suggest that NAG-1 transgenic mice have reduced inflammation and may be regulated by NLRP3 inflammasome.
Figure 3. NAG-1 Tg mice on HFD have reduced body/WAT weight and reduced IL-18, IL-1β and TNF-α expression.

(A) Body weight is reduced in 32 wk old NAG-1 Tg mice (n=6 mice per group) fed on HFD. (B) Total WAT is reduced in NAG-1 Tg mice (n=5–7) fed on HFD. Relative gene expression of IL-18 (C), IL-β (D), and TNF-α (E) at mRNA level in WAT is reduced in NAG-1 Tg mice both on LFD and HFD as determined by qRT-PCR. The solid bars are the wild-type littermates and open bars are the NAG-1 mice (n=5–7 mice per group). Data are presented as mean ± SE. *p<0.05, **p<0.01, and ***p<0.001 as determined by Student’s t-test.
Levels of NLRP3 inflammasomes are reduced in NAG-1 Tg mice upon HFD treatment
Several studies suggest that HFD induces inflammasome activation and thus increases IL-1β production and increases insulin resistance (4, 12). Therefore, we investigated the effects of NAG-1 on HFD-induced expression of the NLRP3 inflammasome in NAG-1 Tg mice. Similar to mice fed on chow diet, the relative expression of NLRP3 in WAT after HFD treatment is not significantly different between NAG-1 Tg mice and WT littermates as determined by qRT-PCR or Western blot, respectively (Figure 4A, 4B). In contrast, the expression of ASC is significantly reduced in WAT of NAG-1 Tg mice on HFD as determined by qRT-PCR and Western blot analysis (Figure 4A, 4B). An induction of ASC and caspase-1 expression at both mRNA and protein level by HFD treatment is observed in the WT mice (Figure 4A, 4B). HFD increases the expression pro-caspase-1 (45kDA) as compared to the control diet in WT mice, and increases the amount of cleaved caspase-1 (10kDA) in WT mice (Figure 4B). The expressions of pro-caspase-1 (45 kDA) and cleaved caspase-1 (10 kDa) in WAT are significantly reduced in NAG-1 Tg mice as compared to WT littermates (Figure 4B). The expression level of Caspase-1 at the mRNA level is significantly reduced in NAG-1 Tg mice on both the LFD (p<0.05) and HFD (p<0.001) compared to WT mice (Figure 4A). Thus, decreased protein and relative gene expression levels of caspase-1 and PYCARD, in the WAT of NAG-1 Tg mice, is consistent with the reduction in NLRP3 inflammasome activity and IL-18 and IL-1β expression.
Figure 4. NAG-1 Tg mice on a HFD have lower inflammasome activity in WAT.

(A) Relative gene expression of components of the NLRP3 inflammasome: PYCARD (ASC), NLRP3, and pro-caspase-1 in the WAT of WT and NAG-1 Tg mice fed on HFD determined by Real-time PCR analysis (n=5–7 mice per group). (B) Western blot analysis of pro-caspase-1 (45kDa), cleaved-caspase-1 (10kDa), NLRP3 (NALP3) and PYCARD (ASC) in WAT of WT and NAG-1Tg mice fed on HFD. GAPDH was used as a loading control. Expressions of PYCARD and both pro- and cleaved-caspase-1 are lower in NAG-1 Tg mice compared to WT mice. PYCARD expression is lower in the WAT of NAG-1 Tg mice on HFD compared to WT mice on HFD, while NLRP3 (NALP3) expression is unchanged (data represent 4 mice per group). Data are presented as ± SE. *p<0.05, **p<0.01, and ***p<0.001 as determined by Student’s t-test.
NAG-1 Tg mice have improved insulin sensitivity and reduced macrophage infiltration
We next investigated whether NAG-1 Tg mice are more insulin sensitive upon HFD treatment than WT littermates. As shown in Figure 5A, NAG-1 Tg mice have significantly lower levels of leptin and insulin compared to WT littermates, suggesting that the transgenic mice are more insulin sensitive. HFD significantly increased serum leptin and insulin levels in WT mice compared to LFD WT mice (Figure 5A). In contrast, serum adiponectin level that inversely correlates with fat content and body weight (18, 19), is significantly reduced upon HFD in WT mice. However, this reduction is attenuated in NAG-1 Tg mice though at a nonsignificant level (Figure 5A). Smaller adipocyte size has been linked to increased insulin sensitivity (Roberts et al., 2009; Lundgren et al., 2007). Indeed, NAG-1 Tg mice have smaller adipocytes than WT mice (Figure 5B). In addition, an insulin tolerance test indicates that NAG-1 Tg mice have lower blood glucose levels and are more insulin sensitive than their WT littermates (Figure 5C). During obesity, macrophages infiltrate into WAT and represent the largest population of NLRP3 expressing cells in WAT that release inflammatory cytokines. As shown in Figure 5D, HFD significantly induced gene expression of three key markers of macrophage infiltration into WAT in WT mice, including F4/80, CD11b and CD11c. The mRNA level of MCP-1, a gene which contributes to macrophage infiltration into adipose tissue and insulin resistance, is also significantly increased in WT mice upon HFD treatment (Figure 5D, p<0.001). Interestingly, the mRNA levels of F4/80, CD11b, CD11c and MCP-1 are significantly reduced in NAG-1 Tg mice compared to their WT littermates upon either LFD or HFD treatment (Figure 5D). Collectively, these data suggest that NAG-1 Tg mice inhibit macrophage infiltration into WAT, potentially playing an important role in inhibiting inflammasome activity and increasing insulin sensitivity.
Figure 5. NAG-1 Tg mice have improved insulin sensitivity and reduced macrophage infiltration.

(A) Serum levels of leptin, adiponectin and insulin in WT and NAG-1 Tg mice upon LFD or HFD treatment. (B). Adipocytes are smaller in NAG-1 Tg mice compared to WT littermates as determined by H&E staining (200x magnification). (C). Insulin tolerance test demonstrates NAG-1 Tg mice have improved insulin sensitivity (n=7–8/group). (D) Relative gene expression of macrophage infiltration markers F4/80, CD11b, and CD11c, and MCP-1, a contributor to macrophage infiltration, upon HFD diet are significantly inhibited in WAT of NAG-1 Tg mice compared to WT littermates (n=5–7 /group). Data are presented as ± SE. *p<0.05, **p<0.01, and ***p<0.001 as determined by Student’s t-test.
Discussion
Accumulating evidence links inflammation to metabolic changes associated with obesity and type-2 diabetes (20). Obesity is characterized by chronic imbalance between energy intake and energy expenditure, resulting in the storage of excess fat in WAT. Adipose tissue acts as endocrine tissue, secreting hormones and cytokines known as adipokines (21). In obese conditions, adipose tissue is enlarged, leading to infiltration by macrophages, and an elevated inflammatory state occurs (22). NOD-like receptors (NLRs) are reported to detect danger-associated molecular patterns (DAMPs) that derive from cells releasing pro-inflammatory cytokines (23). Activation of the inflammasome complex leads to activation of caspase-1 and secretion of IL-1β and IL-18 and subsequent development of insulin resistance (23).
In this study, we found lower NLRP3 inflammasome activity in NAG-1 Tg mice that appears to be the result of lower expression of key proteins in the NLRP3 complex. Pro-caspase-1, cleaved-caspase-1, and ASC expressions are significantly reduced in the NAG-1 Tg mouse. In the WAT, expression of IL-1β and IL-18 and TNF-α are lower in NAG-1 Tg mice consistent with a reduced caspase-1 activity. Furthermore, the expected increase in caspase-1 and ASC expressions after HFD feeding are attenuated in the NAG-1 Tg mice, and is accompanied by reduced expressions of IL-1β, TNF-α, and IL-18. Thus, decreased protein and relative gene expression levels of caspase-1 and ASC, in the WAT of NAG-1 Tg mice, is consistent with the reduction in the NLRP3 inflammasome activity. However, we could not rule out the possibility that the reduced NLRP3 inflammasome activities are simply due, in part, to reduced body weight and less WAT in NAG-1 Tg mice.
Both ASC and caspase-1 knockout mice have smaller adipocyte size and fat mass, increased insulin sensitivity, do not gain as much weight on a HFD despite similar food intake, and increased metabolic activity as compared to WT littermates (4, 11). Similarly, NAG-1 Tg mice are resistant to HFD-induced obesity and demonstrate improved glucose utilization and increased insulin sensitivity. Adipocytes are also smaller in NAG-1 Tg mice compared to WT littermates, and smaller adipocytes are associated with improved insulin sensitivity (24–26). The three key components of the NLRP3 inflammasome, ASC, caspase-1 and NLRP3 play important roles in sensing obesity-associated danger signals. However, caspase-1 seems to be the most crucial regulator (2). Caspase-1 and ASC knockout mice both are resistant to HFD-induced insulin sensitivity and adipocyte hypertrophy (2, 11). However, NLRP3−/− mice show a modest response to HFD (2, 11), suggesting that NLRP3 probably plays an indirect role. Consistently, we did not see significant changes in NLRP3 expression at protein nor mRNA levels in WAT of NAG-1 Tg mice regardless of dietary treatment. We observed a more dramatic and significant inhibition of caspase-1 expression and activity compared to ASC and NLRP3 in NAG-1 Tg mice. Our results show that considerable similarities exist between NAG-1 Tg mice and caspase-1-, and ASC-knockout mice in regard to the resistance to HFD and changes in the NLRP3 inflammasome activity.
Other than playing a role in obesity-induced chronic inflammation and insulin resistance through releasing IL-18 and IL-1β, caspase-1 has been shown to be involved in energy metabolism (11, 13). Stienstra et al. found that caspase-1 deficient mice have increased energy expenditure, suggesting effects on adipocyte growth, differentiation and metabolism (4, 11). In addition, caspase-1 played a direct role in the regulation of TG-rich lipoprotein and reduced intestinal fat absorption, metabolism that could contribute to the reduction in adipose tissue mass in caspase-1−/− mice, thereby limiting the availability of lipids for peripheral storage. (13). Both increased energy expenditure and limited availability of lipids for peripheral storage may at least in part, explain the marked reduction in adipose tissue that was observed in the caspase-1 knockout mice. The NAG-1 Tg mice also have an increase in energy expenditure (submitted) suggesting a possible association with reduced inflammasome activity that was observed in NAG-1 Tg mice. Our study suggests that the NLRP3 inflammasome may play an important mechanistic role in the resistance of NAG-1 Tg mice to HFD-induced obesity and insulin resistance. This is the first study to examine a positive link between NAG-1 and inflammasome activity in an animal model. Results from our study suggest that NAG-1 may have potential therapeutic value in treating or preventing obesity and type-2 diabetes.
Obesity is associated with increased inflammation and macrophage infiltration in WAT. A wide variety of immune cells, including macrophages, are shown to infiltrate the adipose tissue and affect its homeostasis by releasing inflammatory cytokines, such as IL-1β (27). Macrophages are the predominant cellular sources of IL-1β. Macrophages are recruited to adipose tissue during obesity and represent the largest population of NLRP3 expressing cells in fat (27). Adipocytes are also capable of releasing inflammatory mediators and contributing to the inflammatory response. However, the NLRP3 inflammasome is expressed predominantly in circulating monocytes and tissue macrophage (28). Here, we found that the expression of the key markers of macrophage infiltration into WAT, F4/80, CD11b, and CD11c, are significantly reduced in the NAG-1-Tg mice on either the LFD or HFD, suggesting NAG-1 inhibits macrophage infiltration into WAT. This decreased macrophage presence is consistent with reduced fat stores and smaller adipocyte size in NAG-1 Tg mice. MCP-1 is a key molecule that mediates macrophage infiltration (29). Previously, we reported that the relative gene expression of MCP-1 is significantly reduced in NAG-1 Tg mice upon LPS stimulation (16). In this study, we found the induction of MCP-1 upon HFD treatment was dramatically attenuated in NAG-1 Tg mice. Based on these observations, it would be interesting to speculate that NAG-1 may inhibit macrophage infiltration into WAT, thus decreasing the resources for NLRP3 activation upon danger signal stimulation and consequently reducing IL-1β activation, leading to increased insulin sensitivity and resistant to obesity as observed in the NAG-1 mouse model.
The effect of hNAG-1 on human obesity is unclear, with some studies showing a positive correlation between obesity and serum hNAG-1 levels, while others report a negative correlation (30–33). NAG-1 has been implicated in mediation of tumor-induced cachexia and weight loss. Johnen et al. report that elevated levels of NAG-1 observed in cancer patients appear to be related to cachexia (34). Ding et al. report that NAG-1 mRNA level was negatively associated with body mass index and body fat mass in human subjects (30). However, increased serum levels of NAG-1 are found in patients with obesity and type-2 diabetes (31). Circulating levels of NAG-1 are elevated in many health conditions including pregnancy, late stage cancer, and cardiovascular disease (14). The exact role of NAG-1 during physiological and pathological conditions is still not clear. In contrast to the contradictory role for NAG-1 in humans, results from animal studies, in general, consistently show that NAG-1 plays an negative role in weight gain and obesity. Both our laboratory and others find that NAG-1 expression in mice reduced body weight and WAT (15, 16, 34). In xenograft mouse models, nude mice with tumors expressing hNAG-1 show decreases in body weight and fat (17, 34). We also found the NAG-1 Tg mice are resistant to both dietary- and genetic-induced obesity. However, the mechanism for the reduction of adipose tissue and body weight in mice by NAG-1 are complex and appears to be mediated by changes in the energy metabolism and a lower expression/activity of the NLRP3 inflammasome.
In conclusion, we examined the association between the NLRP3 inflammasome and weight loss and improved glucose utilization in NAG-1 Tg mice. Our results indicate that lower NLRP3 inflammasome activity may play a role in the resistance of NAG-1 Tg mice to diet-induced obesity and improved insulin sensitivity. NAG-1 may be an important regulator in the complex network controlling the development of obesity. Therefore, factors that control inflammasome activation may have therapeutic implications in the prevention and treatment of obesity and type 2 diabetes.
What is already known about this subject?
The NLRP3 inflammasome that regulates IL-18 and IL-1β secretion is associated with obesity-induced insulin resistance.
NAG-1, a member of transforming growth factor-β, plays a role in obesity and weight loss.
What does this study add?
This study shows that NAG-1 may regulate the expression and activity of the NLRP3 inflammasome in NAG-1 Tg mice.
Our results provide an explanation as to why NAG-1 Tg mice are resistant to HFD-induced obesity and have improved insulin sensitivity.
Our study suggests that NAG-1 may have potential therapeutic value in treating or preventing obesity and type-2 diabetes.
Acknowledgments
Xingya Wang, Kali Chrysovergis and Justin Kosak contributed equally to this manuscript. We thank Drs. Xiaoling Li and Paul Wade for critical reading of this manuscript. We wish to thank Julie Foley at NIEHS Pathology Core for performing H&E staining on WAT. There are no conflicts of interests. This research was supported by NIH, NIEHS Intramural Research Program (Eling) Z01- ES010016-14.
Footnotes
Conflicts of interest
The authors declare no conflicts of interests.
References
- 1.Wen H, Gris D, Lei Y, et al. Fatty acid-induced NLRP3-ASC inflammasome activation interferes with insulin signaling. Nat Immunol. 2011;12:408–15. doi: 10.1038/ni.2022. [DOI] [PMC free article] [PubMed] [Google Scholar]
- 2.Tack CJ, Stienstra R, Joosten LA, Netea MG. Inflammation links excess fat to insulin resistance: the role of the interleukin-1 family. Immunol Rev. 2012;249:239–52. doi: 10.1111/j.1600-065X.2012.01145.x. [DOI] [PubMed] [Google Scholar]
- 3.Jager J, Gremeaux T, Cormont M, Le Marchand-Brustel Y, Tanti JF. Interleukin-1beta-induced insulin resistance in adipocytes through down-regulation of insulin receptor substrate-1 expression. Endocrinology. 2007;148:241–51. doi: 10.1210/en.2006-0692. [DOI] [PMC free article] [PubMed] [Google Scholar]
- 4.Stienstra R, Joosten LA, Koenen T, et al. The inflammasome-mediated caspase-1 activation controls adipocyte differentiation and insulin sensitivity. Cell Metab. 2010;12:593–605. doi: 10.1016/j.cmet.2010.11.011. [DOI] [PMC free article] [PubMed] [Google Scholar]
- 5.McGillicuddy FC, Harford KA, Reynolds CM, et al. Lack of interleukin-1 receptor I (IL-1RI) protects mice from high-fat diet-induced adipose tissue inflammation coincident with improved glucose homeostasis. Diabetes. 2011;60:1688–98. doi: 10.2337/db10-1278. [DOI] [PMC free article] [PubMed] [Google Scholar]
- 6.Koenen TB, Stienstra R, van Tits LJ, et al. The inflammasome and caspase-1 activation: a new mechanism underlying increased inflammatory activity in human visceral adipose tissue. Endocrinology. 2011;152:3769–78. doi: 10.1210/en.2010-1480. [DOI] [PubMed] [Google Scholar]
- 7.Ahmad R, Al-Mass A, Al-Ghawas D, et al. Interaction of osteopontin with IL-18 in obese individuals: implications for insulin resistance. PLoS One. 2013;8:e63944. doi: 10.1371/journal.pone.0063944. [DOI] [PMC free article] [PubMed] [Google Scholar]
- 8.Lindegaard B, Matthews VB, Brandt C, et al. Interleukin-18 activates skeletal muscle AMPK and reduces weight gain and insulin resistance in mice. Diabetes. 2013 doi: 10.2337/db12-1095. [DOI] [PMC free article] [PubMed] [Google Scholar]
- 9.Netea MG, Joosten LA, Lewis E, et al. Deficiency of interleukin-18 in mice leads to hyperphagia, obesity and insulin resistance. Nat Med. 2006;12:650–6. doi: 10.1038/nm1415. [DOI] [PubMed] [Google Scholar]
- 10.Horng T, Hotamisligil GS. Linking the inflammasome to obesity-related disease. Nat Med. 2011;17:164–5. doi: 10.1038/nm0211-164. [DOI] [PubMed] [Google Scholar]
- 11.Stienstra R, van Diepen JA, Tack CJ, et al. Inflammasome is a central player in the induction of obesity and insulin resistance. Proc Natl Acad Sci U S A. 2011;108:15324–9. doi: 10.1073/pnas.1100255108. [DOI] [PMC free article] [PubMed] [Google Scholar]
- 12.Vandanmagsar B, Youm YH, Ravussin A, et al. The NLRP3 inflammasome instigates obesity-induced inflammation and insulin resistance. Nat Med. 2011;17:179–88. doi: 10.1038/nm.2279. [DOI] [PMC free article] [PubMed] [Google Scholar]
- 13.van Diepen JA, Stienstra R, Vroegrijk IO, et al. Caspase-1 deficiency in mice reduces intestinal triglyceride absorption and hepatic triglyceride secretion. J Lipid Res. 2013;54:448–56. doi: 10.1194/jlr.M031963. [DOI] [PMC free article] [PubMed] [Google Scholar]
- 14.Wang X, Baek SJ, Eling TE. The diverse roles of nonsteroidal anti-inflammatory drug activated gene (NAG-1/GDF15) in cancer. Biochem Pharmacol. 2013;85:597–606. doi: 10.1016/j.bcp.2012.11.025. [DOI] [PMC free article] [PubMed] [Google Scholar]
- 15.Baek SJ, Okazaki R, Lee SH, et al. Nonsteroidal anti-inflammatory drug-activated gene-1 over expression in transgenic mice suppresses intestinal neoplasia. Gastroenterology. 2006;131:1553–60. doi: 10.1053/j.gastro.2006.09.015. [DOI] [PubMed] [Google Scholar]
- 16.Kim JM, Kosak JP, Kim JK, et al. NAG-1/GDF15 Transgenic Mouse Has Less White Adipose Tissue and a Reduced Inflammatory Response. Mediators Inflamm. 2013;2013:641851. doi: 10.1155/2013/641851. [DOI] [PMC free article] [PubMed] [Google Scholar]
- 17.Wang X, Chrysovergis K, Bienstock RJ, Shim M, Eling TE. The H6D variant of NAG-1/GDF15 inhibits prostate xenograft growth in vivo. Prostate. 2012;72:677–89. doi: 10.1002/pros.21471. [DOI] [PMC free article] [PubMed] [Google Scholar]
- 18.Farvid MS, Ng TW, Chan DC, Barrett PH, Watts GF. Association of adiponectin and resistin with adipose tissue compartments, insulin resistance and dyslipidaemia. Diabetes Obes Metab. 2005;7:406–13. doi: 10.1111/j.1463-1326.2004.00410.x. [DOI] [PubMed] [Google Scholar]
- 19.Mojiminiyi OA, Abdella NA, Al Arouj M, Ben Nakhi A. Adiponectin, insulin resistance and clinical expression of the metabolic syndrome in patients with Type 2 diabetes. Int J Obes (Lond) 2007;31:213–20. doi: 10.1038/sj.ijo.0803355. [DOI] [PubMed] [Google Scholar]
- 20.Donath MY, Shoelson SE. Type 2 diabetes as an inflammatory disease. Nat Rev Immunol. 2011;11:98–107. doi: 10.1038/nri2925. [DOI] [PubMed] [Google Scholar]
- 21.Ahima RS. Adipose tissue as an endocrine organ. Obesity (Silver Spring) 2006;14 (Suppl 5):242S–9S. doi: 10.1038/oby.2006.317. [DOI] [PubMed] [Google Scholar]
- 22.Weisberg SP, McCann D, Desai M, Rosenbaum M, Leibel RL, Ferrante AW., Jr Obesity is associated with macrophage accumulation in adipose tissue. J Clin Invest. 2003;112:1796–808. doi: 10.1172/JCI19246. [DOI] [PMC free article] [PubMed] [Google Scholar]
- 23.Schroder K, Zhou R, Tschopp J. The NLRP3 inflammasome: a sensor for metabolic danger? Science. 2010;327:296–300. doi: 10.1126/science.1184003. [DOI] [PubMed] [Google Scholar]
- 24.Guilherme A, Virbasius JV, Puri V, Czech MP. Adipocyte dysfunctions linking obesity to insulin resistance and type 2 diabetes. Nat Rev Mol Cell Biol. 2008;9:367–77. doi: 10.1038/nrm2391. [DOI] [PMC free article] [PubMed] [Google Scholar]
- 25.Roberts R, Hodson L, Dennis AL, et al. Markers of de novo lipogenesis in adipose tissue: associations with small adipocytes and insulin sensitivity in humans. Diabetologia. 2009;52:882–90. doi: 10.1007/s00125-009-1300-4. [DOI] [PubMed] [Google Scholar]
- 26.Varlamov O, Somwar R, Cornea A, Kievit P, Grove KL, Roberts CT., Jr Single-cell analysis of insulin-regulated fatty acid uptake in adipocytes. Am J Physiol Endocrinol Metab. 2010;299:E486–96. doi: 10.1152/ajpendo.00330.2010. [DOI] [PMC free article] [PubMed] [Google Scholar]
- 27.Grant RW, Dixit VD. Mechanisms of disease: inflammasome activation and the development of type 2 diabetes. Front Immunol. 2013;4:50. doi: 10.3389/fimmu.2013.00050. [DOI] [PMC free article] [PubMed] [Google Scholar]
- 28.Guarda G, Zenger M, Yazdi AS, et al. Differential expression of NLRP3 among hematopoietic cells. J Immunol. 2011;186:2529–34. doi: 10.4049/jimmunol.1002720. [DOI] [PubMed] [Google Scholar]
- 29.Kanda H, Tateya S, Tamori Y, et al. MCP-1 contributes to macrophage infiltration into adipose tissue, insulin resistance, and hepatic steatosis in obesity. J Clin Invest. 2006;116:1494–505. doi: 10.1172/JCI26498. [DOI] [PMC free article] [PubMed] [Google Scholar]
- 30.Ding Q, Mracek T, Gonzalez-Muniesa P, et al. Identification of macrophage inhibitory cytokine-1 in adipose tissue and its secretion as an adipokine by human adipocytes. Endocrinology. 2009;150:1688–96. doi: 10.1210/en.2008-0952. [DOI] [PubMed] [Google Scholar]
- 31.Dostalova I, Roubicek T, Bartlova M, et al. Increased serum concentrations of macrophage inhibitory cytokine-1 in patients with obesity and type 2 diabetes mellitus: the influence of very low calorie diet. Eur J Endocrinol. 2009;161:397–404. doi: 10.1530/EJE-09-0417. [DOI] [PubMed] [Google Scholar]
- 32.Karczewska-Kupczewska M, Kowalska I, Nikolajuk A, et al. Hyperinsulinemia acutely increases serum macrophage inhibitory cytokine-1 concentration in anorexia nervosa and obesity. Clin Endocrinol (Oxf) 2012;76:46–50. doi: 10.1111/j.1365-2265.2011.04139.x. [DOI] [PubMed] [Google Scholar]
- 33.Vila G, Riedl M, Anderwald C, et al. The relationship between insulin resistance and the cardiovascular biomarker growth differentiation factor-15 in obese patients. Clin Chem. 2011;57:309–16. doi: 10.1373/clinchem.2010.153726. [DOI] [PubMed] [Google Scholar]
- 34.Johnen H, Lin S, Kuffner T, et al. Tumor-induced anorexia and weight loss are mediated by the TGF-beta superfamily cytokine MIC-1. Nat Med. 2007;13:1333–40. doi: 10.1038/nm1677. [DOI] [PubMed] [Google Scholar]