

Abstract
Treatment strategies for inflammatory bowel disease have been constrained by limited therapeutic efficacy and serious adverse effects owing to a lack of receptor for targeted drug delivery to the inflamed colon. Upon inflammation, CD98 expression is highly elevated in colonic epithelial cells and infiltrating immune cells. To investigate whether CD98 can be used as a colitis-targeted delivery receptor, we constructed CD98 Fab′-bearing quantum dots (QDs)-loaded nanoparticles (Fab′-NPs). The resultant Fab′-NPs had desired particle size (~458 nm) with a narrow size distribution and zeta-potential (approximately +19 mV), low cytotoxicity, and excellent fluorescence properties. Electron microscopy images provided direct evidence for the well-dispersed distribution of QDs within spherical Fab′-NPs. Cellular uptake experiments demonstrated that Fab′-NPs were efficiently internalized into Colon-26 and RAW 264.7 cells through the CD98-mediated endocytosis pathway, and showed that the targeting effect of CD98 Fab′ markedly increased their cellular uptake efficiency compared with control pegylated QDs-loaded NPs (PEG-NPs). Furthermore, ex vivo studies showed much more effective accumulation of Fab′-NPs in colitis tissue than that of PEG-NPs. These findings suggest that because of inflammation-dependent over-expression of CD98, active colitis-targeted delivery can be accomplished using NPs decorated with CD98 antibody.
1. Introduction
Inflammatory bowel disease (IBD), mainly comprising Crohn’s disease and ulcerative colitis, is a chronic relapsing inflammation of the gastrointestinal tract (GIT).1 It is estimated that about 1.4 million Americans and 2.2 million Europeans suffer from IBD.2 Moreover, the prevalence continues to rise in low-incidence areas, including southern Europe, Asia, and most developing countries.3 The major aim of IBD treatment is to maintain remission, achieve mucosal healing, and reduce surgeries and hospitalizations.4 To date, some conventional treatments have been successful in controlling inflammation in the GIT. However, serious side effects have also been reported due to the systemic, non-targeted delivery of the drugs.5, 6
Oral administration is considered the most convenient drug delivery route, and is likely to be a major advantage for GIT disease therapies.3, 7 Colitis-targeted delivery for orally administered nanoparticles (NPs) can be achieved through passive or active targeting. It has been reported that NPs are likely to passively reach colitis tissue through an epithelial enhanced permeation and retention (eEPR) effect.8, 9 This effect is based on the histopathological abnormalities of colitis tissue, such as enterocyte disruption-induced loss of barrier function, increased epithelial permeability, and significant infiltration of inflammatory cells into the mucosa.10, 11 Thus, NPs potentially accumulate in gaps between cells, increasing the local drug concentration and exerting therapeutic effects against IBD. Effective strategies for active targeting via molecular mechanisms, which should further reduce adverse reactions and improve selective drug accumulation at inflamed sites, are eagerly awaited.9 Interactions between targeting ligands and specific receptors expressed only at inflamed sites would be expected to improve bioadhesion of NPs to specific cells and further increase the extent of endocytosis via receptor-mediated cell internalization. However, to the best of our knowledge, very few receptors have been proposed for colitis-targeted delivery of NPs.
CD98 is a 125 kDa type II membrane glycoprotein heterodimer composed of a 40 kDa non-glycosylated light chain and an 85 kDa glycosylated heavy chain.12 We and others have demonstrated that CD98 is expressed on the basolateral membranes of colonic epithelial cells under healthy conditions.13–15 In contrast, during intestinal inflammation, CD98 is aberrantly over-expressed in the apical plasma membrane of epithelial cells toward the luminal side owing to a loss of intestinal epithelial barrier and polarity functions. 16, 17 Additionally, it has been reported that CD98 expression is highly up-regulated in colonic tissues from mice with active colitis; 18 colonic biopsies from patients with Crohn’s disease;13 and at the surface of intestinal B cells, CD4+ T cells and CD8+ T cells isolated from IBD patients.19 Further study has shown that CD98 is highly expressed in intestinal macrophages and plays an important role in macrophage activation.20 Thus, it is reasonable to speculate that CD98 could be used as a targeting molecule for colitis-targeted delivery of NPs.
Quantum dots (QDs) are spherical semiconductor crystals with a diameter of 2–10 nm.21 They are the most promising candidates for vein, deep tissue and organ imaging owing to their unique chemical and optical properties, such as tunable emission from visible to infrared wavelengths, broader excitation spectra, narrow band gap, photo stability, and long excitation.22–24 However, the potential application of QDs in bioimaging is limited by their hydrophobic and toxic properties. 22, 23, 25 An appropriate surface modification and polymeric encapsulation of QDs could make them water-soluble and minimize their toxicity. Polyesters, such as poly(lactic acid) (PLA), are the most widely used polymers for delivery of hydrophobic agents because of their great solubility in organic solvents, biodegradability, and biocompatibility.26, 27 Polyester NPs can efficiently encapsulate QDs and facilitate cellular uptake, resulting in excellent imaging effects.28 Therefore, by combining the merits of QDs and polyester NPs, QDs-loaded polyester NPs may offer a promising imaging platform for investigating the targeting properties of NPs.
To demonstrate that CD98 is a potential targeting receptor for colitis-targeted delivery of NPs, we fabricated and applied CD98 Fab′-bearing QDs-loaded NPs (Fab′-NPs). We also evaluated the physicochemical properties (e.g., hydrodynamic particle size, zeta-potential, emission and absorption properties) of these Fab′-NPs in relation to their targeting capacity. Finally, we investigated their ability to target colitis tissue.
2. Experimental section
2.1 Materials
PLA (Mw = 75–120 kg/mol), branched polyethylenimine (bPEI, 25 kDa), dichloromethane (DCM), trehalose and Triton X-100 were purchased from Sigma-Aldrich (St. Louis, USA). Poly(vinyl alcohol) (PVA, 86–89% hydrolyzed, low molecular weight) was obtained from Alfa Aesar (Ward Hill, USA). N-hydroxysuccinimide-polyethylene glycol-maleimide (MAL-PEG-NHS, MW 2000) was supplied from Jenkem Technology Company (Beijing, China). Purified anti-mouse CD98 antibody for NPs conjugation was from Biolegend (San Diego, USA). F(ab′)2 Preparation Kits, 2-Mercaptoethanol (2-MEA) and Zeba Desalting Columns were purchased from Pierce Thermo Scientific (Rockford, USA). DC Protein Assay Kits was obtained from Bio-Rad Laboratories (Hercule, USA). Paraformaldehyde stock solution (16%) was from Electron Microscopy Science (Hatfield, USA). Vybrant® MTT cell proliferation assay kit, 4′,6-diamidino-2-phenyl-indole dihydrochloride (DAPI), Oligofectamine™ and Opti-MEMI reduced serum culture medium were supplied from Invitrogen (Eugene, USA). Mouse CD98 antibody for western blot and CD98 small interfering RNA (siRNA) were purchased from Santa Cruz Biotechnology (Santa Cruz, USA). Dextran sulfate sodium (DSS, 36–50 kDa) was obtained from MP Biomedicals (OH, USA). 10% buffered formalin was supplied from EMD Millipore (Billerica, USA). Hematoxylin and eosin were from Richard-Allan Scientific (Kalamazoo, USA).
2.2 Fabrication of CD98 Fab′-bearing QDs-loaded NPs (Fab′-NPs)
2.2.1 Preparation of CD98 Fab′ with free –SH group
CD98 antibody was enzymatically digested with pepsin (a nonspecific endopeptidase) to generate F(ab′)2 fragment using a F(ab′)2 Preparation Kits following the manufacturer’s instructions. This fragment is composed of a pair of Fab′ units connected by two disulfide bonds. To obtain Fab′ with free –SH group, F(ab′)2 was mild reduced using 2-MEA. The generated Fab′-SH was further purified using Zeba Desalting Columns. The free Fab′-SH fragments were prepared immediately prior to the conjugation experiment.
2.2.2 Fabrication of QDs-loaded NPs
QDs were synthesized according to the previous reports.29, 30 Blank and QDs-loaded NPs were prepared by a modified oil-in-water (O/W) emulsion-solvent evaporation technique.31 Briefly, 25 mg of PLA and, optionally, 1.25 mg of QDs were co-dissolved in 1 mL of DCM. The resulting organic solution was added drop-wise to 4 mL PVA/bPEI mixed solutions with different weight ratios while vortexing. The mixture was subsequently sonicated three times (10 s each time) at 70% amplitude in an ice bath using a Sonifier 450 (Branson Sonic Power, Danbury, CT). This emulsion was immediately poured into 100 mL of aqueous solution containing 0.3% PVA. The organic solvent was evaporated under stirring and low vacuum conditions (Rotary evaporator, Yamato RE200). The NPs were collected by centrifugation at 9,000 g for 20 min, washed three times with deionized water, re-suspended in 2 mL of aqueous solution containing trehalose (5%), and dried in a lyophilizer. The dried NPs were stored at −20 °C in airtight container.
2.2.3 Conjugation of CD98 Fab′ to the surface of NPs
10 mg of QDs-loaded NPs was re-suspended in phosphate-buffer solution (PBS, pH = 7.2). The NPs conjugated with PEG through specific reaction between the primary amino groups of bPEI (25 kDa) on the surface of NPs and the NHS groups of bi-functional PEG derivative (MAL-PEG-NHS, 2 mg) for 3 h while stirring. The resulting MAL-PEG-NPs were washed three times with deionized water. Then the terminal MAL groups of NPs were specifically reacted with the free –SH groups of CD98 Fab′. Unreacted maleimide groups were quenched with 5 eq. cysteine. NHS-PEG-OH was used to synthesize pegylated QDs-loaded NPs (PEG-NPs), as a control to CD98 Fab′-bearing DQs-loaded NPs (Fab′-NPs).
2.3 Physicochemical characterization of NPs
2.3.1 Quantification of surface Fab′ density
The density of Fab′ on the NPs surface was determined using the DC Protein Assay Kits according to the manufacturer’s instructions. PEG-NPs were used as blank in the test.
2.3.2 Particles size and zeta-potential
Hydrodynamic particle size (nm), polydispersity index (PDI) and zeta-potential (mV) of NPs were measured by photon correlation spectroscopy (PCS) employing Brookhaven equipment (Model 90Plus Nanoparticle Size Analyzer; Brookhaven Instruments Corporation, Holtsville, USA) in 0.15 M NaCl at 25 °C. The average particle size and zeta-potential were calculated using 3 runs. Each run is an average of 10 measurements.
2.3.3 Morphology
The shape of NPs and the encapsulation of QDs were verified by transmission electron microscope (TEM, LEO 906E, Carl Zerss, Germany). For the preparation of TEM samples, a drop of diluted NPs was deposited onto the surface of Formvar-coated copper grids. The NPs were left to dry at room temperature. For scanning electron microscopy (SEM) test, a drop of suspension of NPs was mounted on a freshly cleaned glass slide using carbon adhesive tape and sputter-coated with a mixture of gold and palladium (60:40) in an argon atmosphere under low pressure. The image was measured by SEM (LEO 1450VP, Carl Zerss, Germany). For fluorescence microscopy, a drop of suspension of NPs was mounted on a freshly cleaned glass slide and dried at room temperature. Images were acquired using the FITC channel on an Olympus fluorescence microscopy equipped with a Hamamatsu Digital Camera ORCA-03G.
2.3.4 Absorption and emission spectra
UV-vis absorption spectrum was obtained on a Shimadzu UV-1700 UV/Vis spectrophotometer. Fluorescence spectra were recorded on a Shimadzu RF-5301 PC spectrofluorometer at excitation 365 nm, and quartz cuvettes were used in all UV and fluorescent studies.
2.4 Evaluation of cytotoxicity
For 3-(4,5-Dimethylthiazol-2-yl)-2,5-Diphenyl Tetrazolium Bromide assay (MTT), Colon-26 cells and RAW 264.7 macrophages were seeded at a respective density of 3×10⁴ and 1×10⁴ cells/well in 96-well plates and incubated overnight. After 24 h of exposure to NPs suspensions, cells were then incubated with MTT (0.5 mg/mL in supplemented 100 μL of serum-free DMEM) at 37 °C for 4 h. Thereafter, the media were discarded and 50 μL dimethyl sulfoxide (DMSO) was added to each well prior to spectrophotometric measurements at 490 nm. Untreated cells were used as negative references, whereas cells were treated with 0.1% Triton X-100 as positive controls.
2.5 Intracellular NPs uptake visualization
Colon-26 cells and RAW 264.7 macrophages were seeded in eight-chamber tissue culture glass slide (BD Falcon, Bedford, USA) at a respective density of 5×10⁴ and 2×10⁴ cells/well and incubated overnight. After 6 h of exposure to NPs suspensions with different concentration (0, 1, 10 and 25 μg/mL) or free QDs suspension (1.25 μg/mL), the cells were thoroughly rinsed with cold PBS to eliminate excess of NPs or free QDs, and then fixed in 4% paraformaldehyde for 20 min. To observe cellular uptake of NPs, DAPI was diluted 10,000 times and added to the wells for staining cells for 5 min. Images were acquired using the FITC channel on an Olympus fluorescence microscopy equipped with a Hamamatsu Digital Camera ORCA-03G. Serial optical sections were acquired from the top to the bottom in defined thinkness of 11 μm using a LSM 510 confocal laser scanning microscope (CLSM, Zeiss, Oberkochen, Germany).
2.6 Quantification of cellular uptake using flow cytometry (FCM)
Colon-26 cells and RAW 264.7 macrophages were seeded in 12-well plates at a respective density of 4×10⁵ and 1×10⁵ cells/well and incubated overnight. The medium was exchanged to serum-free medium containing PEG-NPs or Fab′-NPs with the concentration of 25 μg/mL. Cells treated with blank NPs (25 μg/mL) were used as negative controls. After incubation for different time periods (1, 3 and 6 h), the cells were thoroughly rinsed with cold PBS to eliminate excess of NPs, which were not taken up by cells. Subsequently, the treated cells were harvested using accutase or trypsin, transferred to centrifuge tubes, and centrifuged at 1500 rpm for 5 min. Upon removal of the supernatant, the cells were re-suspended in 0.5 mL of FCM buffer, transferred to round-bottom polystyrene test tubes (BD Falcon, 12 × 75 mm), and kept at 4 °C until analysis. Analytical FCM was performed using the FITC channel on the FCM Canto™ (BD Biosciences). A total of 10,000 ungated cells were analyzed.
To further confirm the cellular targeting capacity of Fab′-NPs, Colon-26 cells and RAW 264.7 macrophages were transfected with CD98 siRNA using Oligofectamine and Opti-MEMI medium according to the manufacturer’s instructions. Opti-MEMI medium with 30% FBS was added to each well after 4 h of co-incubation, and cells were further incubated at 37°C with 5% CO2 for 2 days. After 6 h of exposure to NPs suspensions, the cellular uptakes of NPs by Colon-26 cells and RAW 264.7 macrophages with low CD98 expression levels were further investigated using FCM.
2.7 Ex vivo experiments
2.7.1 Experimental animals
FVB male mice (8 weeks of age, The Jackson Laboratory) were used in the animal experiments. Mice were group housed (25 °C), photoperiod (12:12-h light-dark cycle), and allowed unrestricted access to potables and standard mouse chow. All the animal experiments were approved by Georgia State University Institutional Animal Care and Use Committee.
2.7.2 DSS-induced colitis
Colitis was induced by replacing their drinking water with a 3% (wt/vol) DSS solution. For each of the animal experiments, groups of mice were treated with normal water or DSS. Mice were observed daily and evaluated for changes in body weight and development of clinical symptoms of colitis. After 8 days of DSS treatment, mice were sacrificed and colon was removed for further study.
2.7.3 RNA extraction and quantitative reverse-transcription PCR (qRT-PCR)
Total RNA was extracted from the tissue samples using RNeasy Plus Mini Kit (Qiagen, Valencia, USA) according to the manufacturer’s instructions. Yield and quality of RNA were verified with a Synergy 2 plate reader (BioTek, Winooski, USA). cDNA was generated from the total RNAs isolated above using the Maxima first strand cDNA synthesis kit (Fermentas, Glen Burnie, USA) according to the manufacturer’s instructions. Expression of the total RNA was quantified by qRT-PCR using Maxima SYBR green/Rox (6-carboxyl-X-rhodamine) quantitative PCR Master Mix (Fermentas, Glen Burnie, USA). 36B4 was used as a housekeeping gene in qRT-PCR. Fold induction was calculated using the threshold cycle (CT) method as follows: . The final data were derived from 2−ΔΔCT method. Sequences of all the primers used in qRT-PCR are given in Electronic Supplementary Information (ESI; Table S1).
2.7.4 Protein extraction and Western blot analysis
Approximately 5–10 mm pieces of tissue samples were homogenized in radioimmunoprecipitation assay buffer (150 mM NaCl, 0.5% sodium deoxycholate, 50 mM Tris-HCl, pH 8, 0.1% SDS, 0.1% Nonidet P-40) supplemented with protease inhibitors (Roche Diagnostics, Indianapolis, USA) on ice. The homogenates were centrifuged at 12,000 rpm for 10 min at 4°C. Total cell lysates (50 μg/lane) were resolved on 4–15% gradient polyacrylamide gels (Bio-Rad, Hercules, CA) and transferred to nitrocellulose membranes (Bio-Rad Laboratories, Hercule, USA). Membranes were then probed with primary antibodies: CD98 and GAPDH. After washes, membranes were incubated with appropriate horseradish peroxidase-conjugated secondary antibodies (GE Healthcare, Piscataway, USA), and blots were detected using the enhanced chemiluminescence detection kit (GE Healthcare, Piscataway, USA).
2.7.5 H&E staining
Colonic tissue were fixed in 10% buffered formalin and embedded in paraffin. Tissue sections with a thickness of 5 μm were stained with heomatoxylin and eosin (H&E). Images were taken using an Olympus microscope and D-26 color camera.
2.7.6 NPs uptake visualization
Colon tissues (6–8 mm) from healthy control and DSS-treated mice were placed in 24-well culture plates with the mucosal surface facing upwards. The wells were flooded in serum-free RPMI-1640 medium supplemented with penicillin and streptomycin, and then PEG-NPs or Fab′-NPs suspensions (100 μg/mL) were added to each well. After 6 h of co-incubation, tissues were washed thoroughly with PBS for 3 times, and then embedded in OCT. Sections (5 μm) were fixed in 4% paraformaldehyde and further stained with DAPI. Images were acquired using an Olympus equipped with a Hamamatsu Digital Camera ORCA-03G.
2.8 Statistical analysis
Statistical analysis was performed using Student’s t-test. Data were expressed as mean ± standard error of mean (S.E.M.). Statistical significance was represented by *P<0.05 and **P<0.01.
3. Results and discussion
3.1 Fabrication of Fab′-NPs
The emulsion-solvent evaporation technique is a very common and well-established method for fabricating active substance-loaded NPs.32 In the present report, we prepared QDs-loaded NPs using this method. Theoretically, once the organic phase, consisting of QDs and PLA, is added rapidly to the aqueous phase along with stabilizers, such as PVA and/or bPEI, an oil/water emulsion is formed immediately on the basis of the Gibbs-Marangoni effect (mechanical mechanism) and a capillary break-up mechanism.33 With the evaporation of DCM under reduced pressure, QDs are transferred to the PLA hydrophobic core through hydrophobic interactions (i.e., the “like dissolves like” principle) and further solidified to form compacted NPs.34 Before loading QDs within PLA NPs, we optimized the concentrations of PVA and bPEI to obtain stable NPs with a small particle size and proper zeta-potential. As shown in the ESI (Table S2), NPs had an optimum size and zeta-potential in the presence of 3% PVA and 0.5% bPEI. Therefore, this combination of PVA and bPEI was selected for QD loading. bPEI is an amine groups-contained polymer that not only acts as an efficient stabilizer,35 but also enables functional surface modification of polyester NPs. The further conjugation of MAL-PEG-NHS to bPEI on the surface of NPs improves biocompatibility and mucus penetration,36 and also supplies active chemical groups (maleimide groups) for antibody grafting. Before grafting CD98 antibodies, we removed Fc regions to obtain CD98 Fab′ fragments. This was done because Fc regions induce complement activation and undesirable interaction with non-specific cells. Additionally, CD98 Fab′ fragments containing the antigen-binding regions are smaller in size, a benefit for actively targeted delivery of NPs. Finally, NPs were decorated with CD98 Fab′, yielding the resultant Fab′-NPs that were used for subsequent studies. The process of QDs-loaded NP fabrication, MAL-PEG-NHS conjugation, and Fab′-SH grafting is shown in Scheme 1. The CD98 Fab′ content on Fab′-NPs was assessed using a DC Protein Assay. Total protein content was approximately 67.0 ± 2.3 μg of Fab′ per milligram of Fab′-NPs.
Scheme 1.
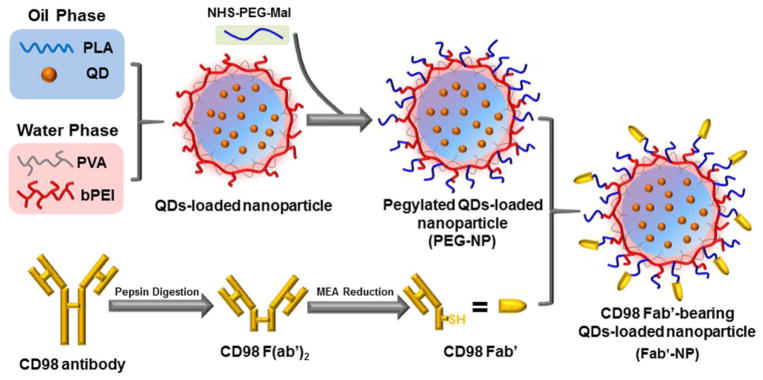
Schematic illustration of the fabrication of Fab′-NPs. First, CD98 antibodies were digested and reduced to generate Fab′-SH. Next, NPs were coated with a hetero-bifunctional cross-linker (MAL-PEG-NHS), yielding maleimide-functionalized PEG-NPs (MAL-PEG-NPs). Finally, MAL-PEG-NPs were reacted with Fab′-SH to obtain the final NPs (Fab′-NPs).
3.2 Physicochemical characterization of NPs
Particle size and zeta-potential are critical parameters for NPs as they directly impact the stability, cellular uptake, biodistribution, and muco-adhesive properties of NPs.33 As shown in Fig. 1a, the average hydrodynamic diameter of QDs-loaded NPs was about 289 nm, which was not significantly different from that of blank NPs (Supplementary Table 2). We also observed that blank NPs had a positive zeta-potential (~36 mV), indicative of the presence of bPEI on the surface (Fig. 1b). Consistent with a previous report,22 the zeta-potential value of QDs-loaded NPs markedly increased after incorporation of QDs. Importantly, we further found that the particle size of PEG-NPs and Fab′-NPs tended to increase, whereas their zeta-potentials exhibited a decreasing trend, providing evidence that the PEG and Fab′ groups were indeed surface-bound. In addition, it is also evident that the Fab′-NPs were quite uniform in size and zeta-potential (Fig. 1c and Fig. 1d). It has been proposed that most cells can efficiently internalize slightly positively charged particles with a size less than several hundred nanometers.37, 38 Accordingly, the properties of the NPs described above would be considered favorable for internalization into cells.
Fig. 1.

Particle size (a) and zeta potential (b) of naked QD-loaded NPs, PEG-NPs, and Fab′-NPs. Each point represents the mean ± S.E.M. (n=3). Representative size distribution (c) and zeta potential distribution profiles (d) of Fab′-NPs.
Fig. 2a shows a representative TEM image of QDs, which were largely spherical with an average diameter of 3 nm. Since the electron density of QDs is greater than that of the organic components of NPs, QDs can be seen as black dots in Fig. 2b. We further demonstrated that numerous QDs were encapsulated in the hydrophobic regions of NPs. SEM images (Fig. 2c and Fig. 2d) revealed that PEG-NPs and Fab′-NPs were spherical in shape and had a narrow size distribution. As measured by PCS, the corresponding hydrodynamic diameter of PEG-NPs and Fab′-NPs in water were 370 and 458 nm, respectively, which was somewhat larger than the size determined by SEM (~309 and 357 nm). This modest deviation in diameter measured by PCS and SEM was attributable to differences in the surface states of the samples under the test conditions used. Specifically, NPs were in a fully hydrated (swollen) state when tested by PCS, whereas NPs must be strictly dehydrated for SEM characterization.
Fig. 2.

Typical TEM images of QDs (a) and Fab′-NPs (b). Representative SEM images of PEG-NPs (c) and Fab′-NPs (d).
Since QDs were encapsulated in the NPs, it was expected that the optical properties of QDs would be retained in NPs. Fig. 3a shows representative images of PEG-NPs and Fab′-NPs obtained using fluorescence microscopy. The NPs appeared as bright green spheres, and showed good monodispersity and high photoluminescence (PL). The fluorescence images suggested no obvious differences between these two NPs. Generally, QD fluorescence can enlarge the size of individual NPs owing to the point spread function,39 so the sizes of the observed fluorescence dots were much larger than the hydrodynamic size described above. UV-Vis absorption and PL spectra of NPs are summarized in Fig. 3b. The UV absorption spectrum of NPs exhibited a distinct excitonic peak at 540 nm, suggesting that the QDs had a narrow size distribution. Fig. 3b also indicated that the emission properties of QDs were well preserved following their encapsulation in NPs, exhibiting an emission spectrum of 513 to 620 nm, with an emission peak at 561 nm. The fluorescence intensities of NPs also showed concentration-dependent behavior. Collectively, these results indicate that Fab′-NPs successfully encapsulated QDs and exhibit great potential for use in tracking cellular and tissue distribution.
Fig. 3.
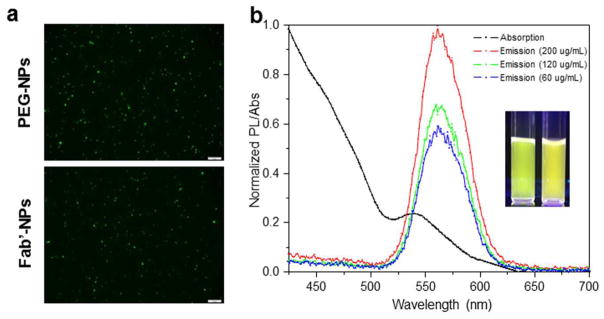
Representative fluorescence images (a) of PEG-NPs and Fab′-NPs, detected using the FITC channel. Scale bar represents 10 μm. UV-Vis absorption and normalized photoluminescence spectra (b) of Fab′-NPs. The insert shows photographs of QDs dissolved in DCM (left) and an aqueous Fab′-NPs suspension (right) excited at 365 nm.
3.3 Cytotoxicity of PEG-NPs and Fab′-NPs
Cytotoxicity is a primary concern in the development of imaging reagent containing QDs. To assess the cytotoxicity of our NPs, we treated Colon-26 and RAW 264.7 cells with different concentrations of NPs for 24 h and examined cell viability using MTT assays. It has been reported that the toxicity of QDs not only depends on the ingestion of particles by a cell but also reflects the release of cadmium from the QDs.22, 40 To circumvent these difficulties, we used biocompatible polyester to encapsulate QDs and shield them from the cellular environment. As shown in Fig. 4, PEG-NPs exhibited dose-dependent cytotoxicity. At NP concentrations below 100 μg/mL, more than 80% of Colon-26 cells were viable. Similar cytotoxicity results were obtained for RAW 264.7 cells, which exhibited 75% viability at NP concentrations below 25 μg/mL. The cytotoxicities of Fab′-NPs against both cell lines were remarkably increased compared with PEG-NPs, possibly due to their enhanced cellular uptake.
Fig. 4.
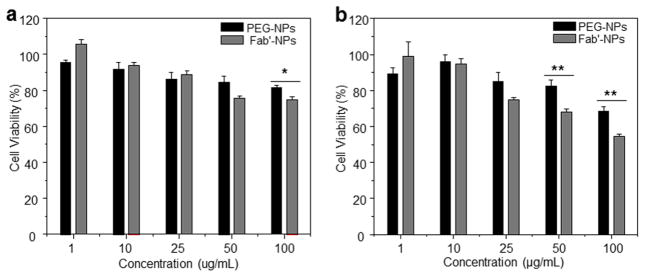
Cytotoxicity assays of PEG-NPs and Fab′-NPs at different concentrations in Colon-26 (a) and RAW 264.7 (b) cell lines. Triton X-100 was used as the positive control to produce a maximum cell death rate (100%). Cell culture medium was used as a negative control (death rate defined as 0%). Toxicity is given as the percentage of viable cells remaining after treatment for 24 h. Each point represents the mean ± S.E.M. (n=5). Statistical significance was assessed using Student’s t-test (*P<0.05 and **P<0.01).
3.4 Imaging of Fab′-NP cellular uptake in vitro
Whether Fab′-NPs can be internalized by specific cells is a vital concern for colitis targeting and imaging, since higher cellular uptake efficiency of NPs by targeted cells should result in better molecular imaging outcomes.22 To investigate the cellular uptake behavior of Fab′-NPs, we used fluorescence microscopy to monitor the concentration-dependent accumulation of NPs in cells. Colon-26 and RAW 264.7 cells, representing two important resident cell types in colitis tissue, were selected as model cells for in vitro tests, with the expectation that these cells would be reliable predictors of ex vivo or in vivo uptake of Fab′-NPs.
Fig. 5a shows fluorescence images of control cells and the same cells treated with different concentrations (1, 10, and 25 μg/mL) of Fab′-NPs for 6 h. As can be clearly seen from these images, the cellular NP-uptake profile in both cell lines was concentration-dependent, with fluorescence intensity increasing with increased NPs concentration. Moreover, control cells and cells incubated with free QDs (Supplementary Fig. S1) were negative for green fluorescence. In contrast, cells incubated with Fab′-NPs showed strong green fluorescence due to the fluorescence emitted by QDs-loaded NPs distributed in the cells. An examination of individual cell images revealed very weak intracellular fluorescence at a concentration of 1 μg/mL, indicating that very few NPs were internalized into the cells at this low concentration. However, cells incubated with Fab′-NPs at concentrations of 10 or 25 μg/mL exhibited bright and stable green fluorescence, indicating that a relatively large amount of NPs had been internalized into the cells. We also found from individual cell images that the Fab′-NPs were internalized into the cell cytoplasm rather than the nucleus. This likely reflects the fact that the size of nuclear pore complexes is typically between 20 and 50 nm,41 and therefore becomes limiting for NPs with a diameter greater than 300 nm. Notably, RAW 264.7 cells exhibited stronger green fluorescence than Colon-26 cells under the same conditions, indicating a greater proclivity of RAW 264.7 cells to internalize Fab′-NPs. As shown in Fig. 5b, further CLSM analyses demonstrated that Fab′-NPs had indeed internalized into the cells rather than being adhered to the cell surface.
Fig. 5.

(a) Images of cellular uptake of different concentrations of Fab′-NPs by Colon-26 and RAW 264.7 cells. Cells were treated with NPs for 6 h and processed for fluorescence staining. Fixed cells were stained with DAPI (purple) for visualization of nuclei. Scale bar represents 10 μm. (b) Serial optical sections acquired from the top to the bottom of the samples at a defined thickness of 11 μm. Colon-26 and RAW 264.7 cells were incubated with Fab-NPs (25 μg/mL) for 6 h, fixed with 4% paraformaldehyde solution, and then stained with DAPI (purple) for visualization of nuclei.
3.5 Quantification of cellular uptake using FCM
To demonstrate the biological activity of CD98 Fab′, we further quantitatively compared the cellular uptake profiles of PEG-NPs and Fab′-NPs using FCM. As shown in Fig. 6a and 6b, which present the respective fluorescence emission intensities of Colon-26 and RAW 264.7 cells incubated for 1, 3 and 6 h in the same concentrations of PEG-NPs and Fab′-NPs suspensions, both cell lines exhibited a time-dependent accumulation of PEG-NPs and Fab′-NPs. Notably, Colon-26 cells co-incubated with Fab′-NPs exhibited much stronger fluorescence intensity at each time point (1.9-, 3.6- and 2.4-fold for 1, 3 and 6 h, respectively) than cells incubated with PEG-NPs (Fig. 6c). This indicated that QDs were much more efficiently transferred into cells using Fab′-NPs than PEG-NPs, and suggested that CD98 Fab′ endowed NPs with higher cellular uptake efficiency through active targeting. In addition, no significant cellular uptake differences for Fab′-NPs were observed between 3 and 6 h, indicating that Fab′-NPs were more rapidly internalized by cells than PEG-NPs. A similar trend in the NP-uptake profile was seen for RAW 264.7 cells, except that there was a significant difference in uptake efficiency between 3 and 6 h in these cells (Fig. 6d).
Fig. 6.

Quantification of cellular uptake efficiency of PEG-NPs and Fab′-NPs. Representative flow cytometric histogram profiles of fluorescence intensity for Colon-26 (a) and RAW 264.7 (b) cells treated with NPs (25 μg/mL) for different times (1, 3, and 6 h). Percentage of PEG-NP- or Fab′-NP-containing Colon-26 (c) and RAW 264.7 (d) cells after treatment with NPs (25 μg/mL) for different times (1, 3, and 6 h). Blank NPs were used as a negative control. Each point represents the mean ± S.E.M. (n=3). Statistical significance was assessed using Student’s t-test (*P<0.05 and **P<0.01).
To further verify that Fab′-NPs were internalized by cells via a CD98-mediated endocytosis pathway, we used CD98-knockdown Colon-26 and RAW 264.7 cells as negative controls. As shown in Fig. 7a–b, the Fab′-NP uptake efficiency was clearly decreased in these cells. These results were quantified in Fig. 7c–d, which showed that Fab′-NP uptake was reduced by ~87.4% and ~65.0% in Colon-26 and RAW 264.7 cells, respectively, upon knockdown of CD98. These results indicated that CD98 expression was important in the cellular uptake of Fab′-NPs, confirming the targeting role of CD98 Fab′ on the surface of NPs. Compared with the cellular uptake efficiency of PEG-NPs (Fig. 6), the greater reduction in uptake efficiency of Fab′-NPs in CD98-knockdown cells indicated that CD98 also played a key role in cellular activity, thus further decreasing cellular uptake efficiency. Taken together, these results indicate that Fab′-NPs hold great promise in targeting and cellular imaging applications.
Fig. 7.

Quantification of cellular uptake efficiency of Fab′-NPs by CD98-knockdown cells. Flow cytometry histogram overlays show the cellular uptake of Fab′-NPs by CD98-knockdown Colon-26 cells (a) and RAW 267.4 macrophages (b). Analysis of the percentage of Fab′-NP-containing CD98-knockdown Colon-26 (c) and RAW 267.4 macrophages (d). Fab′-NPs were used at a concentration of 25 μg/mL. Each point represents the mean ± S.E.M. (n=3). Statistical significance was assessed using Student’s t-test (*P<0.05 and **P<0.01).
3.6 Targeting properties ex vivo
Since our Fab′-NPs showed a considerable ability to target colitis-related cells in vitro, we next investigated their targeting properties in ex vivo using the DSS-induced colitis mouse model. This model has been widely utilized to address the pathogenesis of IBD and determine the therapeutic efficacy of NP-based therapeutic formulations.
Preliminary experiments showed that DSS-treated mice exhibited weight loss (~9.2%) and rectal bleeding (data not shown) after 8 days of DSS treatment (Fig. 8a). Quantification of CD98 mRNA and protein level by qRT-PCR and Western blotting, respectively, after 8 days of DSS treatment showed a significant increase in the expression of CD98 mRNA (~2.9-fold) (Fig. 8b) and CD98 protein (Fig. 8c) compared to control mice. H&E-stained colon sections from animals in the healthy control group exhibited normal colon histology with no sign of inflammation or disruption of healthy tissue morphology, whereas tissues from DSS-treated mice exhibited clear signs of inflammation, including goblet cell depletion and a high level of infiltration of inflammatory cells into the mucosa (Fig. 8d). Next, tissues from healthy control and DSS-treated mice were treated with PBS (negative control), PEG-NPs or Fab′-NPs and examined for QD fluorescence. As shown in Fig. 8e, tissue sections instilled with PBS showed no fluorescence signal. We further found that very few NPs were retained in healthy tissue after 6 h of co-incubation, for either PEG-NPs or Fab′-NPs, indicating that it was difficult for NPs to penetrate the integrated structure of healthy colon tissue. However, co-incubation of NPs with colitis tissues revealed that large amounts of NPs efficiently penetrated into colitis tissue via the eEPR effect and accumulated therein. Furthermore, Fab′-NPs showed a substantially greater and wider distribution than their non-functionalized counterpart (PEG-NPs). These results suggest that CD98 Fab′-NPs could facilitate permeation and enrichment of NPs in colitis tissue.
Fig. 8.

Ex vivo tissue uptake profiles of PEG-NPs and Fab′-NPs. (a) Changes in body weight over time in mice treated with 3% DSS in drinking water. Mouse body weight was normalized to day 0 body weight (expressed as a percentage) and is depicted as the mean of each treatment group ± S.E.M. (n=5). (b) CD98 mRNA levels in healthy control mice and DSS-treated mice. Each point represents the mean ± S.E.M. (n=5). Statistical significance was assessed using Student’s t-test (*P<0.05 and **P<0.01). (c) Western blotting of total colonic lysates from healthy control mice and DSS-treated mice. Total colonic protein (50 μg/lane) was resolved by SDS-PAGE on 4–15% gradient gels under reducing conditions followed by transfer to a nitrocellulose membrane. The blot was immunostained with an anti-CD98 antibody. As a loading control, the same blot was stripped and reprobed with an antibody against GAPDH. (d) H&E-stained colon sections from healthy control and DSS-treated mice sacrificed on day 8. Scale bar represents 50 μm. (e) Tissue uptake profiles of PEG-NPs and Fab′-NPs after co-incubating for 6 h with healthy control tissue or colitis tissue. Tissues were treated with NPs (100 μg/mL) and processed for fluorescence staining. Fixed cells were stained with DAPI for visualization of nuclei (purple). Scale bar represents 50 μm.
4. Conclusions
In the present study, we demonstrated the successful construction of CD98 Fab′-bearing quantum dots (QDs)-loaded nanoparticles (Fab′-NPs) and investigated the potential of CD98 for the colitis-targeted NPs delivery. The spherical Fab′-NPs had a desirable particle size (~450 nm), zeta-potential (approximately +19 mV) and low cytotoxicity, as well as excellent optical properties. Importantly, in vitro fluorescence microscopic and flow cytometric analyses suggested that Fab′-NPs were internalized into cells via CD98-mediated endocytosis and showed significantly higher cellular uptake efficiency than their counterpart, pegylated QDs-loaded NPs (PEG-NPs). Further ex vivo experiments indicated that Fab′-NPs showed much a better accumulation profile than PEG-NPs. Collectively, these results demonstrate the potential of CD98 as a colitis-targeted NP delivery receptor. In future, we envision expanding the utility of these NPs, particularly by incorporating therapeutic components into the NPs, improving therapeutic efficacy, and reducing adverse effects in IBD therapy.
Supplementary Material
Acknowledgments
This work was supported by grants from the Department of Veterans Affairs (Merit Award to D.M.), the National Institutes of Health of Diabetes and Digestive and Kidney by the grants RO1-DK-071594 (to D.M.) and K01-DK097192 (to H.L.), and the American Heart Association Postdoctoral Fellowship Grant 13POST16400004 (to B.X.). Dr. Merlin is a recipient of a Career Scientist Award from the Department of Veterans Affairs.
Footnotes
Electronic supplementary information (ESI) available: Primers used in qRT-PCR; particle size, polydistribution index (PDI) and zeta-potential of nanoparticles using different concentration and ratio of stabilizers (PVA and bPEI); cellular uptake profile of free QDs. See DOI: 10.1039/b000000x/
References
- 1.Xiao B, Laroui H, Ayyadurai S, Viennois E, Charania MA, Zhang Y, Merlin D. Biomaterials. 2013;34:7471. doi: 10.1016/j.biomaterials.2013.06.008. [DOI] [PMC free article] [PubMed] [Google Scholar]
- 2.Loftus EV., Jr Gastroenterology. 2004;126:1504. doi: 10.1053/j.gastro.2004.01.063. [DOI] [PubMed] [Google Scholar]
- 3.Xiao B, Merlin D. Expert opin drug deliv. 2012;9:1393. doi: 10.1517/17425247.2012.730517. [DOI] [PubMed] [Google Scholar]
- 4.Pineton de Chambrun G, Peyrin-Biroulet L, Lemann M, Colombel JF. Nat Rev Gastroenterol Hepatol. 2010;7:15. doi: 10.1038/nrgastro.2009.203. [DOI] [PubMed] [Google Scholar]
- 5.Sandborn WJ. Best Pract Res Clin Gastroenterol. 2003;17:105. doi: 10.1053/bega.2002.0345. [DOI] [PubMed] [Google Scholar]
- 6.Papa A, Mocci G, Bonizzi M, Felice C, Andrisani G, Papa G, Gasbarrini A. Expert Rev Clin Pharmacol. 2009;2:391. doi: 10.1586/ecp.09.12. [DOI] [PubMed] [Google Scholar]
- 7.Kriegel C, Attarwala H, Amiji M. Adv Drug Deliv Rew. 2013;65:891. doi: 10.1016/j.addr.2012.11.003. [DOI] [PubMed] [Google Scholar]
- 8.Collnot EM, Ali H, Lehr CM. J Control Release. 2012;161:235. doi: 10.1016/j.jconrel.2012.01.028. [DOI] [PubMed] [Google Scholar]
- 9.Lamprecht A. Nat Rev Gastroenterol Hepatol. 2010;7:311. doi: 10.1038/nrgastro.2010.66. [DOI] [PubMed] [Google Scholar]
- 10.Kriegel C, Amiji M. J Control Release. 2011;150:77. doi: 10.1016/j.jconrel.2010.10.002. [DOI] [PMC free article] [PubMed] [Google Scholar]
- 11.Kim JJ, Bridle BW, Ghia JE, Wang H, Syed SN, Manocha MM, Rengasamy P, Shajib MS, Wan Y, Hedlund PB, Khan WI. J Immunol. 2013;190:4795. doi: 10.4049/jimmunol.1201887. [DOI] [PubMed] [Google Scholar]
- 12.Verrey F, Jack DL, Paulsen IT, Saier MH, Jr, Pfeiffer R. J Membr Biol. 1999;172:181. doi: 10.1007/s002329900595. [DOI] [PubMed] [Google Scholar]
- 13.Nguyen HT, Dalmasso G, Yan Y, Laroui H, Dahan S, Mayer L, Sitaraman SV, Merlin D. J Biol Chem. 2010;285:1479. doi: 10.1074/jbc.M109.057141. [DOI] [PMC free article] [PubMed] [Google Scholar]
- 14.Merlin D, Sitaraman S, Liu X, Eastburn K, Sun J, Kucharzik T, Lewis B, Madara JL. J Biol Chem. 2001;276:39282. doi: 10.1074/jbc.M105077200. [DOI] [PubMed] [Google Scholar]
- 15.Nguyen HT, Dalmasso G, Torkvist L, Halfvarson J, Yan Y, Laroui H, Shmerling D, Tallone T, D’Amato M, Sitaraman SV, Merlin D. J Clin Invest. 2011;121:1733. doi: 10.1172/JCI44631. [DOI] [PMC free article] [PubMed] [Google Scholar]
- 16.Charania MA, Laroui H, Liu H, Viennois E, Ayyadurai S, Xiao B, Ingersoll SA, Kalman D, Merlin D. Infect Immun. 2013;81:923. doi: 10.1128/IAI.01388-12. [DOI] [PMC free article] [PubMed] [Google Scholar]
- 17.Muza-Moons MM, Koutsouris A, Hecht G. Infect Immun. 2003;71:7069. doi: 10.1128/IAI.71.12.7069-7078.2003. [DOI] [PMC free article] [PubMed] [Google Scholar]
- 18.Kucharzik T, Lugering A, Yan Y, Driss A, Charrier L, Sitaraman S, Merlin D. Lab Invest. 2005;85:932. doi: 10.1038/labinvest.3700289. [DOI] [PubMed] [Google Scholar]
- 19.Schreiber S, MacDermott RP, Raedler A, Pinnau R, Bertovich MJ, Nash GS. Gastroenterology. 1991;101:1020. doi: 10.1016/0016-5085(91)90729-5. [DOI] [PubMed] [Google Scholar]
- 20.MacKinnon AC, Farnworth SL, Hodkinson PS, Henderson NC, Atkinson KM, Leffler H, Nilsson UJ, Haslett C, Forbes SJ, Sethi T. J Immunol. 2008;180:2650. doi: 10.4049/jimmunol.180.4.2650. [DOI] [PubMed] [Google Scholar]
- 21.Ghasemi Y, Peymani P, Afifi S. Acta Biomed. 2009;80:156. [PubMed] [Google Scholar]
- 22.Kim JS, Cho KJ, Tran TH, Nurunnabi M, Moon TH, Hong SM, Lee YK. J Colloid Interface Sci. 2011;353:363. doi: 10.1016/j.jcis.2010.08.053. [DOI] [PubMed] [Google Scholar]
- 23.Pan J, Feng SS. Biomaterials. 2009;30:1176. doi: 10.1016/j.biomaterials.2008.10.039. [DOI] [PubMed] [Google Scholar]
- 24.Akin M, Bongartz R, Walter JG, Demirkol DO, Stahl F, Timur S, Scheper T. J Mater Chem. 2012;22:11529. doi: 10.1039/c2tb00328g. [DOI] [PubMed] [Google Scholar]
- 25.Tan YF, Chandrasekharan P, Maity D, Yong CX, Chuang KH, Zhao Y, Wang S, Ding J, Feng SS. Biomaterials. 2011;32:2969. doi: 10.1016/j.biomaterials.2010.12.055. [DOI] [PubMed] [Google Scholar]
- 26.Chen H, Khemtong C, Yang X, Chang X, Gao J. Drug Discov Today. 2011;16:354. doi: 10.1016/j.drudis.2010.02.009. [DOI] [PubMed] [Google Scholar]
- 27.Ulery BD, Nair LS, Laurencin CT. J Polym Sci Part B Polym Phys. 2011;49:832. doi: 10.1002/polb.22259. [DOI] [PMC free article] [PubMed] [Google Scholar]
- 28.Chen HW, Yeh J, Wang LY, Khurshid H, Peng N, Wang AY, Mao H. Nano Res. 2010;3:852. [Google Scholar]
- 29.Yu M, Yang Y, Han R, Zheng Q, Wang L, Hong Y, Li Z, Sha Y. Langmuir. 2010;26:8534. doi: 10.1021/la904488w. [DOI] [PubMed] [Google Scholar]
- 30.Yang Y, Yu M, Yan TT, Zhao ZH, Sha Y, Li Z. Bioorg Med Chem. 2010;18:5234. doi: 10.1016/j.bmc.2010.05.046. [DOI] [PubMed] [Google Scholar]
- 31.Liu J, Jiang Z, Zhang S, Saltzman WM. Biomaterials. 2009;30:5707. doi: 10.1016/j.biomaterials.2009.06.061. [DOI] [PMC free article] [PubMed] [Google Scholar]
- 32.Cohen-Sela E, Chorny M, Koroukhov N, Danenberg HD, Golomb G. J Control Release. 2009;133:90. doi: 10.1016/j.jconrel.2008.09.073. [DOI] [PubMed] [Google Scholar]
- 33.Mora-Huertas CE, Fessi H, Elaissari A. Adv Colloid Interface Sci. 2011;163:90. doi: 10.1016/j.cis.2011.02.005. [DOI] [PubMed] [Google Scholar]
- 34.Chen YF, Rosenzweig Z. Nano lett. 2002;2:1299. [Google Scholar]
- 35.Bivas-Benita M, Romeijn S, Junginger HE, Borchard G. Eur J Pharm Biopharm. 2004;58:1. doi: 10.1016/j.ejpb.2004.03.008. [DOI] [PMC free article] [PubMed] [Google Scholar]
- 36.Wang YY, Lai SK, Suk JS, Pace A, Cone R, Hanes J. Angew Chem Int Ed Engl. 2008;47:9726. doi: 10.1002/anie.200803526. [DOI] [PMC free article] [PubMed] [Google Scholar]
- 37.Kim TH, Ihm JE, Choi YJ, Nah JW, Cho CS. J Control Release. 2003;93:389. doi: 10.1016/j.jconrel.2003.08.017. [DOI] [PubMed] [Google Scholar]
- 38.Liu Y, Reineke TM. J Am Chem Soc. 2005;127:3004. doi: 10.1021/ja0436446. [DOI] [PubMed] [Google Scholar]
- 39.Ding J, Wang Y, Ma M, Zhang Y, Lu S, Jiang Y, Qi C, Luo S, Dong G, Wen S, An Y, Gu N. Biomaterials. 2013;34:209. doi: 10.1016/j.biomaterials.2012.09.025. [DOI] [PubMed] [Google Scholar]
- 40.Celik A, Comelekoglu U, Yalin S. Toxicol Ind Health. 2005;21:243. doi: 10.1191/0748233705th237oa. [DOI] [PubMed] [Google Scholar]
- 41.Fahrenkrog B, Aebi U. Nat Rev Mol Cell Biol. 2003;4:757. doi: 10.1038/nrm1230. [DOI] [PubMed] [Google Scholar]
Associated Data
This section collects any data citations, data availability statements, or supplementary materials included in this article.