

Abstract
Provitamin A-biofortified maize may contribute to alleviating vitamin A deficiency (VAD), in developing countries. However, processing the maize into food products may reduce its provitamin A content. The aims of this study were to determine the composition of provitamin A carotenoids in biofortified maize varieties as well as to assess their retention during processing of popular maize foods consumed in KwaZulu-Natal, South Africa. The non-provitamin A carotenoid, zeaxanthin and the provitamin A carotenoids, β-cryptoxanthin, and trans and cis isomers of β-carotene, and other unidentified trans and cis isomers of β-carotene were detected in varying concentrations in the maize. Milling provitamin A-biofortified maize into mealie meal resulted in a higher retention of carotenoids compared to milling into samp. The highest retention of provitamin A carotenoids was observed in cooked phutu and cooked samp, whilst cooking into thin porridge resulted in the lowest retention of provitamin A carotenoids. In phutu, 96.6 ± 20.3% β-cryptoxanthin and 95.5 ± 13.6% of the β-carotene were retained after cooking. In samp, 91.9 ± 12.0% β-cryptoxanthin and 100.1 ± 8.8% β-carotene; and in thin porridge, 65.8 ± 4.6% β-cryptoxanthin and 74.7 ± 3.0% β-carotene were retained after cooking. This study demonstrates that provitamin A retention in maize is affected by the cooking method (and hence cooked food form) and therefore cooking methods that result in a good retention of provitamin A need to be identified and recommended.
Keywords: Provitamin A, Maize, Biofortification, Milling, Cooking, Retention
Introduction
Maize (Zea mays) is a staple food for more than 1.2 billion people in sub-Saharan Africa (SSA) and Latin America and is regarded as a vital crop in the perspective of global nutrition (IITA 2010; Nuss and Tanumihardjo 2010). In sub-Saharan Africa, maize is a predominant staple. However, most of the maize that is produced and consumed is white and devoid of provitamin A carotenoids (Menkir et al. 2008; Li et al. 2007). This may partly explain why vitamin A deficiency (VAD), is a major public health problem in sub-Saharan Africa (Nuss and Tanumihardjo 2010). VAD affects approximately 33 million preschool-age children in Africa (West 2002) and is responsible for an estimated 20–24% of child mortality from diarrhoea, measles and malaria and 3% mortality from infectious diseases (Rice et al. 2004). In South Africa, the number of children with VAD increased from 33% in 1994 to 64% in 2005 (Labadarios et al. 2007; Labadarios and Van Middelkoop 1995).
In an international effort to combat VAD, maize is one of six staple crops that have been targeted for biofortification with provitamin A carotenoids by the HarvestPlus Challenge Programme (Tanumihardjo 2008; HarvestPlus Brief 2006). Biofortification of maize varieties with provitamin A by conventional breeding is viewed as a potential long-term sustainable strategy to alleviate VAD in selected target groups (Howe and Tanumihardjo 2006a, b; Nestel et al. 2006). The current breeding target for maize as set by HarvestPlus is 15 μg/g dry weight (DW) of provitamin A (Ortiz-Monasterio et al. 2007). An additional important aspect to consider when looking at the effectiveness of any biofortification strategy is the potential effect of food processing on the final provitamin A carotenoid content of the biofortified food products. Provitamin A carotenoids are sensitive and can be destroyed by environmental factors, such as heat, oxygen, light, and acidic conditions (Rodriguez-Amaya 1997; Gregory 1996). It is important to quantify the losses of provitamin A carotenoids during processing of provitamin A-biofortified maize. These losses should then be taken into account when setting targets for the provitamin A content of the maize.
It seems that the retention of provitamin A during maize milling has not been investigated. However, provitamin A carotenoids may be lost in the by-products of milling and the retention of the provitamin A carotenoids may vary with such factors as grain properties, milling method and the refinement of the milled product. With regards to thermal processing, although very limited, data are available on the retention of provitamin A carotenoids in cooked biofortified maize foods. Li et al. (2007) reported that only modest losses of provitamin A carotenoids in high β-carotene maize could be directly attributed to household processing steps in the preparation of African fermented maize porridges. The retention of β-carotene in the final, cooked products was 75.5% for the fermented and 75.2% for the unfermented porridges, respectively. Muzhingi et al. (2008) investigated the effect of cooking on the carotenoid content of raw maize flour and observed an increase in carotenoid concentration in all cooking methods, except baking. In contrast, the average retention of provitamin A carotenoids in provitamin A-biofortified maize following nixtamilization and frying, which are common processing methods used to prepare Mexican maize food products, was found only to be 64% (Lozano-Alejo et al. 2007). These studies suggest that cooking methods have a significant effect on provitamin A retention in provitamin A-biofortified maize.
In South Africa, like in most countries in sub-Saharan Africa, maize is processed in several ways into a wide variety of food products. Usually, the processing steps involve the milling of the maize into products of different particle size, followed by cooking of the milled products. Currently, there is a lack of data on the retention of provitamin A carotenoids when provitamin A-biofortified maize is processed into traditional African food products. This study therefore aimed to assess the retention of provitamin A carotenoids in provitamin A-biofortified maize during the preparation of popular maize foods consumed in KwaZulu-Natal, South Africa. The food products studied were phutu (a stiff porridge made from maize meal), thin porridge (porridge made from maize meal with a dry matter content of approximately 14%) and samp (broken maize grain), which are the most popular maize foods consumed by the rural African population in KwaZulu-Natal (Faber and Kruger 2005; Faber 2004; Faber et al. 1999, 2001).
Materials and methods
Maize breeding
The experimental F1 maize hybrids were developed by cross-pollination of recombinant inbred lines with deep orange grain colour which is positively correlated with total carotenoids content in maize grain. Ten hybrids with sufficient seed were then planted in 20 rows of 5 m each at Makhathini Research Station in KwaZulu-Natal. Standard cultural practices for maize production were followed. The F2 grain was obtained by full-sib mating of the F1 plants within each row of 17 plants. CC-37, which is a white maize grain single cross hybrid variety, was included as a control and was grown under the same conditions as the yellow maize hybrids. The maize was harvested manually and left to dry under ambient conditions (±25 °C) for 21 days. The maize was then threshed mechanically and the grain was stored in a cold room (±4 °C) before milling. A grain sample of 5 kg was then drawn for food processing.
Colour measurements and maize variety selection
Orange grain colour intensity of seven bulked varieties of provitamin A-biofortified maize was measured in terms of the Hunter L, a, b system using a Colorflex instrument (Hunter Associates Laboratory, Inc., Reston, Virginia, USA). The Hunter L, a, b, colour values of the seven bulked varieties ranged from: L, 48.76–60.29; a, 16.51–25.68; b, 29.25–37.46. Based on the Hunter L, a, b, values, the hybrid 10 MAK 7–8 was chosen as the darkest orange variety, 10 MAK 7–7 as the medium orange variety and 10 MAK 7–5 as the lightest orange variety. These three varieties were selected for processing in this study. CC-37, a popular single cross white maize grain variety in Southern Africa, was included as a control.
Maize milling
Grain of the three selected orange maize varieties and the control (white variety) was milled to obtain samp and maize meal. The maize grain was first cleaned using a grain cleaner (R.G Garvie and Sons, Agricultural Engineers, Aberdeen, Scotland, UK). Grain moisture was adjusted to 15% (w/v) before milling into maize meal and samp. Samp was produced by milling the maize grain with a degerminator mill (Dayton Electric Manufacturing Company, Inc., Reston, Virginia, USA). The whole milled product coming out of the degerminator was collected. A pilot plant roller mill (Model MK 150, Roff Industries, Kroonstad, South Africa) with a three break system was used to mill the maize grain into super meal, maize grits, bran and fine meal. The three break system consisted of a set of three roller mills of decreasing roller gap size, which progressively broke up maize grain into smaller particles. Each roller mill had a set of sieves for separating the maize particles into mill fractions. The mill fractions of larger particle size were manually transferred to the next roller mill for further size reduction. The super meal was the mill fraction which passed through a 495 μm aperture screen; it was collected from the last two roller mills.
Preparation of maize food products
Three Black African women from a rural area in KwaZulu-Natal with experience in cooking the popular maize food products, phutu, thin porridge and samp, were recruited to prepare these products for the study. The food products were prepared in the Food Processing Laboratory at the University of KwaZulu-Natal, Pietermaritzburg, South Africa. The recipes and cooking procedures for all three of the food products were standardised after several cooking trials. Phutu was prepared by bringing 280 mL of tap water to the boil. Two cups (268 g) of maize meal were added to the water and stirred as soon as the mixture reached boiling point. The phutu was allowed to stand on low heat for approximately 75 min with the pot lid on and occasional stirring. The thin porridge was prepared by bringing 8 cups (2,000 mL) of tap water to the boil. Two cups (268 g) of maize meal were added to two cups (500 ml) of cold water to make a paste, which was then added to the boiling water and stirred until it was smooth. The porridge was cooked on medium heat for 25 min with the lid on and occasional stirring. Two cups of samp (369 g) were soaked overnight in four cups (1,000 mL) of cold water. Four cups (1,000 mL) of boiling water were then added to the pre-soaked samp and boiled for an additional 135 min, with the pot lid on. An additional two cups (500 mL) of water were added to the samp during the cooking period. The temperature and pH of each of the three food products were recorded at the end of their cooking period. No sugar or salt was added to the cooked food products, so as not to influence the nutritional composition.
Handling and preparation of samples for HPLC analysis
Raw and cooked maize samples were stored in amber glass bottles, which were flushed with nitrogen gas and then immediately placed into a cooler box. Ice packs were placed over the bottles and multi-layered newspaper sheets were used to insulate the cooler box. The cooler box was transported to the Council for Scientific and Industrial Research (CSIR), Pretoria, with an overnight courier service. Upon receipt, the samples were transferred to a freezer and stored at −20 °C. Thawed raw maize samples were milled using a 0.5 mm rotor mill (ultra centrifugal mill ZM 200, Retsch, Haan, Germany). Cooked maize samples were first freeze-dried, then milled into a fine powder using a coffee grinder (Braun, Frankfurt, Germany). The prepared samples were stored under nitrogen at −20 °C until they were analysed by HPLC.
Chemicals and standards
All solvents used in the analysis were HPLC grade. The following solvents were used: methanol and tetrahydrofuran (THF) (Labscan, Gliwice, Poland), ethanol (Merck, Darmstadt, Germany) and tert-butyl methyl ether (Sigma-Aldrich, St. Louis, MO, USA). Analytical standards of β-carotene, β-cryptoxanthin (Sigma-Aldrich, St. Louis, MO, USA) (Sigma-Aldrich, St. Louis, MO, USA) and zeaxanthin (ChromaDex, Irvine, CA, USA) were used to calibrate and quantify the carotenoids.
Sample extraction
Samples were analysed in duplicate using the method described by Muzhingi et al. (2008). Extraction was performed by incubating 1 g of sample with 5 mL of methanol for 2 h at room temperature (±25 °C). During that time, the sample mixture was vortexed for 30 s at 30 min intervals. The sample mixture was flushed with nitrogen gas and stored overnight (16–18 h) in the dark at room temperature. The mixture was centrifuged at 1409 × g for 5 min for 5 min. The methanol layer was transferred into a 25 mL volumetric flask and the sample was extracted using 5 mL of tetrahydrofuran (THF), incorporating the vortexing and centrifugation steps. Extraction was repeated three times using 5 mL of THF each time. The THF layers were combined with the methanol layer. The combined methanol and THF extract was then filtered and concentrated to a volume <3 mL using a rotary evaporator/concentrator. Thereafter, the concentrated extract was dried completely under nitrogen gas and re-suspended in a 1 mL mixture of ethanol and THF (1:1, v/v). The extract was filtered through a 0.45 μm PTFE/Teflon syringe filter before analysis by HPLC.
Instrumentation and chromatography
Carotenoid analysis was carried out using a Hewlett-Packard 1100 HPLC (Agilent Technologies Incorporated, Loveland, CO, USA) consisting of a binary pump, autosampler, column thermostat, diode array detector and ChemStation software (Revision B.03 02, Agilent Technologies Incorporated, Loveland, CO, USA). The carotenoids were separated on a C30 column with polymeric bonding chemistry (250 × 2.0 mm, 5 μm, TMC Co., Ltd, Kyoto, Japan) with the corresponding guard column (20 × 2.0 mm, 5 μm) operated at a flow rate of 0.4 mL/min. Two mobile phases were employed and they were both mixtures of methanol, tert-butyl methyl ether and water [Mobile Phase A: 83/15/2 (v/v/v) and Mobile Phase B: 8/90/2 (v/v/v)]. The gradient elution programme was set as follows: (i) 0 to 1 min with 100% A, (ii)1 to 8 min with a linear gradient to 70% A, (iii) 8 to 13 min held at 70% A, (iv) 13 to 22 min with a linear gradient to 45% A, (v) 22 to 24 min with a linear gradient to 5% A, (vi) 24 to 25 min held at 5% A, (vii) 25 to 27 min a linear gradient to 100% A, and (viii) 27 to 30 min held at 100% A. Carotenoids were monitored at 450 nm and the injection volume was 20 μL. All-trans-β-carotene, β-cryptoxanthin and zeaxanthin in the samples were identified by comparing their peak retention times and characteristic UV/visible absorption spectra with that of their standards. Quantification of these carotenoids was accomplished using multilevel response curves with carotenoid standards at concentration ranges of 0.03–3 μg/mL for zeaxanthin, 0.02–4 μg/mL for β-cryptoxanthin and 0.04–2 μg/mL for β-carotene. The concentration of each standard was calculated using the specific absorption coefficient (A1%) for each carotenoid: 2,480 for zeaxanthin in ethanol at 450 nm, 2,356 for β-cryptoxanthin in ethanol at 452 nm and 2,620 for all-trans β-carotene in ethanol at 450 nm (Rodriguez-Amaya and Kimura 2004; Thomas et al. 2001). The cis isomers of β-carotene were quantified using the standard response curve for all-trans β-carotene.
Isomer identification
Mass spectral investigation of carotenoid isomers was performed on a Waters SYNAPT QTOF HDMS G1 mass spectrometer (Waters, Milford, USA) equipped with an atmospheric pressure ionisation source and lock spray interface for continuous mass accuracy during the analysis process. Chromatographic separation was achieved using an Acquity UPLC system (Waters, Milford, USA) under reversed phase conditions and utilising a C18 stationary phase. To enable the detection of carotenoids like β-carotene, β-cryptoxanthin and zeaxanthin, standards were infused into the source and the ionisation conditions optimised. Optimised mass spectral conditions were used to detect the selected carotenoids after chromatographic separation.
Moisture analysis
The moisture content of the samples was measured according to the AOAC (Association of Official Analytical Chemists International) Official Method 934.01 (AOAC 2002).
Apparent retention of carotenoids
Apparent retention is defined as the ratio of the nutrient content in the cooked food to the nutrient content in the raw food, expressed on a dry weight basis (Murphy et al. 1975). Determination of apparent retention is convenient because it eliminates problems associated with obtaining sample weights. However, this method tends to overestimate nutrient retention. (Murphy et al. 1975). Previous researchers (e.g. Muzhingi et al. 2008; Li et al. 2007) have found the calculation of apparent retention to be straightforward, as it is on a dry matter basis. Apparent retention was therefore calculated, using the equation described by Murphy et al. (1975), which is as follows:
 |
Statistical analyses
PASW (Predictive Analytics SoftWare) Statistics version 18.0 (IBM Corporation, New York) was used to analyse the data. Standard descriptive statistics (using means and standard deviations) were used to express the duplicate carotenoid measurements. Univariate analysis of variance (UNIANOVA) and Tukey post-hoc multiple comparisons of means were used to evaluate the influence of maize variety and maize food form on carotenoid content and its retention. Bulk grain of each maize variety was mixed thoroughly and then divided into almost equal positions. Each portion of the grain was treated as a replicate. Each grain replicate was milled and processed into the food products as described above. Duplicate extracts were obtained from each of the two replicate food samples of each food type, i.e. samp, phuthu and thin porridge, and analysed by HPLC as described earlier. Therefore for each food type, four determinations of carotenoid concentration were subjected to statistical analysis.
Results and discussion
Carotenoid composition
Figure 1a, b and c show representative chromatograms of the carotenoids present in the provitamin A-biofortified maize grain, milled mealie meal and phutu, respectively.
Fig. 1.
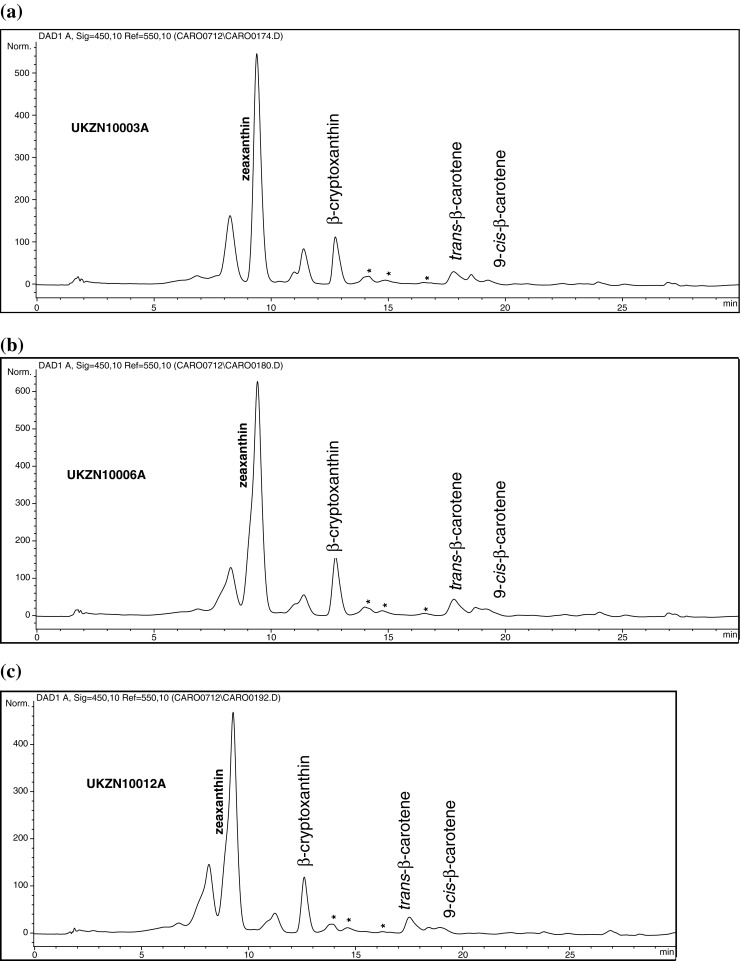
HPLC chromatogram of the carotenoids present in an extract of a provitamin A-biofortified maize grain, b raw mealie meal and c cooked phutu. C30 column (250 × 2.0 mm, 5 μm) used. Two mobile phases, A and B, employed. Both mobile phases comprised of a mixture of methanol/tert-butyl methyl ether/water [A: 83/15/2 (v/v/v); B: 8/90/2 (v/v/v)]. Reverse phase linear gradient elution; injection volume 20 μL; monitored at 450 nm. UKZN 10003A = 10 MAK 7–7 raw maize grain; UKZN 10006A = 10 MAK 7–7 raw mealie meal; UKZN 10012A = 10 MAK 7–7 cooked phutu
HPLC analyses detected the presence of zeaxanthin, β-cryptoxanthin and trans and cis isomers of β-carotene in the three maize forms, raw maize grain, mealie meal and phutu. The first peak eluted is likely to be lutein because it is one of the major carotenoids in maize. Lutein was not determined in the present study in order to limit expenditure on non-provitamin A carotenoids. All of the three maize forms had much higher concentrations of zeaxanthin, when compared to the concentration of the other carotenoids detected during the analysis. Apart from β-carotene, zeaxanthin also contributes to the orange colour of the maize, but has no vitamin A activity. β-cryptoxanthin and β-carotene are both precursors of vitamin A.
Mass spectral analysis of the carotenoid extracts revealed four different β-carotene isomers: 9-cis-β-carotene; 13-cis-β-carotene; 9,13-di-cis-β-carotene, and 13,15-di-cis-β-carotene. The 15-cis isomer was not detected with the specific experimental conditions applied in this study. The 9-cis isomer was tentatively identified using the mass spectrum isomer profile, the UV/visible absorption spectra and methods described by Lacker et al. (1999) and Muzhingi et al. (2008). An authentic standard is required to confirm the 9-cis isomer peak. Although three additional β-carotene isomers (indicated by * in Fig. 1a, b and c) were identified in the extracts, individual isomer identification and quantification was not possible and hence a total concentration of the unidentified isomers is reported.
Table 1 shows the carotenoid content of different varieties of provitamin A-biofortified maize grain and processed products. As expected, β-carotene was not detected in the white maize grain, while only negligible amounts of zeaxanthin and β-cryptoxanthin were present. The total provitamin A carotenoid concentration in the provitamin A-biofortified maize grain ranged from 7.30-8.30 μg/g DW, which was higher when compared to the concentration (0.25–2.5 μg/g DW) generally reported for typical yellow maize varieties (Nuss and Tanumihardjo 2010), but still lower when compared to the current breeding target for biofortified maize as set by HarvestPlus (15 μg/g DW of provitamin A) (Ortiz-Monasterio et al. 2007). These results indicate that additional research is required to improve the concentration of carotenoids in maize hybrids, in order to reach the concentration set by HarvestPlus. This can be achieved by further recombination of the lines used in these hybrids.
Table 1.
Carotenoid composition of provitamin A-biofortified maize grain and its processed products (μg/g dry weight)
| Maize variety | Maize form | Zeaxanthina | β-cryptoxanthinb | β-carotene isomers | Total β-caroteneac | Total provitamin A carotenoidsad | Total carotenoidsae | ||
|---|---|---|---|---|---|---|---|---|---|
| All-trans a | 9-cis a | Other cis ab | |||||||
| RAW GRAIN | |||||||||
| CC-37 (white) | <0.3f (0.0)ga | 0.1 (0.0)a | NDh | ND | ND | ND | 0.1 (0.0)a | 0.4 (0.2)a | |
| 10 MAK 7-5 | 15.7 (2.1)b–f | 3.7 (0.5)b–d | 1.7c(0.2)c–f | 0.6 (0.1)b–d | 1.3 (0.2)c–f | 3.6 (0.6)b–e | 7.3 (1.0)b–d | 23.0 (6.3)b–e | |
| 10 MAK 7-7 | 18.7 (1.8)fg | 4.3 (0.4)c–h | 1.5 (0.1)b–e | 0.5 (0.0)b | 1.5 (0.1)c–h | 3.5 (0.3)b–d | 7.7 (0.7)c–f | 26.4 (7.6)d–f | |
| 10 MAK 7-8 | 14.1 (0.8)b–e | 4.8 (0.2)e–i | 1.5 (0.1)b–e | 0.5 (0.0)b | 1.5 (0.0)c–h | 3.4 (0.1)b–d | 8.3 (0.3)c–g | 22.3 (5.6)b–e | |
| MILLED | |||||||||
| Raw mealie meal | |||||||||
| 10 MAK 7-5 | 18.2 (2.2)e–g | 4.4 (0.5)d–h | 1.8 (0.2)d–g | 0.8 (0.1)c–g | 1.3 (0.2)c–f | 3.8 (0.4)c–e | 8.2 (0.9)c–g | 26.4 (7.3)d–f | |
| 10 MAK 7-7 | 25.5 (1.6)i | 5.9 (0.4)jk | 2.2 (0.1)g | 0.9 (0.1)e–h | 1.7 (0.1)f–h | 4.7 (0.3)f | 10.6 (0.7)h | 36.1 (10.4)g | |
| 10 MAK 7-8 | 16.8 (0.4)c–g | 6.2 (0.1)k | 1.9 (0.0)e–g | 0.7 (0.0)c–f | 1.5 (0.1)c–h | 4.1 (0.1)c–f | 10.4 (0.2)h | 27.2 (6.7)d–f | |
| Raw samp | |||||||||
| 10 MAK 7-5 | 17.8 (0.4)d–g | 4.2 (0.2)c–g | 1.9 (0.1)e–g | 0.8 (0.0)c–g | 1.5 (0.1)c–h | 4.2 (0.1)d–f | 8.4 (0.3)c–g | 26.2 (7.1)c–e | |
| 10 MAK 7-7 | 17.0 (1.3)d–g | 4.1 (0.3)c–f | 1.7 (0.1)c–f | 0.7 (0.0)c–f | 1.7 (0.1)f–h | 4.0 (0.1)c–f | 8.1 (0.5)c–g | 25.1 (6.8)c–e | |
| 10 MAK 7-8 | 13.4 (0.6)b–d | 5.0 (0.3)f–j | 1.7 (0.1)c–f | 0.6 (0.0)b–d | 1.7 (0.1)f–h | 4.0 (0.2)c–f | 8.9 (0.5)d–h | 22.3 (5.2)b–e | |
| COOKED | |||||||||
| Phutu | |||||||||
| 10 MAK 7-5 | 23.4 (2.1)hi | 5.2 (0.4)h–j | 1.6 (0.1)c–f | 0.7 (0.0)c–f | 1.7 (0.1)f–h | 4.1 (0.3)c–f | 9.3 (0.7)e–h | 32.7 (9.6)fg | |
| 10 MAK 7-7 | 20.3 (0.2)gh | 4.6 (0.0)d–h | 1.7 (0.0)c–f | 0.7 (0.0)c–f | 1.4 (0.0)c–g | 3.8 (0.1)c–e | 8.3 (0.1)c–g | 28.6 (8.3)ef | |
| 10 MAK 7-8 | 16.7 (0.2)b–g | 5.8 (0.1)i–k | 1.7 (0.0)c–f | 0.9 (0.0)e–h | 1.4 (0.0)c–g | 4.0 (0.1)c–f | 9.8 (0.2)gh | 26.5 (6.7)d–f | |
| Thin porridge | |||||||||
| 10 MAK 7-5 | 12.2 (0.0)b | 2.8 (0.1)b | 1.2 (0.0)b | 0.8 (0.0)c–g | 0.8 (0.0)b | 2.8 (0.0)b | 5.6 (0.1)b | 17.8 (4.9)b | |
| 10 MAK 7-7 | 16.0 (0.6)b–g | 3.7 (0.1)b–d | 1.4 (0.0)b–d | 0.9 (0.0)e–h | 1.1 (0.0)b–d | 3.4 (0.1)b–d | 7.1 (0.1)bc | 23.0 (6.4)b–e | |
| 10 MAK 7-8 | 12.4 (0.5)bc | 4.4 (0.2)d–h | 1.4 (0.0)b–d | 0.7 (0.0)c–f | 1.1 (0.0)b–d | 3.2 (0.1)bc | 7.6 (0.2)c–e | 20.0 (4.9)bc | |
| Samp | |||||||||
| 10 MAK 7-5 | 16.0 (0.5)b–g | 3.3 (0.1)bc | 1.6 (0.0)c–f | 1.1 (0.1)h | 1.2 (0.1)c–e | 3.9 (0.1)c–f | 7.2 (0.3)b–d | 23.2 (6.4)b–e | |
| 10 MAK 7-7 | 19.3 (0.6)f–h | 3.9 (0.2)c–e | 1.6 (0.0)c–f | 0.8 (0.0)c–g | 1.5 (0.0)c–h | 3.9 (0.0)c–f | 7.9 (0.2)c–f | 27.1(7.8)d–f | |
| 10 MAK 7-8 | 16.3 (0.1)b–g | 5.1 (0.0)g–j | 1.9 (0.0)e–g | 0.9 (0.0)e–h | 1.6 (0.0)e–h | 4.4 (0.0)e–f | 9.5 (0.1)f–h | 25.8 (6.4)c–e | |
aValues within the same column with different letters are significantly different at P < 0.05 (Tukey HSD test)
bTotal concentration of unidentified cis isomers of β-carotene
cSum of all-trans, 9-cis and other cis
dSum of β-cryptoxanthin and total β-carotene
eSum of zeaxanthin, β-cryptoxanthin and total β-carotene
fMean of four determinations
gStandard deviation given in parenthesis
h ND Not detected, detection limit for β-carotene was <0.01 mg/100 g
β-cryptoxanthin [3.7–4.8 μg/g DW] was the most abundant provitamin A carotenoid present in the provitamin A-biofortified maize grain samples. Similar results were also reported by Lozano-Alejo et al. (2007). However, the range of β-cryptoxanthin values reported in the present study is significantly higher. In contrast, a study by Li et al. (2007) showed considerably less β-cryptoxanthin concentration, when compared to that of β-carotene, in high β-carotene containing maize. Yet, it has to be emphasised that although β-cryptoxanthin is present in higher concentrations than β-carotene in many varieties or breeding lines of provitamin A-biofortified maize, it has only one-half of the provitamin A activity of β-carotene (Kimura et al. 2007). The total β-carotene content in the maize grain samples ranged from 3.4 to 3.6 μg/g DW, which was 5 times higher than the mean concentration reported in a survey of maize lines by Kurilich and Juvik (1999). Overall results indicate that our research programme has made some significant progress in developing recombinant inbred maize lines with significant concentrations of carotenoids through conventional selection on the basis of grain colour intensity. The most predominant β-carotene isomer in the raw grain samples was the all-trans isomer (1.5–1.7 μg/g DW), which was higher in concentration when compared to the concentration reported in the study by Lozano-Alejo et al. (2007). Further breeding progress that approximates the concentrations as envisaged by HarvestPlus could be achieved by combining molecular breeding tools with conventional processes in the future.
Carotenoid retention
Milling
Table 2 shows the carotenoid retention (%) during milling of maize grain into mealie meal and samp followed by cooking the milled products into phutu, thin porridge and samp. Milling maize grain into mealie meal resulted in a higher retention of zeaxanthin (115.9%–136.4%), β-cryptoxanthin (118.9%–137.2%) and β-carotene (105.6%–134.3%), compared to milling into samp. With milling into samp there was a lower retention of zeaxanthin (90.9%–113.4%) and β-cryptoxanthin (95.3%–113.5%). In maize, carotenoids are found largely in the endosperm and small amounts in the germ (Johnson 2000). Both of these anatomical parts of the maize kernel are broken up during milling and therefore it is expected that the carotenoids are lost during milling. The higher retention observed in mealie meal could be a result of the process of milling into mealie meal, which increased the concentrations of available carotenoids due to the greater breakdown of the maize kernel matrix.
Table 2.
Retention of carotenoids in processed maize products
| Maize variety | Maize form | Retention (%) | ||
|---|---|---|---|---|
| Zeaxanthin | Provitamin A carotenoids | |||
| β-cryptoxanthin | β-carotene | |||
| MILLED | ||||
| Raw mealie meal | ||||
| 10 MAK 7-5 | 115.9 | 118.9 | 105.6 | |
| 10 MAK 7-7 | 136.4 | 137.2 | 134.3 | |
| 10 MAK 7-8 | 119.1 | 129.2 | 120.6 | |
| Raw samp | ||||
| 10 MAK 7-5 | 113.4 | 113.5 | 116.7 | |
| 10 MAK 7-7 | 90.9 | 95.3 | 114.3 | |
| 10 MAK 7-8 | 95.0 | 104.2 | 117.6 | |
| COOKED | ||||
| Phutu | ||||
| 10 MAK 7-5 | 128.6a (149.0)b | 118.2 (140.5) | 107.9 (113.9) | |
| 10 MAK 7-7 | 79.6 (108.6) | 78.0 (107.0) | 80.9 (108.6) | |
| 10 MAK 7-8 | 99.4 (118.4) | 93.5 (120.8) | 97.6 (117.6) | |
| Thin porridge | ||||
| 10 MAK 7-5 | 67.0 (77.7) | 63.6 (75.7) | 73.7 (77.8) | |
| 10 MAK 7-7 | 62.7 (85.6) | 62.7 (86.0) | 72.3 (97.1) | |
| 10 MAK 7-8 | 73.8 (87.9) | 71.0 (91.7) | 78.0 (94.1) | |
| Samp | ||||
| 10 MAK 7-5 | 89.9 (101.9) | 78.6 (89.2) | 92.9 (108.3) | |
| 10 MAK 7-7 | 113.5 (103.2) | 95.1 (90.7) | 97.5 (111.4) | |
| 10 MAK 7-8 | 121.6 (115.6) | 102.0 (106.3) | 110.0 (129.4) | |
aRetention at a processing step
bValues in parentheses are for overall retention; calculated as proportion of provitamin A carotenoids in cooked product compared with the provitamin A carotenoid content in whole grain
Observations are given as a mean of four determinations
Cooking
Cooking maize mealie meal into phutu resulted in the highest retention of zeaxanthin (128.6%), β-cryptoxanthin (118.2%) and β-carotene (107.9%) in the 10 MAK 7–5 variety (Table 2), with the lowest retention of zeaxanthin (79.6%), β-cryptoxanthin (78.0%) and β-carotene (80.9%) found in the 10 MAK 7–7 variety. With cooked samp, the highest retention of zeaxanthin (121.6%), β-cryptoxanthin (102.0%) and β-carotene (110.0%) was found in the 10 MAK 7–8 variety, whilst there was lower retention of carotenoids when the other two biofortified varieties were used. Overall, cooking into phutu and samp resulted in the highest retention of carotenoids, whilst the lowest retention of carotenoids was found for cooked thin porridge, irrespective of the maize variety used. The retention results of the present study should be interpreted with caution as there is a tendency of overestimating nutrient retention when apparent retention is used, as mentioned earlier.
Increases in carotenoid retention as a result of cooking have been reported previously. As stated earlier, Muzhingi et al. (2008) observed an increase in the carotenoid concentration in all cooked yellow maize products, except for baked muffins. Khachik et al. (1992a) found that conventional blanching and cooking significantly increased the carotenoid concentration in several green vegetables. Granado et al. (1992) also reported that the boiling of vegetables resulted in an increase in the amounts of carotenoids. The increase in carotenoid concentration is suspected to be due to the increased chemical extractability of carotenoids as a result of the breakdown of the food matrix (Khachik et al. 1992b). Although the cooked foods had different moisture contents (phutu, 34.9 ± 3.8%; thin porridge, 91.2 ± 0.4%; and samp, 73.9 ± 4.1%), moisture content of the cooked food was found not to have an effect on carotenoid retention in the foods (p = 0.620). Differences in carotenoid retention among the cooked maize foods could be attributed to the cooking temperature. Although the thin porridge was cooked for the shortest time (25 min), it reached the highest cooking temperature of 96 °C, compared to 86 °C and 84 °C, for phutu and samp, respectively. Exposure to extreme heat is known to destroy provitamin A carotenoids (Rodriguez-Amaya 1997). It can be derived from the study that further investigations on cooking temperature and time for the various food products is required to find optimum cooking conditions that retain significant concentrations of provitamin A carotenoids in maize foods.
Both maize variety and maize food form significantly (p < 0.05) influenced the carotenoid concentrations in the maize products (Table 3). Even though only a few biofortified maize varieties were studied, the results of the present study confirm that carotenoid concentration depends on the maize variety and that there is genetic variation for this trait (Muzhingi et al. 2008). The results suggest that a combination of selective breeding for high-provitamin A maize varieties and the selective processing of the provitamin A-biofortified maize varieties into maize food forms that have good provitamin A retention, such as phutu and samp, would enable the delivery of significant concentrations of provitamin A to the consumer. The results suggest that selection for high-provitamin A maize varieties can be emphasised in a maize breeding programme. Although, maize grain colour is generally not correlated with provitamin A concentration, deep orange maize varieties have often been found to contain substantial concentrations of provitamin A. Due to the high costs of HPLC analysis, we suggest that maize grain colour be used for the intial screening for the presence of provitamin A in maize varieties. HPLC analysis would then be used to determine provitamin A carotenoid concentrations in the promising varieties.
Table 3.
Effect of maize variety and maize form on carotenoid content
| Source of variation | Zeaxanthin | β-cryptoxanthin | Total β-carotene | Total provitamin A carotenoids | ||||||||
|---|---|---|---|---|---|---|---|---|---|---|---|---|
| F | df | p valuea | F | df | P valuea | F | df | p valuea | F | df | p valuea | |
| Maize variety | 134.591 | 3 | 0.000 | 200.721 | 3 | 0.000 | 126.771 | 3 | 0.000 | 157.285 | 3 | 0.000 |
| Maize form | 32.239 | 5 | 0.000 | 49.876 | 5 | 0.000 | 21.220 | 5 | 0.000 | 30.724 | 5 | 0.000 |
| Maize variety and maize form | 6.939 | 10 | 0.000 | 5.359 | 10 | 0.001 | 3.293 | 10 | 0.012 | 4.139 | 10 | 0.004 |
aUnivariate analysis of variance, p is significant at <0.005
Distribution of β-carotene isomers in maize products
The effects of processing on the quantitative distribution of β-carotene isomers are shown in Table 4. In terms of the milled products, raw mealie meal had a slightly higher concentration of total β-carotene compared to the raw samp. Amongst the raw milled products, raw mealie meal of the 10 MAK 7–7 variety had the highest concentration of total β-carotene (4.7 ± 0.3 μg/g). With the cooked products, cooked samp was found to contain the highest concentration of total β-carotene compared to the cooked phutu and thin porridge. In both the milled and cooked products, there was a higher concentration of cis-isomers compared to trans-isomers. Compared to trans-isomers, cis-isomers are less stable and as stated earlier, they have lower vitamin A activity (Institute of Medicine 2000; Gregory 1996). However, it is unlikely that the higher percentage of cis-isomers in the milled and cooked products would significantly change the provitamin A activity of the biofortified maize food products.
Table 4.
Quantitative distribution of β-carotene isomers in provitamin A-biofortified maize grain and its processed products (μg/g dry weight)
| Maize variety | Maize form | β-carotene isomers | Total cis ac | Total β-carotenead | % trans e | % cis f | ||
|---|---|---|---|---|---|---|---|---|
| All-trans a | 9-cis a | Other cis ab | ||||||
| RAW GRAIN | ||||||||
| CC-37 (white) | NDg | ND | ND | ND | ND | ND | ND | |
| 10 MAK 7-5 | 1.7h(0.2)i | 0.6 (0.1) | 1.3 (0.2) | 1.9 (0.5) | 3.6 (0.6) | 46.0 (0.7) | 54.0 (0.7) | |
| 10 MAK 7-7 | 1.5 (0.1) | 0.5 (0.0) | 1.5 (0.1) | 1.9 (0.7) | 3.5 (0.3) | 42.2 (2.8) | 55.9 (0.2) | |
| 10 MAK 7-8 | 1.5 (0.1) | 0.5 (0.0) | 1.5 (0.0) | 2.0 (0.7) | 3.4 (0.1) | 42.8 (0.1) | 57.2 (0.1) | |
| MILLED | ||||||||
| Raw mealie meal | ||||||||
| 10 MAK 7-5 | 1.8 (0.2) | 0.8 (0.1) | 1.3 (0.2) | 2.1 (0.3) | 3.8 (0.4) | 46.2 (0.4) | 53.8 (0.4) | |
| 10 MAK 7-7 | 2.2 (0.1) | 0.9 (0.1) | 1.7 (0.1) | 2.6 (0.6) | 4.7 (0.3) | 45.7 (0.6) | 54.3 (0.6) | |
| 10 MAK 7-8 | 1.9 (0.0) | 0.7 (0.0) | 1.5 (0.1) | 2.2 (0.6) | 4.1 (0.1) | 45.8 (0.4) | 54.3 (0.4) | |
| Raw samp | ||||||||
| 10 MAK 7-5 | 1.9 (0.1) | 0.8 (0.0) | 1.5 (0.1) | 2.3 (0.5) | 4.2 (0.1) | 45.2 (0.3) | 54.8 (0.3) | |
| 10 MAK 7-7 | 1.7 (0.1) | 0.7 (0.0) | 1.7 (0.1) | 2.3 (0.7) | 4.0 (0.1) | 41.9 (0.1) | 58.1 (0.1) | |
| 10 MAK 7-8 | 1.7 (0.1) | 0.6 (0.0) | 1.7 (0.1) | 2.3 (0.7) | 4.0 (0.2) | 42.8 (0.0) | 57.2 (0.0) | |
| COOKED | ||||||||
| Phutu | ||||||||
| 10 MAK 7-5 | 1.6 (0.1) | 0.7 (0.0) | 1.7 (0.1) | 2.5 (0.7) | 4.1 (0.3) | 39.9 (0.2) | 60.1 (0.2) | |
| 10 MAK 7-7 | 1.7 (0.0) | 0.7 (0.0) | 1.4 (0.0) | 2.1 (0.4) | 3.8 (0.1) | 44.7 (0.4) | 55.3 (0.4) | |
| 10 MAK 7-8 | 1.7 (0.0) | 0.9 (0.0) | 1.4 (0.0) | 2.3 (0.3) | 4.0 (0.1) | 43.3 (0.3) | 56.7 (0.3) | |
| Thin porridge | ||||||||
| 10 MAK 7-5 | 1.2 (0.0) | 0.8 (0.0) | 0.8 (0.0) | 1.6 (0.1) | 2.8 (0.0) | 43.3 (0.8) | 56.7 (0.8) | |
| 10 MAK 7-7 | 1.4 (0.0) | 0.9 (0.0) | 1.1 (0.0) | 2.0 (0.1) | 3.4 (0.1) | 40.0 (0.3) | 60.0 (0.3) | |
| 10 MAK 7-8 | 1.4 (0.0) | 0.7 (0.0) | 1.1 (0.0) | 1.8 (0.3) | 3.2 (0.1) | 43.8 (0.1) | 56.2 (0.1) | |
| Samp | ||||||||
| 10 MAK 7-5 | 1.6 (0.0) | 1.1 (0.1) | 1.2 (0.1) | 2.3 (0.1) | 3.9 (0.1) | 41.3 (0.9) | 58.7 (0.9) | |
| 10 MAK 7-7 | 1.6 (0.0) | 0.8 (0.0) | 1.5 (0.0) | 2.3 (0.5) | 3.9 (0.0) | 40.9 (0.1) | 59.1 (0.1) | |
| 10 MAK 7-8 | 1.9 (0.0) | 0.9 (0.0) | 1.6 (0.0) | 2.5 (0.5) | 4.4 (0.0) | 42.8 (0.3) | 57.2 (0.3) | |
aMeasured in μg/g
bConcentration of unidentified cis isomers of β-carotene
cSum of 9-cis and other cis
dSum of all-trans, 9-cis and other cis
eCalculated from duplicate values for% trans
fCalculated from duplicate values for% cis
g ND Not detected, detection limit for β-carotene was <0.01 mg/100 g
hMean of four determinations
iStandard deviation given in parenthesis
Conclusions
The present study shows that different carotenoids, including vitamin A precursors (provitamin A), are present in biofortified maize varieties, and also that the carotenoid composition seems to be influenced by maize variety. Thus, it seems feasible to screen maize varieties for significant concentrations of provitamin A in a breeding programme. Results of the present study indicate that milling provitamin A-biofortified maize into mealie meal result in a higher retention of carotenoids compared to milling into samp. The highest retention of provitamin A carotenoids was observed in cooked phutu and cooked samp, whilst the lowest retention of provitamin A carotenoids was observed in cooked thin porridge. The present study highlights the need to identify and recommend maize food forms in which there is a high retention of provitamin A carotenoids occur during processing, to ensure optimal delivery of the carotenoids to the consumer. In addition, the study also suggests that many varieties of maize should be tested for both value for cultivation and use, because of the association between maize variety and provitamin A concentration. Although white maize food products are widely accepted and consumed in South Africa, the consumer acceptance of provitamin A-biofortified maize food products is likely to be a challenge. Thus, we are currently investigating the acceptability of provitamin A-biofortified maize food products among rural consumers in South Africa.
Acknowledgements
The authors thank the National Research Foundation (NRF) (South Africa); HarvestPlus challenge program and the University of KwaZulu-Natal Research Office for funding this study. We also thank the International Maize and Wheat Improvement Center (CIMMYT) and the International Institute for Tropical Agriculture (IITA), in particular Dr Kevin Pixley and Dr Abebe Menkir respectively, for providing the maize germplasm lines that were used to develop the recombinant inbred maize parents for the experimental hybrids. The seed of white maize check hybrid was provided by Seed Co Ltd (Zimbabwe). We also thank Judy Reddy and her colleagues at the CSIR, Pretoria, for assisting with the analysis of carotenoids in maize samples.
References
- Official methods of analysis of AOAC international, 17th edn. Volume I and II. Maryland: AOAC International; 2002. [Google Scholar]
- Faber M. Complementary foods consumed by 6–12 month old rural infants in South Africa are inadequate in micronutrients. Public Health Nutr. 2004;8:373–381. doi: 10.1079/phn2004685. [DOI] [PubMed] [Google Scholar]
- Faber M, Kruger S. Dietary intake, perceptions regarding body weight, and attitudes toward weight control of normal weight, overweight, and obese Black females in a rural village in South Africa. Ethn Dis. 2005;15:238–245. [PubMed] [Google Scholar]
- Faber M, Smuts CM, Benadé AJS. Dietary intake of primary school children in relation to food production in a rural area in KwaZulu-Natal, South Africa. Int J Food Sci Nutr. 1999;50:57–64. doi: 10.1080/096374899101427. [DOI] [PubMed] [Google Scholar]
- Faber M, Jogessar VB, Benadé AJS. Nutritional status and dietary intakes of children aged 2–5 years and their caregivers in a rural South African community. Int J Food Sci Nutr. 2001;52:401–411. doi: 10.1080/09637480120078285. [DOI] [PubMed] [Google Scholar]
- Granado F, Olmedilla B, Blanco I, Rojas-Hidalgo E. Carotenoid composition in raw and cooked Spanish vegetables. J Agric Food Chem. 1992;40:2135–2140. doi: 10.1021/jf00023a019. [DOI] [Google Scholar]
- Gregory JF. Vitamins. In: Fennema OR, editor. Food chemistry. 3. New York: Marcel Dekker; 1996. pp. 545–546. [Google Scholar]
- HarvestPlus Brief (2006) HarvestPlus: breeding crops for better nutrition. Washington DC, USA
- Howe JA, Tanumihardjo SA. Carotenoid-biofortified maize maintains adequate vitamin a status in Mongolian Gerbils. J Nutr. 2006;136:2562–2567. doi: 10.1093/jn/136.10.2562. [DOI] [PubMed] [Google Scholar]
- Howe JA, Tanumihardjo SA. Evaluation of analytical methods for carotenoids extraction from biofortified maize (Zea mays sp.) J Agric Food Chem. 2006;54:7992–7997. doi: 10.1021/jf062256f. [DOI] [PubMed] [Google Scholar]
- Dietary reference intakes for vitamin C, vitamin E, selenium and carotenoids. Food and nutrition board. Washington: National Academy Press; 2000. [PubMed] [Google Scholar]
- International Institute of Tropical Agriculture (IITA) (2010) New varieties to boost maize output in West and Central Africa. http://www.iita.org/maize/-/asset_publisher/jeR0/content/new-varieties-to-boost-maize. Accessed 22 November 2010
- Johnson LA. Corn: the major cereals of the Americas. In: Kulp K, Ponte JG, editors. Handbook of cereal science and technology. 2. New York: Dekker Inc; 2000. p. 48. [Google Scholar]
- Khachik F, Beecher GR, Goli MB, Lusby WR. Separation and quantification of carotenoids in foods. Methods Enzymol. 1992;213:347–359. doi: 10.1016/0076-6879(92)13136-L. [DOI] [PubMed] [Google Scholar]
- Khachik F, Goli MB, Beecher GR, Holden J, Lusby WR, Tenorio MD, Barrera MR. Effect of food preparation on qualitative and quantitative distribution of major carotenoid constituents of tomatoes and several green vegetables. J Agric Food Chem. 1992;40:390–398. doi: 10.1021/jf00015a006. [DOI] [Google Scholar]
- Kimura M, Kobori CN, Rodriguez-Amaya DB, Nestel P. Screening and HPLC methods for carotenoids in sweetpotato, cassava and maize for plant breeding trials. Food Chem. 2007;100:1734–1746. doi: 10.1016/j.foodchem.2005.10.020. [DOI] [Google Scholar]
- Kurilich AC, Juvik JA. Quantification of carotenoids and tocopherol antioxidants in Zea mays. J Agric Food Chem. 1999;47:1948–1955. doi: 10.1021/jf981029d. [DOI] [PubMed] [Google Scholar]
- Labadarios D, Van Middelkoop AM (1995) The South African vitamin A consultative group. Children aged 6–71 months in South Africa, 1994: their anthropometric, vitamin A, iron and immunisation coverage status. Isando, South Africa [PubMed]
- Labadarios D, Moodie IM, Van Rensburg A (2007) Vitamin A status. In: Labadarios D (ed) National food consumption survey: fortification baseline, chapter 9B. South Africa 2005, Stellenbosch
- Lacker T, Strohschein S, Albert K. Separation and identification of various carotenoids by C30 reversed-phase high-performance liquid chromatography coupled to UV and atmospheric pressure chemical ionization mass spectrometric detection. J Chromatogr. 1999;854:37–44. doi: 10.1016/S0021-9673(99)00584-1. [DOI] [PubMed] [Google Scholar]
- Li S, Tayie FAK, Young MF, Rocheford T, White WS. Retention of provitamin A carotenoids in high β-carotene maize (Zea mays) during traditional African household processing. J Agric Food Chem. 2007;55:10744–10750. doi: 10.1021/jf071815v. [DOI] [PubMed] [Google Scholar]
- Lozano-Alejo N, Carrillo GV, Pixley K, Palacios-Rojas N. Physical properties and carotenoid content of maize kernels and its nixtamalized snacks. Innovat Food Sci Emerg Tech. 2007;8:385–389. doi: 10.1016/j.ifset.2007.03.015. [DOI] [Google Scholar]
- Menkir A, Liu W, White WS, Maziya-Dixon B, Rocheford T. Carotenoid diversity in tropical-adapted yellow maize inbred lines. Food Chem. 2008;109:521–529. doi: 10.1016/j.foodchem.2008.01.002. [DOI] [Google Scholar]
- Murphy EW, Criner PE, Gray BC. Comparisons of methods for calculating retentions of nutrients in cooked foods. J Agric Food Chem. 1975;23:1153–1157. doi: 10.1021/jf60202a021. [DOI] [PubMed] [Google Scholar]
- Muzhingi T, Yeum K-J, Russell RM, Johnson EJ, Qin J, Tang G. Determination of carotenoids in yellow maize, the effects of saponification and food preparations. Int J Vitam Nutr Res. 2008;78:112–120. doi: 10.1024/0300-9831.78.3.112. [DOI] [PubMed] [Google Scholar]
- Nestel P, Bouis HE, Meenakshi JV, Pfeiffer W. Biofortification of staple food crops. J Nutr. 2006;136:1064–1067. doi: 10.1093/jn/136.4.1064. [DOI] [PubMed] [Google Scholar]
- Nuss ET, Tanumihardjo SA. Maize: a paramount staple crop in the context of global nutrition. Compr Rev Food Sci Food Saf. 2010;9:417–436. doi: 10.1111/j.1541-4337.2010.00117.x. [DOI] [PubMed] [Google Scholar]
- Ortiz-Monasterio JI, Palacios-Rojas N, Meng E, Pixley K, Trethowan R, Pena RJ. Enhancing the mineral and vitamin content of wheat and maize through plant breeding. J Cereal Sci. 2007;46:293–307. doi: 10.1016/j.jcs.2007.06.005. [DOI] [Google Scholar]
- Rice AI, West KP, Black RE (2004) Vitamin A deficiency. In: Comparative quantification of health risks. http://www.who.int/publications/cra/chapters/volume1/0211-0256.pdf. Accessed 25 October 2010
- Rodriguez-Amaya DB. Carotenoids and food preparation: the retention of provitamin A carotenoids in prepared, processed, and stored foods. Washington: OMNI/USAID; 1997. [Google Scholar]
- Rodriguez-Amaya DB, Kimura M (2004) HarvestPlus handbook for carotenoid analysis. Technical Monograph Series 2
- Tanumihardjo SA. Food-based approaches for ensuring adequate vitamin A nutrition. Compr Rev Food Sci Food Saf. 2008;7:373–381. [Google Scholar]
- Thomas JB, Kline MC, Gill LM, Yen JH, Duewer DL, Sniegoski LT, Sharpless KE. Preparation and value assignment of standard reference material 968c fat-soluble vitamins, carotenoids, and cholesterol in human serum. Clin Chim Acta. 2001;305:141–155. doi: 10.1016/S0009-8981(00)00429-0. [DOI] [PubMed] [Google Scholar]
- West KP. Extent of vitamin A deficiency among preschool children and women of reproductive age. J Nutr. 2002;132:2857–2866. doi: 10.1093/jn/132.9.2857S. [DOI] [PubMed] [Google Scholar]