

Abstract
Weaning mix was developed using extrudates of plain and malted pearl millet (Pennisetum typhoides) and barley (Hordeum vulgare) flour. Central composite rotatable design (CCRD) with four independent variables PME (pearl millet extrudates), PMME (pearl millet malt extrudates), BE (barley extrudates), BME (barley malt extrudates) at five level and five dependent variables, i.e. lightness, peak viscosity (PV), water solubility index (WSI), water absorption index (WAI) and overall acceptability (OAA) scores, were used to conduct the experiments. Highly acceptable weaning mix was obtained by combining optimized ingredients with constant level of skim milk powder (SMP) 25%, WPC-70 5%, sugar 6% and refined vegetable oil 4 ml 100 g-1 mix. The optimized level of ingredients was PME 20.77%, PMME 7.39%, BE 20.99%, BME 6.53% with 81.3% desirability. The nutrient content of optimized weaning mix was in accordance with the standards specified by PFA, 2004.
Keywords: Weaning, Pearl millet, Barley, Malt, Peak viscosity, Optimization
Introduction
Child under nutrition continues to be a major problem in several low and middle-income countries (Black et al. 2008). Owing to high costs of raw material and lack of proper processing technologies, good quality weaning foods remain out of reach of the general population in such countries. Weaning/complementary foods, introduced to children between the ages of 6 months to 3 years, are liquids and semisolids, which are later replaced by solid foods. In addition to providing adequate nutrition, weaning foods should possess proper functional properties. According to WHO (2003), good quality weaning food must have high nutrient density, low bulk density, low viscosity and appropriate texture along with high energy, protein and micronutrient contents and have a consistency that allows easy consumption.
Extrusion technology is used specifically to produce nutritionally balanced or enriched foods, like weaning foods, dietetic foods, and meat replacers (Plahar et al. 2003). Extrusion cooking is a high-temperature, short-time process that plasticizes and cooks moistened, expansive, starchy and/or protein-rich food materials in a tube by a combination of moisture, pressure, temperature and mechanical shear, resulting in molecular transformation and chemical reactions (Castells et al. 2005). Extrusion cooking also causes substantial viscosity reduction in cereal gruels and enhances its nutrient density (De Muelenaere 1989). Sumathi et al. (2007) developed and evaluated a pearl millet based extrusion cooked supplementary food. Pelembe et al. (2002) developed sorghum cowpea instant porridge by extrusion process.
Several dairy ingredients such as skim milk powder and whey protein concentrate have been a used as ingredients in weaning foods. Kshirsagar et al. (1994) developed weaning foods using ragi, green gram, defatted ground nut and skim milk powder while Ghavidel and Prakash (2010) used germinated, dried and dehulled legumes, green gram, lentil, wheat, rice, carrot and skim milk. Whey proteins, being a source of high quality proteins may be used as nutritional and functional ingredients in weaning foods. Onwulata and Konstance (2002) developed weaning food from extruded taro flour and whey proteins.
Among cereals, millets have tremendous potential as ingredients in weaning foods. Sorghum, pearl millet, and finger millet flours were blended with toasted mung bean flour and nonfat dry milk and extruded to make ready-to-eat weaning foods (Malleshi et al.1996). Pearl millet is a course cereal grain and has equivalent or even superior nutrient content to other cereals (Obilana and Manyasa 2002). It has high levels of calcium, iron, zinc, lipids and high quality proteins. Similarly, barley, a crop of temperate climate, possesses good nutritional attributes such as high protein, mineral and fibre contents. It is rich in beta-gluten that has unique functional characteristics. Both pearl millet and barley have low cost of cultivation. Their nutritional profile of foods can be further enhanced by malting, a low-cost processing technology that improves the physico-chemical, nutritional and functional properties (Pelembe et al. 2003).
Response surface methodology (RSM) is a collection of statistical and mathematical techniques for developing, improving and optimizing product/processes (Myers and Montgomery 2002). This statistical tool has been successfully used in the product/process optimization studies such as sweet potato based pasta (Singh et al. 2004), soy-fortified instant upma mix (Yadav and Sharma, 2008), baking parameters of chapatti (Yadav et al.2008), and natural polymeric enteral feed formula (Vijayakumar and Deepa 2010).
An attempt has been made to optimize a weaning mix made using locally available and low cost as well as nutritious raw materials, pearl millet and barley, in the malted and extruded form.
Materials and methods
Selection of ingredients
Pearl millet (var. PHB-2168) and barley (var. PL-807) grains, grown in the year 2010, were obtained from Punjab Agricultural University, Ludhiana, Punjab, India. Grains were cleaned and destoned using Destoner (Model 6276; Indosaw, Ambala, India) and stored in gunny bags at 10 °C until further use. Skim milk powder (SMP, protein 35.21%, fat 1.51%, minerals 8.31% and carbohydrates 51.5%) and whey protein concentrate (WPC-70) were obtained from National Dairy Research Institute, Karnal, India. Sugar and vegetable oil were procured from the local market. Sugar was ground in a mixer-grinder before use. All the chemicals used for chemical analysis were of analytical grade and obtained from Central Drug House, New Delhi.
Preparation of pearl millet flour
Whole pearl millet grains were soaked in water for 2 h at ambient temperature until the grains attained 30 ± 2% moisture and steamed at 1.05 kg/cm2 for 15 min in order to minimize anti-nutritional factors (Shobhana and Malleshi 2007). They were dried to 15% moisture at 60 °C in a hot air oven. Subsequently, they were pearled in a millet pearler (Mathesis Engineers, Hyderabad, India) with 80% pearling efficiency and milled to flour using pulverizer (Lakshmi Industries, Ludhiana, India). Flour obtained was sieved to obtain 390 μm sized particles using sieve shaker (Indosaw, Ambala, India). Pearl millet flour had proximate composition of moisture 9.1%, protein 11.5%, fat 4.26%, ash 1.34%, fibre 0.8% and carbohydrates 73.0%.
Preparation of barley flour
Whole barley grains were conditioned to 12% moisture by adding calculated amount of water for 2 h and pearled in a millet pearler (Mathesis Engineers, Hyderabad, India) with 75% pearling efficiency. Flour obtained was sieved to obtain 390 μm sized particles using sieve shaker (Indosaw, Ambala, India). Barley flour had moisture 10.46%, protein 11.3%, fat 1.27%, ash 0.9%, and carbohydrates 76.07%.
Preparation of malted flours
Grains of pearl millet and barley were steeped in static water at ambient temperature until they absorbed water. The water was changed every 2 h over a period of 8 h. The barley & millet grains were allowed to germinate in the humidity chamber (125 ECO, Macro Scientific Works Pvt. Ltd., Ambala) at 22 °C and 90% humidity for sprouting (Pelembe et al. 2003). To prevent matting and to even up the growth, the grains were repeatedly turned. The germinated pearl millet and barley grains were dried for 24 h at 50 °C in tray dryer (capacity: 24 trays of size 78 cm x 40 cm., 5 K.W, Indosaw, Ambala). Pearling of malted grains was done in a millet pearler (Mathesis Engineers, Hyderabad, India) for removal of outer covering of grains. Malted and pearled pearl millet and barley grains were reduced to flour (390 μm) in a pulverizer (Lakshmi Industries, Ludhiana).
Extrusion
Raw and malted pearl millet and barley flour were separately conditioned to 18–20% moisture and each extruded using co-rotating twin-screw extruder (7.5 HP motor, 400 V, 50 cycle, L-TSE model, Basic Technologies Private Ltd. Kolkata) with die opening 3.55 mm., screw speed 350 rpm, feeder speed 23 rpm, temperature for extrusion: 130 °C for raw flour and 120 °C for malt. The four types of extrudates thus obtained i.e. pearl millet extrudates (PME), pearl millet malt extrudates (PMME), barley extrudates (BE) and barley malt extrudates (BME) obtained were cooled to room temperature, ground to 180–500 μm size and sealed in separate polyethylene bags until further use.
Experimental design
Response surface methodology was used to optimize the levels of PME, PMME, BE and BME. Based on formulae given in literature (Espinola et al. 1998) and for conformity to PFA (2004) rules, WPC-70, SMP, sugar, and vegetable oil were kept constant at 5%, 25%, 6% and 4 ml/100 g mix, respectively, for each experiment. Formulation of weaning mix was done to match the commercially available product. After preliminary tests, upper and lower levels for these variables were established. A central composite rotatable design (CCRD) (Table 1) was prepared to select variables level i.e. extruded pearl millet and barley: 20–25% each, malted and extruded pearl millet and barley 6–9% each, in each experiment. Experiments were conducted in randomized fashion. For the analysis of experimental design by the response surface, it was assumed that n-mathematical functions, fk (k = 1, 2….. n), Yk in terms of m independent processing factors Xi (i = 1,2, ……………., m) existed for each response variable.
 |
Table 1.
Central composite design arrangement and responses
| Factors | Responses | ||||||||
|---|---|---|---|---|---|---|---|---|---|
| Exp.No. | PME,% | PMME,% | BE,% | BME,% | Lightness | PV, cP | WSI,% | WAI, g/g | OAA |
| 1 | 20.00 | 6.00 | 20.00 | 6.00 | 80.45 | 146.50 | 41.08 | 2.72 | 7.80 |
| 2 | 25.00 | 6.00 | 20.00 | 6.00 | 80.4 | 152.00 | 40.35 | 2.75 | 7.95 |
| 3 | 20.00 | 9.00 | 20.00 | 6.00 | 79.79 | 128.00 | 41.25 | 2.66 | 7.90 |
| 4 | 25.00 | 9.00 | 20.00 | 6.00 | 79.29 | 135.50 | 41.23 | 2.63 | 7.90 |
| 5 | 20.00 | 6.00 | 25.00 | 6.00 | 80.6 | 148.20 | 40.69 | 2.78 | 8.00 |
| 6 | 25.00 | 6.00 | 25.00 | 6.00 | 80.39 | 150.50 | 41.50 | 2.86 | 8.10 |
| 7 | 20.00 | 9.00 | 25.00 | 6.00 | 79.87 | 134.00 | 42.12 | 2.56 | 7.75 |
| 8 | 25.00 | 9.00 | 25.00 | 6.00 | 79.35 | 145.00 | 42.68 | 2.69 | 7.90 |
| 9 | 20.00 | 6.00 | 20.00 | 9.00 | 79.87 | 133.50 | 43.66 | 2.53 | 7.95 |
| 10 | 25.00 | 6.00 | 20.00 | 9.00 | 79.68 | 140.00 | 44.06 | 2.56 | 7.80 |
| 11 | 20.00 | 9.00 | 20.00 | 9.00 | 76.8a | 117.00a | 46.01 | 2.36 | 6.65 |
| 12 | 25.00 | 9.00 | 20.00 | 9.00 | 77.67 | 121.50 | 43.95 | 2.43 | 6.95 |
| 13 | 20.00 | 6.00 | 25.00 | 9.00 | 79.13 | 145.50 | 43.91 | 2.54 | 7.45 |
| 14 | 25.00 | 6.00 | 25.00 | 9.00 | 79.95 | 141.00 | 42.11 | 2.53 | 7.80 |
| 15 | 20.00 | 9.00 | 25.00 | 9.00 | 77.8 | 127.50 | 44.19 | 2.44 | 6.85 |
| 16 | 25.00 | 9.00 | 25.00 | 9.00 | 77.69 | 129.00 | 43.30 | 2.51 | 7.95 |
| 17 | 17.50 | 7.50 | 22.50 | 7.50 | 79.88 | 126.00 | 40.04 | 2.61 | 7.60 |
| 18 | 27.50 | 7.50 | 22.50 | 7.50 | 79.53 | 153.00 | 41.14 | 2.68 | 7.70 |
| 19 | 22.50 | 4.50 | 22.50 | 7.50 | 82.17b | 165.00b | 39.65a | 2.91b | 7.90 |
| 20 | 22.50 | 10.50 | 22.50 | 7.50 | 77.12 | 130.50 | 47.25b | 2.31 | 6.60a |
| 21 | 22.50 | 7.50 | 17.50 | 7.50 | 79.13 | 128.50 | 41.10 | 2.60 | 7.80 |
| 22 | 22.50 | 7.50 | 27.50 | 7.50 | 80.6 | 144.00 | 41.10 | 2.69 | 7.90 |
| 23 | 22.50 | 7.50 | 22.50 | 4.50 | 81.39 | 153.50 | 39.80 | 2.89 | 8.00 |
| 24 | 22.50 | 7.50 | 22.50 | 10.50 | 79.13 | 129.00 | 46.99 | 2.30a | 6.70 |
| 25 | 22.50 | 7.50 | 22.50 | 7.50 | 80.21 | 136.50 | 41.23 | 2.54 | 8.00 |
| 26 | 22.50 | 7.50 | 22.50 | 7.50 | 81.04 | 137.50 | 41.91 | 2.53 | 8.05 |
| 27 | 22.50 | 7.50 | 22.50 | 7.50 | 81.17 | 136.00 | 42.03 | 2.54 | 8.19 |
| 28 | 22.50 | 7.50 | 22.50 | 7.50 | 80.61 | 133.50 | 41.41 | 2.56 | 8.20b |
| 29 | 22.50 | 7.50 | 22.50 | 7.50 | 80.79 | 133.50 | 41.68 | 2.52 | 8.10 |
| 30 | 22.50 | 7.50 | 22.50 | 7.50 | 80.41 | 134.50 | 41.19 | 2.60 | 7.95 |
| 31 | 22.50 | 7.50 | 22.50 | 7.50 | 80.35 | 136.50 | 41.38 | 2.58 | 8.15 |
| 32 | 22.50 | 7.50 | 22.50 | 7.50 | 81 | 137.00 | 42.82 | 2.58 | 7.90 |
aMinimum, bMaximum, PME Pearl millet extrudates, PMME Pearl millet malt extrudates, BE barley extrudates, BME Barley malt extrudates, PV Peak viscosity, WSI Water solubility index, WAI Water absorption index, OAA Overall acceptability
In this case, n = 5, m = 4
Full second-order equation was fitted in each response to describe it mathematically and to study the effect of variables. The equation was as follows:
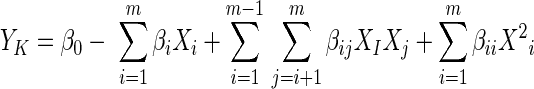 |
where, Yk = response variable, β0 is the value of the fitted response at the centre point of the design i.e. (0,0) and βi, βij, βii are the linear, quadratic and interactive regression coefficients, respectively. Xi and Xj are the coded independent variable.
Peak Viscosity (PV)
The PV of weaning mix was evaluated by Rapid Visco Analyser (RVA™), operated with Themocline 3.0 for Windows (TCW) software. In RVA, the short temperature profile (13 min) was used and the mixture was stirred at 960 rpm for l0 s and then at 160 rpm for the remainder of the test. A mixture of 3.0 g extrudate powder and 30.0 ml water was held at 50 °C for 1 min and subsequently, heated to 95 °C at 12.2 °C/min. Holding time at 95 °C was 2.5 min, subsequently the sample was cooled to 50 °C at 1.2 °C/min, where it was kept for 2.1 min (Deffenbaugh and Walker 1990).
Colour
The colour values of weaning mix, in terms of L (lightness), was measured using HunterLab LabScan XE (Hunter Associates Laboratory Inc., Reston, Virginia, USA) (NR-3000; 10°/D65). Colour values were recorded as L (0 = black, 100 = white)
Water Solubility Index (WSI) and Water Absorption Index (WAI)
WSI and WAI were determined according to the method developed for cereals (Anderson et al. 1969; Yagci and Gogus 2008). The ground weaning mix was suspended in water at room temperature for 30 min, gently stirred during this period, and then centrifuged at 3,000 g for 15 min by refrigerated centrifuge. The supernatants were decanted into an evaporating dish of known weight. The WSI was the weight of dry solids in the supernatant expressed as a percentage of the original weight of sample. The WAI was the weight of gel obtained after removal of the supernatant per unit weight of original dry solids. Water solubility index (WSI) and water absorption index (WAI) were expressed as follows:-
 |
 |
Sensory analysis
Weaning mix (25 g) was mixed with 60 ml of lukewarm water (70 °C) (Thathola and Srivastava 2002) and served in numbered plates to a semi-trained panel of judges (ten) selected from the Institute staff. Four samples were presented at a time to the judges at separate booth and asked to rate the samples in terms of taste, mouth feel and overall acceptability (OAA) using nine point hedonic scale (Larmond 1977) from liked extremely (9) to disliked extremely (1).
Chemical analysis
The raw pearl millet and barley grains and weaning mix were analysed for moisture (method 44–19), protein (method 46–12), fat (method 30–25) and ash (method 8–01) using AACC (2000) methods. Carbohydrate was calculated by subtracting the sum of moisture, protein, fat and ash from 100 (Merrill and Watt 1973). Calcium, iron and phosphorus contents of the weaning mix were also analyzed using AOAC (1995) procedures.
Statistical analysis
Response surface methodology (RSM) was adopted in experimental design and analysis (Khuri and Cornell 1987). Data were modelled by multiple regression analysis and statistical significance of the terms was examined by analysis of variance for each response. Maximization and minimization of the polynomials thus fitted was done by numeric techniques, using the numerical optimization technique given in the software package (Design expert (r) software version 8.0.4.1, 2010; Minneapolis, MN, USA).
Results and discussion
Diagnostic checking of the fitted models
The responses obtained from each set of designed experiments were fitted in to the general form of quadratic polynomial model (Equation 2). This model incorporated the individual linear, quadratic and interactive influences of the experimental variables on the measured response. Response fit analyses, regression coefficient estimations and model significance evaluations were conducted. The estimated regression coefficients of the fitted quadratic equation as well as the correlation coefficients for each model are given in Table 2. The adequacy of the models was tested using F-ratio and coefficient of determination (R2). The models were considered adequate when the calculated value was more than the table one and R2 was more than 80%. (Henika 1982). The R2 values for the responses i.e. lightness, PV, WSI, WAI and OAA were 89.04, 92.01, 82.31 88.87 and 86.21%, respectively, indicating that the models have satisfactory adequacy in fitting the experimental data. The calculated F-values were more than the table value (2.4) for all the responses indicating that the models were significant. Thus, all the five responses were considered adequate to describe the effect of variables on the quality of weaning mix.
Table 2.
Estimated coefficients of the fitted quadratic equation for different response
| Estimated coefficients | |||||
|---|---|---|---|---|---|
| Factors | Lightness | PV, cP | WSI,% | WAI, g/g | OAA |
| β0 | 22.89 | 205.16 | 5.28 | 7.69 | 6.88 |
| β1 | 2.24 | 2.85** | 1.89 | −0.16 | 0.01 |
| β2 | −2.52** | −31.96** | −2.73** | −0.18** | 0.64** |
| β3 | 2.06 | 3.63** | 1.04 | −0.16 | −0.29 |
| β4 | 0.89** | −5.35** | 2.17** | −0.13** | 0.68** |
| β12 | −0.01 | 0.25 | −0.02 | 0.002 | 0.02 |
| β13 | −0.002 | −0.14 | 0.01 | 0.002 | 0.01 |
| β 14 | 0.04 | −0.31 | −0.08 | 0.0008 | 0.02 |
| β23 | 0.02 | 0.34 | 0.01 | 0.0005 | 0.02 |
| β24 | −0.14* | −0.29 | 0.001 | 0.004 | −0.06* |
| β34 | 0.005 | 0.26 | −0.12 | 0.0002 | 0.008 |
| β11 | −0.05** | 0.05 | −0.03 | 0.003 | −0.01 |
| β22 | −0.16** | 1.05** | 0.23* | 0.004 | −0.08** |
| β33 | −0.05** | −0.08 | −0.01 | 0.003 | −0.005 |
| β44 | −0.09 | 0.33 | 0.22* | 0.002 | −0.07** |
| R2,% | 89.04 | 92.01 | 82.31 | 88.87 | 86.21 |
** Significant at p ≤ 0.01, *Significant at p ≤ 0.05, PV Peak viscosity, WSI Water solubility index, WAI Water absorption index, OAA Overall acceptability
Effect of variables on lightness
The observed lightness (hunter L value) of the weaning mix, with different combinations of the ingredients (Table 1), varied between 76.8 and 82.17 within the combination of variables studied. Maximum lightness of the weaning mix was observed at experiment number 19 with PME and BE each at 22.5% and PMME and BME at 4.5 and 7.5%, respectively. This shows that lightness had a higher value at low malt level. Table 2 reveals that negative coefficient of linear term of PMME and positive coefficient of linear term of BME significantly (p ≤ 0.01) affected the lightness of the weaning food. Interaction of PMME and BME had a significant (p ≤ 0.05) negative effect on the lightness. At the quadratic level, PME, PMME and BE had a highly significant (p ≤ 0.01) negative effect on the lightness of the weaning mix. The three dimensional response plots (Fig. 1a) further depicts the effect of the independent variables on the lightness of the weaning mix. The characteristic dark colour of the malts may have lead to fall in hunter L values. This reduction in lightness may be attributed to the change in the colour from the characteristic grey of pearl millet grain to the light brown (tan) of the pearl millet malt. This occurs because of changes in colour of phenolic pigments in the pearl millet during malting process (Pelembe et al. 2003).
Fig. 1.

Response surface plots showing effect of pearl millet and barley malt extrudates on a lightness, b PV (peak viscosity) and c OAA (overall acceptability) of weaning mix. PME Pearl millet extrudates, PMME Pearl millet malt extrudates
Effect of variables on PV
The experiment number 19 (PME 22.5%, PMME 4.5%, BE 22.5% and BME 7.5%) recorded maximum PV of 165 cP and lowest value of 117 cP was recorded for experiment number 11 (PME 20.0%, PMME 9.0, BE 20.0% and BME 9.0%). Table 2 depicts that each of the independent variables had a highly significant (p ≤ 0.01) effect on the PV of the weaning mix at the linear level. PMME and BME had negative linear effect. However, PMME showed significantly (p ≤ 0.01) positive quadratic effect. Figure 1(b) depicts the effect of independent variables on the PV of the weaning mix. The results clearly suggest that the malt significantly (p ≤ 0.05) lowered viscosity. Reduction in viscosity due addition of sorghum malt in pearl millet-cowpea weaning food was reported by Almeida-Dominguez et al. (1993). Lower viscosity is preferred in weaning foods for consumption by infants due to their limited stomach capacity and the ability to chew (Pelembe et al. 2002). Moreover by using liquefying malt on a cereal paste of high solids concentration, nutrient density could be increased without increasing the product viscosity (Malleshi et al. 1989).
Effect of variables on WSI and WAI
Water solubility index (WSI) determines the amount of free polysaccharide or polysaccharide released from the granule on addition of excess water. A high WSI indicated that starch underwent extensive conversion. The observed WSI with different combinations of the ingredients (Table 1) varied between 39.65% and 47.25%. Table 2 depicts that negative linear coefficients of PMME had highly significant (p ≤ 0.01) effect on WSI. However, for BME, linear coefficients had highly significant (p ≤ 0.01) positive effect. At quadratic level, both PMME and BME had highly (p ≤ 0.05) positive effect on WSI. Thus, results clearly suggest that samples having higher malt fraction had a higher WSI as compared to those having lesser malt. Increase in WSI due to malting in pearl millet was also reported by Pelembe et al. (2003). This may have occurred as more soluble materials such as amylase, amylopectin and amino acids got released during malting. This may be attributed to the enzymatic breakdown of materials, particularly storage components such as starch and proteins within the grain during germination, into smaller, soluble and more usable forms for the growing grain (Parvathy and Sadasivam 1982 and Ashworth and Draper 1992).
The observed WAI with different combinations of the ingredients (Table 1) varied between 2.3 and 2.91 g/g, respectively within the combination of variables studied. WAI shows a maximum level at a certain amount of starch conversion. This maximum is when the starch granules are sufficiently damaged for these to imbibe water without disintegration (Mitchell et al. 1997). PMME and BME had highly significant (p ≤ 0.01) negative linear effect on the WAI (Table 2). Reduction in WAI due to malting in pearl millet has also been reported by Pelembe et al. (2003). Lower water absorption in weaning foods was also advocated by Mahgoub (1999) in order to produce a more nutritious and suitable weaning food. This in turn may be achieved by reducing the viscosity of the starchy components by malting (Malleshi and Desikachar (1981).
Effect of variables on overall acceptability
Overall acceptability of weaning mix was rated between 6.6 and 8.2 by the sensory evaluation panel (Table 1). The positive coefficient of the first order terms of PMME and BME (Table 2) indicated highly significant (p ≤ 0.01) positive effect on OAA. However, the interaction terms showed significant (p ≤ 0.05) negative effect. The negative quadratic coefficients of PMME and BME caused highly significant (p ≤ 0.01) effect on OAA. Figure 1(c) depicts the relationship between PMME, BME and OAA. This revealed that malt, both in the form of PMME and BME had significant effect on OAA of the weaning mix. This was probably because of the effect of malts on the lightness of the weaning mix. The slightly bitter taste of the malt containing samples may have also resulted in lower overall acceptability scores of the samples with higher malt levels. However, at lower level, malt flavor was highly acceptable. Wambugu et al. (2003) explained that it was important to strike a balance between the positive and negative effects of malt in weaning food. Pelembe et al. (2003) also advocated the use of malting in pearl millet to improve palatability and utilization of pearl millet.
Analysis of variance
After selecting the model, analysis of variance was calculated (Table 3) to assess how well the responses represented the data. F-value for all the responses i.e. lightness, PV, WSI, WAI and OAA was highly significant (p ≤ 0.01) (Table 3). Consequently, it can be derived that the selected models adequately represented the data for lightness, PV, WSI, WAI and OAA.
Table 3.
Analysis of variance for different models
| Response | Sources of variance | d.f. | Sum of squares | Mean square | F-value |
|---|---|---|---|---|---|
| Lightness | Model | 14 | 43.62 | 3.12 | 9.86** |
| Residual | 17 | 5.37 | 0.32 | ||
| Cor.Total | 31 | 48.99 | |||
| PV | Model | 14 | 3088.56 | 220.61 | 13.99** |
| Residual | 17 | 268.04 | 15.77 | ||
| Cor.Total | 31 | 3356.59 | |||
| WSI | Model | 14 | 93.48 | 6.68 | 5.65** |
| Residual | 17 | 20.08 | 1.18 | ||
| Cor.Total | 31 | 113.56 | |||
| WAI | Model | 14 | 0.60 | 0.043 | 9.69** |
| Residual | 17 | 0.075 | 0.004 | ||
| Cor.Total | 31 | 0.67 | |||
| OAA | Model | 14 | 5.67 | 0.40 | 7.59** |
| Residual | 17 | 0.91 | 0.05 | ||
| Cor.Total | 31 | 6.57 |
**Significant at P ≤ 0.01, PV Peak viscosity, WSI Water solubility index, WAI Water absorption index, OAA Overall acceptability
Optimization of the level of independent variables
Optimization of the level of variables was done by selecting the responses i.e. lightness, PV, WSI, WAI and OAA. On the basis that the responses had direct effect on the quality and acceptability of the weaning mix as shown by their respective R2 values, numerical as well as graphical optimization was done. Table 4 shows the criteria used, upper and lower limit, predicted and actual values of the responses. The importance of level 3 was given to the constraints of lightness, PV, WSI and WAI and OAA. The overlay contour plot (Fig. 2) was drawn keeping PME and BE constant (at optimum level obtained by numerical optimization) and the optimized values were PME 20.77%, PMME 7.39%, BE 20.99%, BME 6.53% each keeping a constant level of skim milk powder 25%, WPC-70 5%, sugar 6% and refined vegetable oil 4 ml/100 g) with 81.3% desirability. Weaning mix was prepared using the recommended level of ingredients and the responses were measured. The measured responses had proximity to the predicted ones reconfirming the adequacy of the models.
Table 4.
Constraints, criteria for optimization, solution along with predicted and actual response values.
| Constraints | Goal | Lower limit | Upper limit | Predicted values | Actual response values |
|---|---|---|---|---|---|
| PME,% | is in range | 20.00 | 25.00 | 20.77 | - |
| PMME,% | is in range | 6.00 | 9.00 | 7.39 | - |
| BE,% | is in range | 20.00 | 525.00 | 20.99 | - |
| BME,% | is in range | 6.00 | 9.00 | 6.53 | - |
| Lightness | maximize | 76.80 | 82.17 | 80.82 | 80.10 ± 0.15 |
| PV, cP | is target = 125 | 117.00 | 165.00 | 135.18 | 133.5 ± 2.5 |
| WSI,% | is in range | 39.65 | 47.25 | 40.58 | 41.20 ± 0.35 |
| WAI, g/g) | is in range | 2.30 | 2.91 | 2.64 | 2.63 ± 0.02 |
| OAA | Maximize | 6.60 | 8.20 | 8.14 | 8.2 ± 0.05 |
PME Pearl millet extrudates, PMME Pearl millet malt extrudates, BE Barley extrudates, BME Barley malt extrudates, PV Peak viscosity, WSI Water solubility index, WAI Water absorption index, OAA Overall acceptability
Fig. 2.

Overlay plot showing the level of ingredients and the corresponding response values. PME Pearl millet extrudates, PMME Pearl millet malt extrudates
The proximate composition of weaning mix was moisture 4.59%, protein 14.73%, fat 9.88%, minerals 2.85%, carbohydrates 67.95%, Ca 354 mg 100 g-1, P 251.2 mg 100 g1, Fe 5.92 mg 100 g-1 and was in agreement with the PFA (2004) guidelines for milk cereal based weaning foods.
Conclusion
Weaning mix was prepared from malted and extruded pearl millet and barley flours and successfully optimized using response surface methodology. From the study, it may be concluded that locally available low cost ingredients available in the developing countries have a great potential in developing highly nutritious and acceptable weaning foods. Addition of malt in weaning food improved functional and nutritional qualities. Such a protein and energy dense weaning food would help in eradication of malnutrition in children. Such products would also promote utilization of pearl millet and barley which are slowly losing importance to wheat and rice.
Acknowledgement
The authors thankfully acknowledge the financial support from the World Bank for this work which is part of the NAIP project “A value chain on composite dairy foods with enhanced health attributes.”
References
- Approved methods of the AACC. 10. St. Paul: American Association of Cereal Chemists; 2000. [Google Scholar]
- Almeida-Dominguez HD, Gomez MH, Serna-Saldivar SO, Waniska RD, Rooney LR, Lusas EW. Extrusion cooking of pearl millet for production of millet-cowpea weaning foods. Cereal Chem. 1993;70:214–219. [Google Scholar]
- Anderson RA, Conway HF, Pfeifer VF, Griffin EJ. Roll and extrusion cooking of grain sorghum grits. Cereal Sci Today. 1969;14:372–376. [Google Scholar]
- Official methods of analysis. 16. Arlington: Association of Official Analytical Chemists; 1995. [Google Scholar]
- Ashworth A, Draper A (1992) The potential of traditional technologies for increasing the energy density of weaning foods. A critical review of existing knowledge with particular reference to malting and fermentation. WHO/CCD/EDP 92.4. Centre for Human Nutrition, London, UK, pp 1–50
- Black RE, Allen LH, Bhutta ZA. Maternal and child undernutrition: global and regional exposures and health consequences. Lancet. 2008;371:243–260. doi: 10.1016/S0140-6736(07)61690-0. [DOI] [PubMed] [Google Scholar]
- Castells M, Marin S, Sanchis V, Ramos AJ. Fate of mycotoxins in cereals during extrusion cooking: a review. Food Addit Contam. 2005;22:150–157. doi: 10.1080/02652030500037969. [DOI] [PubMed] [Google Scholar]
- De Muelenaere HJH (1989) Extrusion: A first and third world tool. In:Technology and the Consumer, Vol 1. Proceedings of the SAAFoST Tenth Biennial Congress and a Cereal Science Symposium. Natal Tecknikon Printers, Durban, South Africa, pp 22–42
- Deffenbaugh LB, Walker CE. Use of the rapid visco-analyzer to measure starch pasting properties. Part II: Effects of emulsifiers and sugar emulsifier interactions. Starke. 1990;42:89–95. doi: 10.1002/star.19900420304. [DOI] [Google Scholar]
- Espinola N, Creed-Kanashiro H, Ugaz ME, van Hal M (1998) Development of a food supplement with sweet potato for children from 6 months to 3 years. Department of Social Sciences Working Paper 1998–8. International Potato Center (CIP), Lima, Peru
- Ghavidel RA, Prakash J. Composite weaning mixes: formulation and quality characteristics. Food Sci Technol Res. 2010;16:65–70. doi: 10.3136/fstr.16.65. [DOI] [Google Scholar]
- Henika RG. Use of response surface methodology in sensory evaluation. Food Technol. 1982;36(11):96–101. [Google Scholar]
- Khuri AI, Cornell JA. Response surfaces: design and analysis. Marcel Dekker: New York; 1987. pp. 127–145. [Google Scholar]
- Kshirsagar RB, Pawar VD, Upadhye VP, Pawar VS, Devi R. Studies on formulation and evaluation of weaning food based on locally available foods. Int J Food Sci Nutr. 1994;31:211–214. [Google Scholar]
- Larmond E (1977) Laboratory methods for sensory evaluation of foods. Publication No. 1637, Department of Agriculture, Ottawa, pp 17–22
- Mahgoub SEO. Production and evaluation of weaning foods based on sorghum and legumes. Plants Foods Hum Nutr. 1999;54:29–42. doi: 10.1023/A:1008151614247. [DOI] [PubMed] [Google Scholar]
- Malleshi NG, Desikachar HSR. Studies on suitability of roller flour mill, hammer mill and plate grinder for obtaining a refined flour from malted ragi. J Food Sci Technol. 1981;18:37–39. [Google Scholar]
- Malleshi NG, Daodu MA, Chandrasekhar A. Development of weaning food formulations based on malting and roller drying of sorghum and cowpea. Int J Food Sci Technol. 1989;24:511–519. doi: 10.1111/j.1365-2621.1989.tb00674.x. [DOI] [Google Scholar]
- Malleshi NG, Hadimani NA, Chinnaswamy R, Klopfenstein CF. Physical and nutritional qualities of extruded weaning foods containing sorghum, pearl millet, or finger millet blended with mung beans and nonfat dried milk. Plant Foods Hum Nutr. 1996;49:181–189. doi: 10.1007/BF01093214. [DOI] [PubMed] [Google Scholar]
- Merrill AL, Watt BK (1973) Energy value of foods: basis and derivation. In: Agriculture Handbook No. 74, United States Department of Agriculture, Washington, pp 2–4
- Mitchell JR, Hill SE, Paterson LA, Vallès-Pàmies B, Barclay F, Blanshard JMV, et al. The role of molecular weight in the conversion of starch. In: Frazier, et al., editors. Starch: structure and functionality. Cambridge: The Royal Society of Chemistry; 1997. pp. 68–76. [Google Scholar]
- Myers RH, Montgomery DC. Response surface methodology. New York: Wiley-Interscience; 2002. [Google Scholar]
- Obilana A, Manyasa E. Millets. In: Belton PS, Taylor JRN, editors. Pseudocereals and less common cereals. Berlin, JRN: Springer; 2002. pp. 177–214. [Google Scholar]
- Onwulata CI, Konstance RP. Viscous properties of taro flour extruded with whey proteins to simulate weaning foods. J Food Process Pres. 2002;26:179–194. doi: 10.1111/j.1745-4549.2002.tb00479.x. [DOI] [Google Scholar]
- Parvathy K, Sadasivam S. Comparison of amylase activity and carbohydrate profile in germinating seeds of Sertaria italica, Echinochloa frumentacea, and Panicum miliaceum. Cereal Chem. 1982;9:543–544. [Google Scholar]
- Pelembe LAM, Erasmus C, Taylor JRN. Development of protein-rich composite sorghum-cowpea instant porridge by extrusion cooking process. Lebensm Wiss Technol. 2002;35:120–127. doi: 10.1006/fstl.2001.0812. [DOI] [Google Scholar]
- Pelembe LAM, Dewar J, Taylor JRN (2003) Food products from malted pearl millet. http://www.afripro.org.uk accessed on 20/05/03
- PFA (2004) The Prevention of Food Adulteration Act & Rules (as on 1.10.2004) dbtbiosafety.nic.in accessed on 19/05/11
- Plahar WA, Onuma Okezie B, Gyato CK. Development of a high protein weaning food by extrusion cooking using peanuts, maize and soybeans. Plant Food Hum. Nutr. 2003;58:1–12. [Google Scholar]
- Shobhana S, Malleshi NG. Preparation and functional properties of decorticated finger millet (Eleucine coracana) J Food Eng. 2007;79:529–538. doi: 10.1016/j.jfoodeng.2006.01.076. [DOI] [Google Scholar]
- Singh S, Raina CS, Bawa AS, Saxena DC. Sweet potato based pasta product: optimization of ingredient levels using response surface methodology. Int J Food Sci Tech. 2004;39:191–200. doi: 10.1046/j.0950-5423.2003.00764.x. [DOI] [Google Scholar]
- Sumathi A, Ushakumari SR, Malleshi NG. Physico-chemical characteristics, nutritional quality and shelf-life of pearl millet based extrusion cooked supplementary foods. Int J Food Sci Nutr. 2007;58:350–362. doi: 10.1080/09637480701252187. [DOI] [PubMed] [Google Scholar]
- Thathola A, Srivastava S. Physicochemical properties and nutritional traits of millet-based weaning food suitable for infants of the Kumaon hills, Northern India. Asia Pacific J Clin Nutr. 2002;11:28–32. doi: 10.1046/j.1440-6047.2002.00251.x. [DOI] [PubMed] [Google Scholar]
- Vijayakumar PT, Deepa M. Optimization of natural polymeric enteral feed formula using response surface methodology. Asian J Sci Technol. 2010;2:39–43. [Google Scholar]
- Wambugu SM, Taylor JRN, Dewar J (2003) Effect of addition of malted and fermented sorghum flours on proximate composition, viscosity, pH and consumer acceptability of extruded sorghum weaning porridges. http://www.afripro.org.uk accessed on 20/05/03
- WHO (2003) Feeding and nutrition of infants and young children: Guidelines for the WHO European region with emphasis on the former Soviet Union. WHO Regional Publications, European Series, No 87, pp 296
- Yadav DN, Sharma GK. Optimization of soy-fortified instant upma mix ingredients using response surface methodology. J Food Sci Technol. 2008;45:56–60. [Google Scholar]
- Yadav DN, Patki PE, Mahesh C, Sharma GK, Bawa AS. Optimization of baking parameters of chapati with respect to vitamin B1 and B2 retention and quality. Int J Food Sci Tech. 2008;43:1474–1483. doi: 10.1111/j.1365-2621.2008.01712.x. [DOI] [Google Scholar]
- Yagci S, Gogus F. Response surface methodology for evaluation of physical and functional properties of exruded snack foods developed from food-by-products. J Food Eng. 2008;86:122–132. doi: 10.1016/j.jfoodeng.2007.09.018. [DOI] [Google Scholar]