Abstract
Because of its role in multiple central nervous system (CNS) pathways, metabotropic glutamate receptor type 1 (mGluR1) is a crucial target in the development of pharmaceuticals for CNS disorders. N-[4-[6-(isopropylamino)-pyrimidin-4-yl]-1,3-thiazol-2-yl]-N-methyl-4-[11C]-methylbenzamide ([11C]ITDM) was recently developed as a positron emission tomography (PET) ligand for mGluR1. To devise a method for measurement of the binding potential (BPND) of [11C]ITDM to mGluR1, reference tissue methods aimed at replacing measurement of the arterial input function are desirable. In this study, we evaluated a noninvasive quantification method of mGluR1 with [11C]ITDM, demonstrating its accuracy using Huntington disease model R6/2 mice. The BPND measurements based on the Logan reference (Logan Ref) method have closely approximated that based on the arterial input method. We performed PET analysis with Logan Ref to assess its accuracy in quantifying the decline of mGluR1 expression in R6/2 mice. Significant decreases in BPND values in R6/2 mice were detected in cerebellum, thalamus, striatum, and cingulate cortex. We compared autoradiographs of R6/2 mouse brain sections with immunohistochemical images, and found a close correlation between changes in radioactive signal intensity and degree of mGluR1 expression. In conclusion, [11C]ITDM-PET is a promising tool for in vivo quantification of mGluR1 expression.
Keywords: BPND, [11C]ITDM, Huntington disease, mGluR1, positron emission tomography, R6/2
Introduction
Glutamate is the predominant excitatory neurotransmitter in the central nervous system (CNS) and exerts multiple effects on neuronal excitability and synaptic transmission by directly or indirectly interacting with iontropic and metabotropic receptors.
Metabotropic glutamate receptors are members of the G protein-coupled receptor super family,1 including eight subtypes divided into three groups based on sequence homology, intracellular transduction pathways, and pharmacological properties.2 Metabotropic glutamate receptor type 1 (mGluR1) and type 5 (mGluR5) belonging to group I are postsynaptically located and positively coupled to Gq proteins, stimulating polyphosphoinositide hydrolysis via the formation of inositol 1,4,5-triphosphate and diacylglycerol. This signaling promotes intracellular calcium release, finally activating protein kinase C.3, 4, 5 Thus, mGluR1 and mGluR5 can trigger signaling cascades and modulate the activity of ion- and ligand-gated channels via functional coupling with transduction pathways. Although mGluR1 and mGluR5 are highly homologous in structure, each has distinct distribution, tasks, and levels of expression in the CNS.6, 7, 8, 9, 10
Several studies on CNS disorders have reported that the group I receptors were unbalanced in different situations. In the ischemic rat brain model, treatment with an mGluR1 antagonist showed protection against neuronal death,11, 12 but treatment with an mGluR5 antagonist showed no effect.13 Further, a Huntington's disease (HD) model mouse shows a distinct decline in mGluR1 but not in mGluR5.14 Additional findings also support the concept that CNS disorders are often associated with disruption of group I receptors. Owing to these findings, in vivo monitoring of group I receptors would help to elucidate their roles in the mechanisms of CNS disorders.
Positron emission tomography (PET) allows the use of pharmaceuticals bound to positron-emitting radiotracers (e.g., 18F and 11C) for the acquisition of molecular information in vivo. For acquisition of data on mGluR5, 3-(6-methyl-pyridin-2-ylethynyl)-cyclohex-2-enone-O-[11C]methyl-oxime ([11C]ABP688) has been developed as a selective mGluR5 PET ligand,15 progressing to clinical use for in vivo quantification of mGluR5 expression.16, 17 Recently, N-[4-[6-(isopropylamino)-pyrimidin-4-yl]-1,3-thiazol-2-yl]-N-methyl-4-[11C]-methylbenzamide ([11C]ITDM) has been developed as a promising PET ligand for mGluR1.18 The [11C]ITDM-PET has shown a distribution pattern closely corresponding to the biologic distribution of mGluR1 in rats and monkeys. The area under the curve of [11C]ITDM in the pons, a region of negligible mGluR1 expression,8 is very close to that of the fully-blocked brain, suggesting that the pons may be a useful reference region to substitute for arterial blood sampling for quantitative PET analysis.18
In this study, we performed PET assessments with the following objectives:
To validate the use of a reference region for in vivo quantitative measurement of mGluR1 in the brains of Sprague-Dawley (SD) rats with [11C]ITDM-PET.
To visualize and quantify [11C]ITDM binding to mGluR1 using PET with the noninvasive reference region method in the brains of HD transgenic mice as an mGluR1-deficient model.
To verify the quantitative accuracy of [11C]ITDM binding to mGluR1 in mouse brain regions by comparing with in vitro techniques.
Materials and methods
General
All experiments were approved by the committee of National Institute of Radiological Sciences.
The [11C]ITDM was synthesized from stannyl precursor with [11C]methyl iodide in the presence of triphenylphosphine and copper chloride as described previously.18 At the end of synthesis, 1.2 to 1.6 GBq of [11C]ITDM was obtained with >99% radiochemical purity and 111 to 170 GBq/μmol specific activity for animal experiments.
We synthesized 4-fluoro-N-[4-[6-(isopropylamino)pyrimidin-4-yl]-1,3-thiazol-2-yl]-N-methylbenzamide (FITM),19 a selective antagonist of mGluR1, in our laboratory and dissolved it in saline containing 20% ethanol and 10% polyoxyethylene sorbitan monooleate (Tween-80), and used it for in vivo studies.
Sprague-Dawley rats (Japan SLC, Shizuoka, Japan), transgenic mice (R6/2) carrying the human HD gene, and noncarrier mice (C57BL/6j) (both from The Jackson Laboratory, Bar Harbor, ME, USA) were kept in a temperature-controlled environment with a 12-hour light/dark cycle, and were given a standard diet (MB-1/Funabashi Farm, Chiba, Japan). Animal experiments were performed according to the recommendations of the Committee for the Care and Use of Laboratory Animals in National Institute of Radiological Sciences.
Positron emission tomography procedures
To develop an optimal quantitative method, brain PET examinations with [11C]ITDM were performed on SD rats (n=4, male, 8 weeks, 250 to 280 g). Before PET scanning, each rat had a polyethylene catheter (FR2/Imamura, Tokyo, Japan) inserted into the left femoral artery for blood sampling. For the blocking study, SD rats (n=4, male, 8 weeks, 220 to 285 g) were pretreated with 1 mg/kg FITM. Subsequently, all the animals were anesthetized (1.5% to 2% isoflurane in air) and placed in a small-animal PET scanner (Inveon/Siemens, Knoxville TN, USA). After a transmission scan for attenuation correction using a 57Co source for 803 seconds, a bolus of [11C]ITDM (37 to 50 MBq, 0.5 to 1.0 pmol in 0.1 to 0.5 mL saline) was injected into the tail vein via a 24-gauge catheter (Terumo Medical Products, Tokyo, Japan). Dynamic emission scans in a three-dimensional list mode were acquired for 90 minutes (10 seconds × 6 frames, 15 seconds × 4 frames, 1 minute × 5 frames, 2 minutes × 4 frames, and 5 minutes × 15 frames). Positron emission tomography dynamic images were reconstructed with filtered back projection using a Hanning filter with a Nyquist cutoff of 0.5 cycle/pixel.
Blood sampling
Arterial blood (50 μL to 1.0 mL: total 2 mL) was sampled at 10, 20, 30, 40, and 50 seconds, and 1, 2, 3, 4, 5, 10, 15, 30, 60, and 90 minutes after the injection. The radioactivity in whole blood and plasma was counted using a 1480 Wizard autogamma scintillation counter (Perkin-Elmer, Waltham, MA, USA). Radioactivity was corrected for decay. Blood samples (0.1 to 1.0 mL) at selected time points (1, 5, 15, 30, 60, and 90 minutes) were centrifuged at 13,000 g for 3 minutes at 4°C to separate the plasma. The supernatant (20 μL to 0.5 mL) was then collected in a test tube containing an equivalent volume of acetonitrile (MeCN), and the resulting mixture was vortexed for 15 seconds and centrifuged at 20,000 g for 2 minutes for deproteinization. An aliquot of the supernatant obtained from the plasma was injected into a radio-high-performance liquid chromatography (HPLC) system (Shimadzu, Kyoto, Japan) equipped with a radioactivity detector,20 and analyzed using a Capcell Pack (Shiseido, Tokyo, Japan) C18 column (4.6 mm i.d. × 250 mm) with MeCN/H2O/Et3N (7/3/0.01, v/v/v) at 1.0 mL/min. The percentage of [11C]ITDM (retention time=7.1 minutes) to total radioactivity (corrected for decay) on the HPLC chromatogram was calculated as %=(peak area of [11C]ITDM/total peak area) × 100. A metabolite-corrected plasma curve was generated by the product of the plasma activity and unmetabolized [11C]ITDM fraction.
Data analysis
Summed PET images between 0 and 90 minutes after the injection of [11C]ITDM were reconstructed using ASIPro VM (Analysis Tools and System Setup-Diagnostics Tool/Siemens, Knoxville, TN, USA). Volumes of interest (VOIs) were manually drawn on the summed PET images for cerebellum, thalamus, a part of hippocampus (CA3), whole striatum, cingulate cortex, and pons by referencing magnetic resonance imaging (MRI) templates of rat brain.21 The respective sizes of VOIs for the rat brain were 118.8 mm3 for the cerebellum, 70.3 mm3 for the thalamus, 19.3 mm3 for a part of hippocampus (CA3), 42.3 mm3 for the whole striatum, 9.3 mm3 for the cingulate cortex, and 34.3 mm3 for the pons. The respective tissue time-activity curves (tTACs) were then derived from each VOI on the dynamic PET images. The radioactivity was decay corrected to the injection time and was expressed as a standardized uptake value (SUV), which was normalized to the injected radioactivity and body weight.
 |
Kinetic analysis
Kinetic analysis with arterial blood sampling was performed using the two-tissue compartment model (2-TCM)22 and Logan graphical analysis (Logan GA)23 using the metabolite-corrected plasma curve as an input function. In the 2-TCM, four rate constants (K1–k4) were estimated by nonlinear-least-squares fitting, and the total distribution volume (VT) for each region was calculated:
The blood volume fraction (vB) in the rat brain was fixed at 2%24 and corrected using the time course of radioactivity concentration in the blood. Meanwhile, in the Logan GA, VT of each region was estimated as the slope of a regression line using points between 15 and 90 minutes under the equilibrium state. In both methods, with the pons (where mGluR1 concentration is negligible) as a reference region, the BPND of each target region was calculated as:
Next, the BPND values of the target regions were derived by a simplified reference tissue model (SRTM)25 and Logan reference (Logan Ref) method26 using the tTAC of the pons as the reference input function instead of blood sampling. In the SRTM, BPND was estimated directly by nonlinear-least-squares fitting. In the Logan Ref, the distribution volume ratio (DVR) of the target and reference regions was estimated as the slope of the regression line by using points between 15 and 90 minutes and input ḱ2 value (ḱ2 range, 0.11 to 0.17) determined from the result of the SRTM. Then, BPND was calculated as DVR−1. The estimated BPND values were compared with those based on the 2-TCM or Logan GA. All kinetic analyses were performed by PMOD version 3.2 (PMOD Technologies, Zurich, Switzerland).
In Vivo Measurement of Binding Potential for N-[4-[6-(isopropylamino)-pyrimidin-4-yl]-1,3-thiazol-2-yl]-N-methyl-4-[11C]-Methylbenzamide with Metabotropic Glutamate Receptor Type 1 in R6/2 Mice
To investigate the change in BPND for [11C]ITDM with mGluR1 in the brains of mice carrying the HD gene (R6/2), PET scans were performed on noncarrier mice (n=11, male, 12 weeks, 28 to 30 g) and R6/2 mice (n=13, male, 12 weeks, 20 to 23 g). Before scanning, a homemade 29-gauge needle with 12 to 15 cm of PE 10 tubing was inserted into the tail vein for a bolus injection. After positioning in the PET scanner, the mouse was injected with a bolus of [11C]ITDM (15 to 17 MBq, 0.1 to 0.2 pmol, in 0.1 mL saline). Emission data were acquired and reconstructed as described above. The VOIs for the mouse brain were manually drawn on the summed PET images for cerebellum, thalamus, whole striatum, cingulate cortex, and pons by individual experiences. The respective sizes of VOIs in noncarrier and R6/2 mouse brains were 42.0 and 44.0 mm3 for the cerebellum, 19.5 and 17.2 mm3 for the thalamus, 9.5 and 9.25 mm3 for the whole striatum, 4.8 and 5.5 mm3 for the cingulate cortex, and 9.8 and 11.5 mm3 for the pons by referencing MRI templates of mouse brain.27 Quantitative values for mGluR1 with [11C]ITDM were expressed as BPND in brain regions. The respective PET quantitative analyses using generated tTACs in brain regions were performed with Logan Ref using the tTAC of the pons as a reference.
Autoradiography and Immunohistochemistry
Male 12-week-old noncarrier and R6/2 mice were killed by cervical dislocation. The brains were removed and immediately frozen in crushed dry ice. The frozen brains were cut into 10-μm-thick sagittal sections by a cryotome (HM560/Carl Zeiss, Oberkochen, Germany), and the slices were mounted on glass slides (Matsunami Glass, Osaka, Japan). The brain sections were preincubated for 20 minutes in 50 mmol/L Tris-HCl buffer (pH 7.4) containing 1.2 mmol/L MgCl2 and 2 mmol/L CaCl2 at room temperature. The sections were then incubated for 60 minutes at room temperature in fresh buffer containing [11C]ITDM (18 MBq, 1.0 nmol/L). After incubation, the brain sections were washed (3 × 2 minutes) with cold buffer, dipped in cold distilled water, and dried in air. They were placed in contact with imaging plates (BAS-MS2025/Fujifilm, Tokyo, Japan). Autoradiographs were acquired using a Bio-Imaging Analyzer System (BAS5000/Fujifilm). Regions of interest (ROIs) in autoradiographs were manually drawn in cerebellum, pons, thalamus, and striatum, respectively. Plate exposure degree of radioactivity was calculated by using the Multi Gauge analysis software version 2.3 (Fujifilm) and was expressed as photostimulated luminescence values (PSLs) per square millimeter (PSLs/mm2). The present PSL values were not normalized with calibration. All autoradiograms in present study were acquired under same experimental conditions, including same incubation and contact times, incubated solution and imaging plate.
Sections adjacent to those used for autoradiography were immunofluorescence stained with a mouse polyclonal antibody (LifeSpan BioSciences, Seattle, WA, USA) against mGluR1 proteins and Alexa Fluor 488 goat anti-rabbit IgG (Life Technologies, Baltimore, MD, USA). Slides were examined with an all-in-one microscope/digital camera (Olympus, Tokyo, Japan). A number of adjacent microscope images were connected by using the e-Thing software (Mitani, Tokyo, Japan). For quantitative analysis of fluorescence strength on the connected images, the open source, Java-based software package ImageJ (http://rsbweb.nih.gov/ij/) was used. The software was set up to identify total number of beads in a field of view. Respective ROIs were manually drawn in cerebellum, pons, thalamus, and striatum. Data are presented as arbitrary fluorescence units, which are treated as relative value within present study.
Statistics
Statistical analyses in the noncarrier versus R6/2 mice groups used Mann–Whitney tests with a two-tailed P value. All analyses were performed using GraphPad Prism v5.0 (GraphPad Software, La Jolla, CA, USA).
Results
Visual Analysis
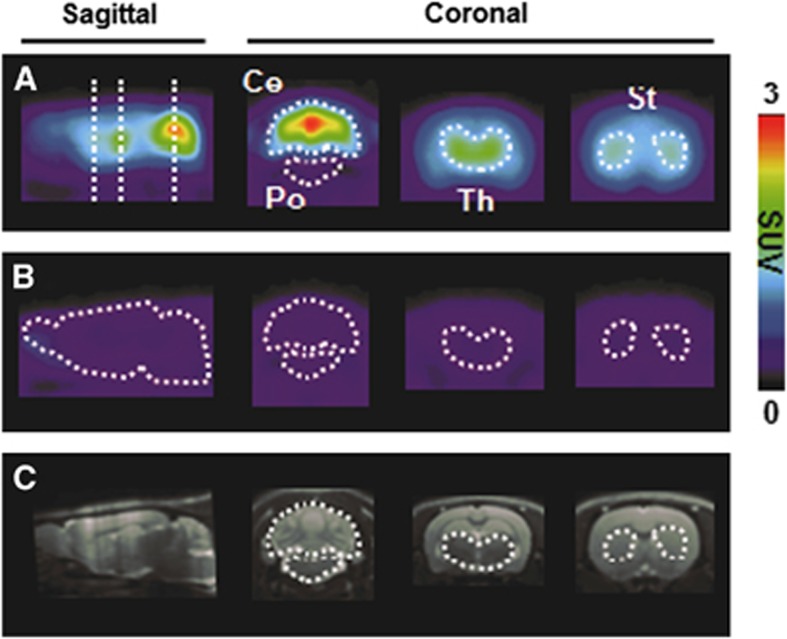
Figure 1 shows representative PET images in the baseline (A) and blocking (B) studies. The baseline images show the intensity of tracer uptake, in descending order: cerebellum, thalamus, striatum, hippocampus, cingulate cortex, and pons, as identified by referencing MRI templates (C). In the blocked case, radioactive signal intensity in the brain is significantly diminished by competition for mGluR1 with the injected unlabeled FITM.
Figure 1.
Representative [11C]ITDM-PET images of the brains of rats without (A) or with (B) unlabeled 4-fluoro-N-[4-[6-(isopropylamino)pyrimidin-4-yl]-1,3-thiazol-2-yl]-N-methylbenzamide (FITM) (1 mg/kg) pretreatment and magnetic resonance imaging (MRI) templates of rat brain (C). Volumes of interest (VOIs) were drawn to generate regional tissue time-activity curves (tTACs) in cerebellum (Ce), pons (Po), hippocampus (Hi), thalamus (Th), cingulate cortex (Ci), and striatum (St). The PET images displayed here reflect the radioactivity summed from 0 to 90 minutes after injection. The color scale represents the standardized uptake value (SUV). [11C]ITDM, N-[4-[6-(isopropylamino)-pyrimidin-4-yl]-1,3-thiazol-2-yl]-N-methyl-4-[11C]-methylbenzamide; PET, positron emission tomography.
Time Course of Radioactivity in Brain Regions
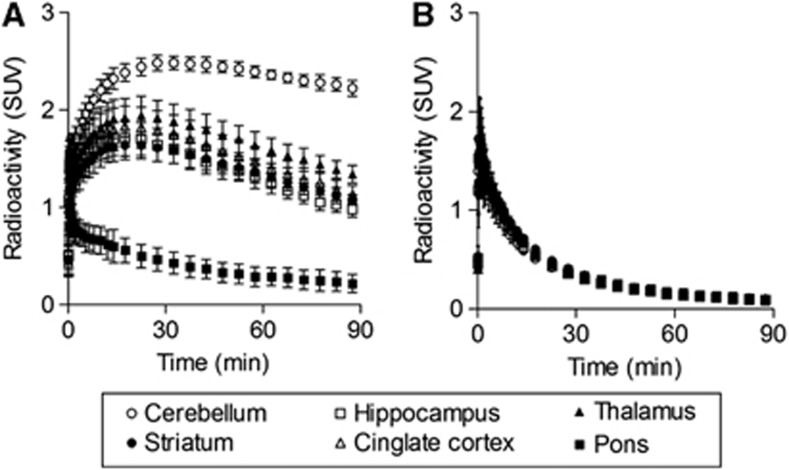
Figure 2 shows tTACs of [11C]ITDM for the baseline (A) and blocked (B) PET studies. In the baseline tTACs, the maximum of SUV (mean±standard deviation), in the mGluR1 rich regions measured as follows: cerebellum 2.5±0.1, thalamus 1.9±0.2, striatum 1.8±0.2, cingulate cortex 1.7±0.2, and hippocampus 1.6±0.1. Uptake appeared to peak at 15 to 25 minutes after a bolus injection. Conversely, radioactivity in the pons showed rapid washout after the injection. Although radioactivity in the pons was low, its tTAC was obtained within reliable range: the percentage of coefficient of variation was 23.5 to 43.2. Pretreatment with FITM reduced delayed uptake in all regions examined. The early nonspecific whole-brain activity is reflective of radioactivity concentration in the blood pool.
Figure 2.
Averaged (±s.d.) time course of radioactivity in cerebellum (open circles), hippocampus (open squares), thalamus (black triangles), striatum (black circles), cingulate cortex (open triangles), and pons (black squares) obtained from [11C]ITDM-PET in baseline (A) and blocking (B) studies, respectively. All data are expressed as the standardized uptake value (SUV). [11C]ITDM, N-[4-[6-(isopropylamino)-pyrimidin-4-yl]-1,3-thiazol-2-yl]-N-methyl-4-[11C]-methylbenzamide; PET, positron emission tomography.
Accuracy of the Noninvasive Quantitative Method for Measurement of Binding Potential for N-[4-[6-(isopropylamino)-pyrimidin-4-yl]-1,3-thiazol-2-yl]-N-methyl-4-[11C]-Methylbenzamide to Metabotropic Glutamate Receptor Type 1
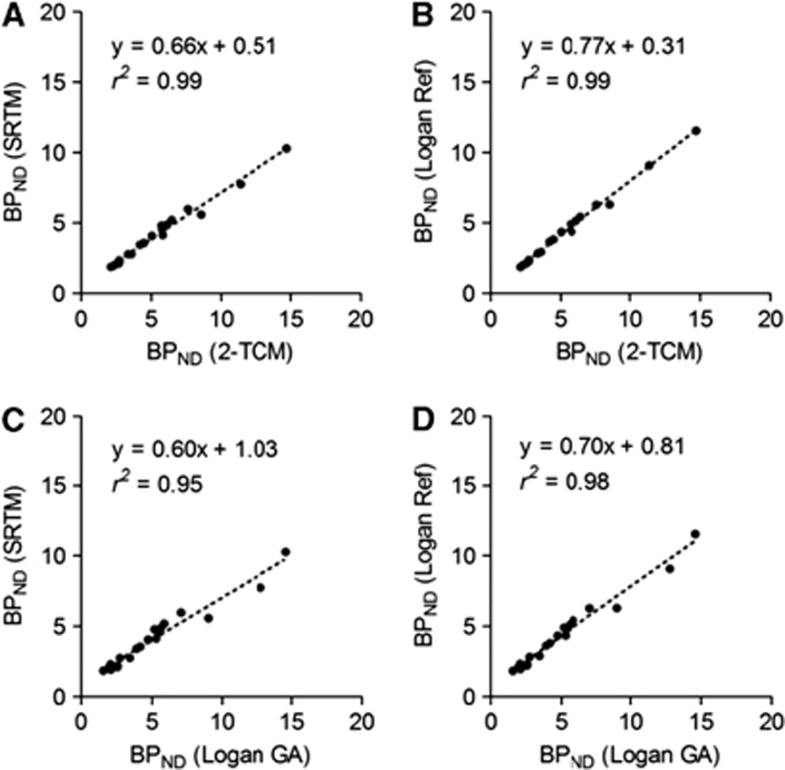
Figure 3 shows the relationships between BPND values estimated by the plasma input and reference tissue methods. The BPND values based on both the SRTM and Logan Ref methods displayed a close correlation with those based on the arterial input method (r2=0.99), though the BPND values based on the reference tissue method were underestimated. The magnitude of underestimation was larger with the SRTM than the Logan Ref (slope=0.66 for the SRTM and slope=0.77 for the Logan Ref).
Figure 3.
Scatter plots indicating relationship between binding potential (BPND) values based on reference tissue methods and those based on blood sampling methods in positron emission tomography (PET) studies of normal Sprague-Dawley (SD) rats (n=4). (A) Simplified reference tissue model (SRTM) versus two-tissue compartment model (2-TCM). (B) Logan reference (Logan Ref) versus 2-TCM. (C) SRTM versus Logan graphical analysis (Logan GA). (D) Logan Ref versus Logan GA.
In Vivo Measurement of Binding Potential for Metabotropic Glutamate Receptor Type 1 with N-[4-[6-(isopropylamino)-pyrimidin-4-yl]-1,3-thiazol-2-yl]-N-methyl-4-[11C]-methylbenzamide Positron emission tomography in Noncarrier and R6/2 Mice
Visual analysis
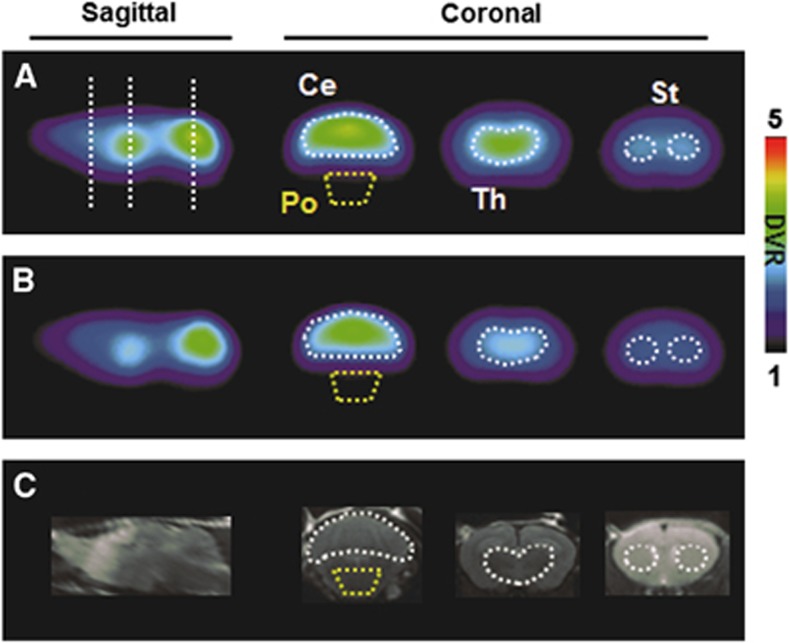
Figure 4 shows representative [11C]ITDM-PET images with DVR scale in noncarrier (A) and R6/2 (B) mouse brains. In the noncarrier mice, the rank order of DVR level intensity was as follows: cerebellum>thalamus>striatum>cingulate cortex. These distribution patterns of radioactivity were similar to that on rat brain as described in ‘Visual Analysis'. In contrast, the uptake of radiotracer in R6/2 mice was much lower in each vulnerable region.
Figure 4.
Representative [11C]ITDM-PET images of the brains of noncarrier (A) and R6/2 (B) mice and magnetic resonance imaging (MRI) templates of mouse brain (C). The PET images displayed here reflect the radioactivity summed from 0 to 90 minutes after injection. Abbreviations are as follows: Ce, cerebellum; Po, pons; Th, thalamus; St, striatum. The color scale represents the distribution volume ratio (DVR). [11C]ITDM, N-[4-[6-(isopropylamino)-pyrimidin-4-yl]-1,3-thiazol-2-yl]-N-methyl-4-[11C]-methylbenzamide; PET, positron emission tomography.
Kinetic analysis
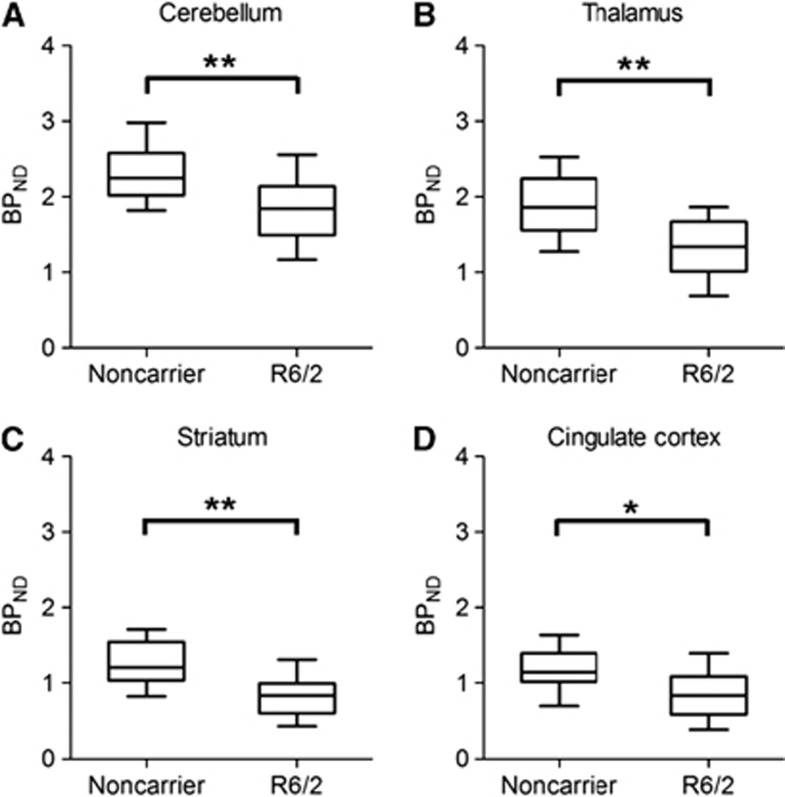
Figure 5 shows the box plots of BPND values based on Logan Ref in cerebellum (A), thalamus (B), striatum (C), and cingulate cortex (D) of normal and R6/2 mouse brains, respectively. The BPND values in the R6/2 mouse brains were decreased in all ROIs compared with those in noncarrier mice. Although TACs in the pons of noncarrier and R6/2 mouse brains as a reference input function showed no differences (Supplementary Figure S1), the greatest decline of BPND in R6/2 mouse brains was found in the striatum, with a 36% decrease, followed by the thalamus, with a 29% decrease (Table 1). Mann–Whitney tests indicated significant differences in each vulnerable brain region (P<0.05) between normal and R6/2 mice.
Figure 5.
Box plots showing individual binding potential (BPND) values in the two groups (noncarrier and R6/2 mice) of cerebellum (A), thalamus (B), striatum (C), and cingulate cortex (D). The horizontal line in each box represents the mean value. *P<0.05, **P<0.01.
Table 1. BP ND values in brain regions of noncarrier (n=11) and R6/2 (n=13) mice and the percentage of decrease of BP ND in brain regions of R6/2 mice.
| Region | Noncarriera | R6/2a | Decrease (%) |
|---|---|---|---|
| Cerebellum | 2.3±0.4 | 1.8±0.4** | 21.8 |
| Thalamus | 1.9±0.4 | 1.4±0.4** | 28.5 |
| Striatum | 1.3±0.3 | 0.8±0.3** | 35.8 |
| Cingulate cortex | 1.2±0.3 | 0.9±0.3* | 26.7 |
BPND, binding potential.
Data are expressed as mean±s.d. *P<0.05; **P<0.01 versus noncarrier.
Autoradiography and Immunohistochemistry
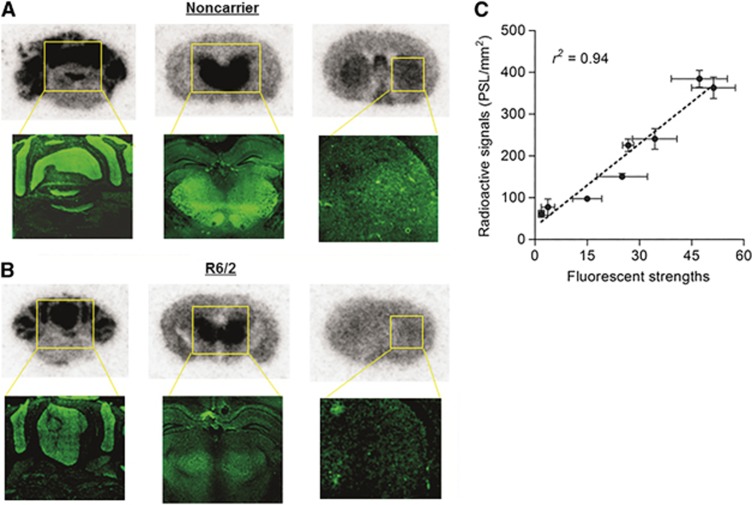
Figure 6 shows autoradiographic and immunohistochemical images in noncarrier (A) and R6/2 (B) mouse brain sections, respectively. As with the results of the PET studies, autoradiographs showed decreased uptake in each vulnerable region of the R6/2 sections compared with noncarrier sections. In the immunohistochemical images, fluorescence strength of the R6/2 brains showed a similar decline to autoradiogram, especially in the striatum. Moreover, atrophy through the whole brain, especially, in the striatum and the thalamus, was observed. Figure 6C shows correlation between radioactive uptake and fluorescence strength in the mouse sections. A regression line in the graph shows good correlation with high confidence (r2=0.94). This result shows that each region of decreased uptake of [11C]ITDM in the R6/2 mouse brain sections corresponds to decreased mGluR1 expression.
Figure 6.
Comparison between autoradiographs (top) with [11C]ITDM and immunohistochemical images (bottom) in the noncarrier (A) and R6/2 (B) mouse brain sections and correlation between radioactive signal intensity and fluorescence strength obtained by scatter plot (C). Data are expressed as means±s.d. (n=3 slides in each anatomic level). [11C]ITDM, N-[4-[6-(isopropylamino)-pyrimidin-4-yl]-1,3-thiazol-2-yl]-N-methyl-4-[11C]-methylbenzamide; PSLs, photostimulated luminescence values.
Discussion
We have shown that [11C]ITDM-PET using a reference tissue model is a suitable approach for in vivo measurement of mGluR1 levels without the need for arterial blood sampling. Subsequently, we succeeded in visualizing and quantifying the decreased levels of brain mGluR1 in living mice carrying the HD transgene.
The BPND is generally treated as a quantitative value representing the receptor-bound radiopharmaceutical in brain PET assessment. The 2-TCM is known as a standard method for estimation of BPND. However, arterial blood sampling and sequential metabolite analysis are logistically challenging, and nonlinear-least-squares fitting with 2-TCM is sensitive to the statistical noise in the brain tTACs. To overcome these problems, several reference tissue models have been developed to enable BPND calculation without arterial blood sampling using the tTAC of a reference region where the specific binding is negligible.25, 26, 28 Thus, if a reference region could be located in the brain, then quantitative PET analysis for the target receptor would be dramatically simplified.
The pons, a part of the brainstem, is known as a region where mGluR1 concentration is negligible,8 and it is often used as a reference region in noninvasive quantitative PET analysis of neuroreceptors.29, 30 To estimate BPND for mGluR1 noninvasively with [11C]ITDM-PET, we validated the reference tissue method using the tTAC of the pons. In PET studies with SD rats, accumulation of receptor-bound radioactivity was not observed in the pons (Figures 1 and 2), and there was no significant difference in VT value of the pons between PET studies on animals pretreated with and without FITM for the saturation of mGluR1 binding sites (data not shown), suggesting that the pons is a reasonable reference region. In addition, both the SRTM and Logan Ref methods estimated BPND values that closely correlated with those based on 2-TCM with the arterial input function, though BPND values based on reference methods were underestimated, especially with the SRTM (Figure 3). These results suggest that the Logan Ref is a practical method for noninvasive quantification of mGluR1 with [11C]ITDM-PET, and we applied this method using HD model mice as an mGluR1-deficient model. Note that the input ḱ2 value should be predefined for the Logan Ref analysis; however, the error of this value minimally affected the estimated DVR values (data not shown).
Huntington's disease is known as a CNS degenerative disorder with a course characterized by involuntary body movements, loss of cognitive function, psychiatric disturbances, and death.31, 32 To facilitate the further understanding of HD pathogenesis, several transgenic mouse models of HD have been generated.33 Of these, the R6/2 mouse expresses exon 1 of the human HD gene with 150 CAG repeats, showing loss of brain and body weight at ∼6 weeks of age, and developing neurologic symptoms at 9 to 11 weeks.34 Prior pathologic techniques have shown that mGluR1, but not mGluR5, was dramatically decreased in the striatum of 4- to 12-week-old R6/2 mice.14 In this study, we visualized and measured decreased mGluR1 expression using quantitative [11C]ITDM-PET in living R6/2 mice.
As expected, visual analysis in PET with [11C]ITDM showed a decrease in signal reflecting the DVR scale in the vulnerable brain regions in R6/2 mice compared with those in noncarrier mice (Figure 4). The BPND values based on Logan Ref were heterogeneously decreased in all ROIs of R6/2 mouse brains (Figure 5). The highest BPND decrease was seen in the striatum, at roughly 35%, followed by thalamus, cingulate cortex, and cerebellum at 20% to 30% (Table 1). These percentage decreases in the striatum and the cortex were similar to the decreased mRNA levels in the striatum and the cortex of R6/2 mice in results of in situ hybridization as described previously.14
To confirm whether BPND values for [11C]ITDM with mGluR1 were parallel to mGluR1 expression, we performed autoradiography with [11C]ITDM and immunohistochemistry with an mGluR1-selective antigen on noncarrier and R6/2 mouse brain sections under the in vitro conditions. Identical to the pattern of fluorescence in the immunohistochemical images, a greater uptake of [11C]ITDM was detected in cerebellum, thalamus, hippocampus, and striatum of noncarrier mouse brain sections (Figure 6A). Similar to the PET results, autoradiographs and immunohistochemical images of R6/2 mouse brain sections showed a heterogeneous decrease of signal in striatum, thalamus, and cerebellum (Figure 6B). Radioactive signals of autoradiographs and fluorescent strengths of immunohistochemical images showed good correlation with high confidence (r2=0.94), suggesting that the radioactive signal intensity corresponded with mGluR1 expression (Figure 6C). Thus, we showed that measuring BPND for mGluR1 with [11C]ITDM-PET quantifies the heterogeneous decrease of mGluR1 expression in the brain of HD model mice.
It is clear that a complex interaction between mGluR1 and mGluR5 activation has a very important role in neuronal degeneration. The in vivo monitoring of mGluR1 may lead to a better understanding of its actions in the pathophysiologic and biologic processes of neurodegenerative disorders. Further, regarding other neurotransmitter receptors in R6/2 mice, it has been reported that although concentrations of mGluR2/3 mRNAs have shown no changes compared with noncarrier animals, their products are significantly decreased.14 In addition, in vitro binding of [3H]dopamine in the striatum of R6/2 mice decreases dramatically with age.14 These results suggest that aggregation of abnormal proteins may interfere with transcription of the mRNAs of mGluR2/3 regulating presynaptic glutamate release, causing excess glutamate concentrations in the synaptic cleft. Such excess glutamate concentrations may promote acceleration of dopamine release via cascades involving activation of glutamate receptors including mGluR1 and mGluR5.35 Subsequently, the sensitivity of dopamine receptors would be lowered, resulting in depletion of the dopaminergic neurons. However, it is unclear how downregulation of mGluR1 expressions is involved in the degeneration of dopaminergic neurons in the terminal phase of HD. Hence, exhaustive in vivo monitoring of neuroreceptors including mGluR1 may elucidate a common pathologic mechanism of polyglutamine diseases by assessing changes in neuroreceptor concentrations over time.
In conclusion, our in vivo quantitative technique for mGluR1, which requires no arterial blood sampling, may be a potential tool for further understanding of neurodegenerative processes in CNS disorders, and help in the development of new pharmaceuticals against these diseases.
Acknowledgments
The authors thank the staff at the National Institute of Radiological Sciences for their support with the cyclotron operation, radioisotope production, radiosynthesis, and animal experiments.
The authors declare no conflict of interest.
Footnotes
Supplementary Information accompanies the paper on the Journal of Cerebral Blood Flow & Metabolism website (http://www.nature.com/jcbfm)
This study was supported by the Grants-in-Aid for Scientific Research (Basic Research C: 22591379) from the Ministry of Education, Culture, Sports, Science, and Technology of the Japanese Government.
Supplementary Material
References
- Hermans E, Challiss RA. Structural, signalling and regulatory properties of the group I metabotropic glutamate receptors: prototypic family C G-protein-coupled receptors. Biochem J. 2001;359:465–484. doi: 10.1042/0264-6021:3590465. [DOI] [PMC free article] [PubMed] [Google Scholar]
- Ferraguti F, Crepaldi L, Nicoletti F. Metabotropic glutamate 1 receptor: current concepts and perspectives. Pharmacol Rev. 2008;60:536–581. doi: 10.1124/pr.108.000166. [DOI] [PubMed] [Google Scholar]
- Aramori I, Nakanishi S. Signal transduction and pharmacological characteristics of a metabotropic glutamate receptor, mGluR1, in transfected CHO cells. Neuron. 1992;8:757–765. doi: 10.1016/0896-6273(92)90096-v. [DOI] [PubMed] [Google Scholar]
- Di Matteo V, De Blasi A, Di Giulio C, Esposito E. Role of 5-HT(2C) receptors in the control of central dopamine function. Trends Pharmacol Sci. 2001;22:229–232. doi: 10.1016/s0165-6147(00)01688-6. [DOI] [PubMed] [Google Scholar]
- Francesconi A, Duvoisin RM. Role of the second and third intracellular loops of metabotropic glutamate receptors in mediating dual signal transduction activation. J Biol Chem. 1998;273:5615–5624. doi: 10.1074/jbc.273.10.5615. [DOI] [PubMed] [Google Scholar]
- Battaglia G, Bruno V, Pisani A, Centonze D, Catania MV, Calabresi P, et al. Selective blockade of type-1 metabotropic glutamate receptors induces neuroprotection by enhancing gabaergic transmission. Mol Cell Neurosci. 2001;17:1071–1083. doi: 10.1006/mcne.2001.0992. [DOI] [PubMed] [Google Scholar]
- Bordi F, Ugolini A. Group I metabotropic glutamate receptors: implications for brain diseases. Prog Neurobiol. 1999;59:55–79. doi: 10.1016/s0301-0082(98)00095-1. [DOI] [PubMed] [Google Scholar]
- Fotuhi M, Sharp AH, Glatt CE, Hwang PM, von Krosigk M, Snyder SH, et al. Differential localization of phosphoinositide-linked metabotropic glutamate receptor (mGluR1) and the inositol 1,4,5-trisphosphate receptor in rat brain. J Neurosci. 1993;13:2001–2012. doi: 10.1523/JNEUROSCI.13-05-02001.1993. [DOI] [PMC free article] [PubMed] [Google Scholar]
- Pisani A, Calabresi P, Centonze D, Bernardi G. Enhancement of NMDA responses by group I metabotropic glutamate receptor activation in striatal neurones. Br J Pharmacol. 1997;120:1007–1014. doi: 10.1038/sj.bjp.0700999. [DOI] [PMC free article] [PubMed] [Google Scholar]
- Valenti O, Conn PJ, Marino MJ. Distinct physiological roles of the Gq-coupled metabotropic glutamate receptors Co-expressed in the same neuronal populations. J Cell Physiol. 2002;191:125–137. doi: 10.1002/jcp.10081. [DOI] [PubMed] [Google Scholar]
- Kohara A, Takahashi M, Yatsugi S, Tamura S, Shitaka Y, Hayashibe S, et al. Neuroprotective effects of the selective type 1 metabotropic glutamate receptor antagonist YM-202074 in rat stroke models. Brain Res. 2008;1191:168–179. doi: 10.1016/j.brainres.2007.11.035. [DOI] [PubMed] [Google Scholar]
- Szydlowska K, Kaminska B, Baude A, Parsons CG, Danysz W. Neuroprotective activity of selective mGlu1 and mGlu5 antagonists in vitro and in vivo. Eur J Pharmacol. 2007;554:18–29. doi: 10.1016/j.ejphar.2006.09.061. [DOI] [PubMed] [Google Scholar]
- Bao WL, Williams AJ, Faden AI, Tortella FC. Selective mGluR5 receptor antagonist or agonist provides neuroprotection in a rat model of focal cerebral ischemia. Brain Res. 2001;922:173–179. doi: 10.1016/s0006-8993(01)03062-1. [DOI] [PubMed] [Google Scholar]
- Cha JH, Kosinski CM, Kerner JA, Alsdorf SA, Mangiarini L, Davies SW, et al. Altered brain neurotransmitter receptors in transgenic mice expressing a portion of an abnormal human huntington disease gene. Proc Natl Acad Sci USA. 1998;95:6480–6485. doi: 10.1073/pnas.95.11.6480. [DOI] [PMC free article] [PubMed] [Google Scholar]
- Ametamey SM, Kessler LJ, Honer M, Wyss MT, Buck A, Hintermann S, et al. Radiosynthesis and preclinical evaluation of 11C-ABP688 as a probe for imaging the metabotropic glutamate receptor subtype 5. J Nucl Med. 2006;47:698–705. [PubMed] [Google Scholar]
- Ametamey SM, Treyer V, Streffer J, Wyss MT, Schmidt M, Blagoev M, et al. Human PET studies of metabotropic glutamate receptor subtype 5 with 11C-ABP688. J Nucl Med. 2007;48:247–252. [PubMed] [Google Scholar]
- Wyss MT, Ametamey SM, Treyer V, Bettio A, Blagoev M, Kessler LJ, et al. Quantitative evaluation of 11C-ABP688 as PET ligand for the measurement of the metabotropic glutamate receptor subtype 5 using autoradiographic studies and a beta-scintillator. NeuroImage. 2007;35:1086–1092. doi: 10.1016/j.neuroimage.2007.01.005. [DOI] [PubMed] [Google Scholar]
- Fujinaga M, Yamasaki T, Maeda J, Yui J, Xie L, Nagai Y, et al. Development of N-[4-[6-(isopropylamino)pyrimidin-4-yl]-1,3-thiazol-2-yl]-N-methyl-4-[11C]methylbenzamide for positron emission tomography imaging of metabotropic glutamate 1 receptor in monkey brain. J Med Chem. 2012;55:11042–11051. doi: 10.1021/jm301597s. [DOI] [PubMed] [Google Scholar]
- Satoh A, Nagatomi Y, Hirata Y, Ito S, Suzuki G, Kimura T, et al. Discovery and in vitro and in vivo profiles of 4-fluoro-N-[4-[6-(isopropylamino)pyrimidin-4-yl]-1,3-thiazol-2-yl]-N-methy lbenzamide as novel class of an orally active metabotropic glutamate receptor 1 (mGluR1) antagonist. Bioorg Med Chem Lett. 2009;19:5464–5468. doi: 10.1016/j.bmcl.2009.07.097. [DOI] [PubMed] [Google Scholar]
- Takei M, Kida T, Suzuki K. Sensitive measurement of positron emitters eluted from HPLC. Appl Radiat Isot. 2001;55:229–234. doi: 10.1016/s0969-8043(00)00392-4. [DOI] [PubMed] [Google Scholar]
- Yui J, Hatori A, Kawamura K, Yanamoto K, Yamasaki T, Ogawa M, et al. Visualization of early infarction in rat brain after ischemia using a translocator protein (18 kDa) PET ligand [11C]DAC with ultra-high specific activity. NeuroImage. 2011;54:123–130. doi: 10.1016/j.neuroimage.2010.08.010. [DOI] [PubMed] [Google Scholar]
- Mintun MA, Raichle ME, Kilbourn MR, Wooten GF, Welch MJ. A quantitative model for the in vivo assessment of drug binding sites with positron emission tomography. Ann Neurol. 1984;15:217–227. doi: 10.1002/ana.410150302. [DOI] [PubMed] [Google Scholar]
- Logan J, Fowler JS, Volkow ND, Wolf AP, Dewey SL, Schlyer DJ, et al. Graphical analysis of reversible radioligand binding from time-activity measurements applied to [N-11C-methyl]-(−)-cocaine PET studies in human subjects. J Cereb Blood Flow Metab. 1990;10:740–747. doi: 10.1038/jcbfm.1990.127. [DOI] [PubMed] [Google Scholar]
- Yamasaki T, Fujinaga M, Kawamura K, Yui J, Hatori A, Ohya T, et al. In vivo measurement of the affinity and density of metabotropic glutamate receptor subtype 1 in rat brain using 18F-FITM in small-animal PET. J Nucl Med. 2012;53:1601–1607. doi: 10.2967/jnumed.112.105908. [DOI] [PubMed] [Google Scholar]
- Lammertsma AA, Hume SP. Simplified reference tissue model for PET receptor studies. NeuroImage. 1996;4:153–158. doi: 10.1006/nimg.1996.0066. [DOI] [PubMed] [Google Scholar]
- Logan J, Fowler JS, Volkow ND, Wang GJ, Ding YS, Alexoff DL. Distribution volume ratios without blood sampling from graphical analysis of PET data. J Cereb Blood Flow Metab. 1996;16:834–840. doi: 10.1097/00004647-199609000-00008. [DOI] [PubMed] [Google Scholar]
- Maeda J, Zhang MR, Okauchi T, Ji B, Ono M, Hattori S, et al. In vivo positron emission tomographic imaging of glial responses to amyloid-beta and tau pathologies in mouse models of Alzheimer's disease and related disorders. J Neurosci. 2011;31:4720–4730. doi: 10.1523/JNEUROSCI.3076-10.2011. [DOI] [PMC free article] [PubMed] [Google Scholar]
- Lammertsma AA, Bench CJ, Hume SP, Osman S, Gunn K, Brooks DJ, et al. Comparison of methods for analysis of clinical [11C]raclopride studies. J Cereb Blood Flow Metab. 1996;16:42–52. doi: 10.1097/00004647-199601000-00005. [DOI] [PubMed] [Google Scholar]
- Geeraerts T, Coles JP, Aigbirhio FI, Pickard JD, Menon DK, Fryer TD, et al. Validation of reference tissue modelling for [11C]flumazenil positron emission tomography following head injury. Ann Nucl Med. 2011;25:396–405. doi: 10.1007/s12149-011-0480-4. [DOI] [PubMed] [Google Scholar]
- Pearl PL, Gibson KM, Quezado Z, Dustin I, Taylor J, Trzcinski S, et al. Decreased GABA-A binding on FMZ-PET in succinic semialdehyde dehydrogenase deficiency. Neurology. 2009;73:423–429. doi: 10.1212/WNL.0b013e3181b163a5. [DOI] [PMC free article] [PubMed] [Google Scholar]
- Li SH, Li XJ. Huntingtin-protein interactions and the pathogenesis of Huntington's disease. Trends Genet. 2004;20:146–154. doi: 10.1016/j.tig.2004.01.008. [DOI] [PubMed] [Google Scholar]
- Young AB. Huntingtin in health and disease. J Clin Invest. 2003;111:299–302. doi: 10.1172/JCI17742. [DOI] [PMC free article] [PubMed] [Google Scholar]
- Mangiarini L, Sathasivam K, Mahal A, Mott R, Seller M, Bates GP. Instability of highly expanded CAG repeats in mice transgenic for the Huntington's disease mutation. Nat Genet. 1997;15:197–200. doi: 10.1038/ng0297-197. [DOI] [PubMed] [Google Scholar]
- Mangiarini L, Sathasivam K, Seller M, Cozens B, Harper A, Hetherington C, et al. Exon 1 of the HD gene with an expanded CAG repeat is sufficient to cause a progressive neurological phenotype in transgenic mice. Cell. 1996;87:493–506. doi: 10.1016/s0092-8674(00)81369-0. [DOI] [PubMed] [Google Scholar]
- Patel S, Hamill TG, Connolly B, Jagoda E, Li W, Gibson RE. Species differences in mGluR5 binding sites in mammalian central nervous system determined using in vitro binding with [18F]F-PEB. Nucl Med Biol. 2007;34:1009–1017. doi: 10.1016/j.nucmedbio.2007.07.009. [DOI] [PubMed] [Google Scholar]
Associated Data
This section collects any data citations, data availability statements, or supplementary materials included in this article.


