

Abstract
The neonatal brain is vulnerable to oxidative stress, and the pentose phosphate pathway (PPP) may be of particular importance to limit the injury. Furthermore, in the neonatal brain, neurons depend on de novo synthesis of neurotransmitters via pyruvate carboxylase (PC) in astrocytes to increase neurotransmitter pools. In the adult brain, PPP activity increases in response to various injuries while pyruvate carboxylation is reduced after ischemia. However, little is known about the response of these pathways after neonatal hypoxia-ischemia (HI). To this end, 7-day-old rats were subjected to unilateral carotid artery ligation followed by hypoxia. Animals were injected with [1,2-13C]glucose during the recovery phase and extracts of cerebral hemispheres ipsi- and contralateral to the operation were analyzed using 1H- and 13C-NMR (nuclear magnetic resonance) spectroscopy and high-performance liquid chromatography (HPLC). After HI, glucose levels were increased and there was evidence of mitochondrial hypometabolism in both hemispheres. Moreover, metabolism via PPP was reduced bilaterally. Ipsilateral glucose metabolism via PC was reduced, but PC activity was relatively preserved compared with glucose metabolism via pyruvate dehydrogenase. The observed reduction in PPP activity after HI may contribute to the increased susceptibility of the neonatal brain to oxidative stress.
Keywords: astrocytes, brain development, brain ischemia, energy metabolism, magnetic resonance
Introduction
Neonatal hypoxic-ischemia (HI) occurs in 1 to 3 per 1,000 live births and has enormous life-long consequences for the families and society.1 A decrease in delivery of oxygen and glucose initiates energy failure, triggering a cascade of events leading to production of reactive oxygen species, activation of inflammatory pathways, early necrosis, and delayed apoptosis.2 Neonates have low cerebral energy consumption compared with adults, which may be protective during hypoxia,3 and the utilization of alternate energy sources like ketone bodies is high in the neonatal brain.4 Nevertheless, glucose is an essential substrate also in the neonatal brain and is used for energy metabolism,5 the pentose phosphate pathway (PPP), and de novo synthesis of neurotransmitters dependent on pyruvate carboxylation.6 The pathophysiological mechanisms underlying neonatal HI have been extensively investigated in rat brain on postnatal day 7 (P7), a time point that is comparable to late preterm human brain development.7 However, the PPP and the pyruvate carboxylation have not earlier been studied in relation to neonatal HI.
The PPP generates pentoses for nucleotide production and NADPH for lipid synthesis. The level of the PPP is high in the neonatal brain (11% to 14%)6 compared with the adult brain (4.5±1%)8 and it has been proposed that cellular growth, differentiation, and lipid synthesis in the brain during development are the cause.9 In addition, the neonatal brain is susceptible to oxidative stress because of low levels of antioxidant enzymes and a pro-oxidant environment due to high concentrations of fatty acids and iron.10 Moreover, the sick neonate, born into an environment of relatively high oxygen tension compared with that in utero, is often subject to oxygen therapy as a part of resuscitation and intensive care, exacerbating oxidative stress.11 It has been suggested that upregulation of the PPP forms part of the defense against oxidative stress in the brain because NADPH is a cofactor for glutathione reductase. Glutathione reductase regenerates reduced glutathione (GSH) that acts together with glutathione peroxidase to eliminate reactive oxygen species. In the adult brain, the PPP is increased after traumatic brain injury12 and reoxygenation after hypoxia.13 The maximal activity of PPP-related enzymes is remarkably stable during development;14 thus, the neonatal brain may have a similar capacity to upregulate the pathway. Nonetheless, the PPP activity during conditions of increased oxidative stress such as in the immediate recovery phase after neonatal HI has not been studied previously. Furthermore, there is evidence of lasting damage to immature white matter after neonatal HI, especially in the preterm brain,10 indicating that there may be a dysfunction in lipid synthesis after neonatal HI. Due to the close link between the PPP and lipid synthesis, it is of particular interest to study this pathway in the neonatal brain after HI.
Pyruvate carboxylation is the main anaplerotic reaction in the brain, and is essential for de novo synthesis of amino-acid neurotransmitters.9 Because pyruvate carboxylase (PC) is present in astrocytes and not in neurons,15 the latter are dependent on glutamine from astrocytes to maintain their neurotransmitter pools of glutamate and GABA.16 The neonatal brain has low amounts of glutamate, and it follows that extensive pyruvate carboxylation is necessary to achieve the much higher glutamate levels of the adult brain.6 Indeed, even though the activity of PC is low in the neonatal brain,17 the ratio between glutamine labeled by PC versus pyruvate dehydrogenase (PDH) is higher in the P7 rat compared with adults.6 This implies that in the neonatal brain, astrocytes prioritize glucose for anaplerosis, and it is conceivable that an impairment of anaplerosis can have detrimental consequences for normal brain development. Pyruvate carboxylation is severely impaired by ischemia in the adult rat brain,18, 19 but it is not known how neonatal HI affects this pathway.
The aim of our study was to investigate glucose metabolism in the P7 rat brain in the immediate recovery phase after HI with particular focus on the PPP and pyruvate carboxylation. On the basis of findings in the adult brain, we hypothesized that: (1) PPP activity is increased and (2) PC is reduced after neonatal HI.
Materials and methods
Materials
[1,2-13C]Glucose (99% 13C enriched) was obtained from Cambridge Isotope Laboratories (Woburn, MA, USA), D2O (99.9%) from CDN Isotopes (Pointe-Claire, QC, Canada), ethylene glycol from Acros Organics (Geel, Belgium) and 3-(trimethylsilyl)-1-propanesulfonic acid sodium salt (DSS) from Sigma-Aldrich (St Louis, MO, USA). All other chemicals were of the purest grade available from regular commercial sources.
Animals and Experiment Groups
All experiments were conducted in accordance with European Communities Council Directive of 1986 (86/609/EEC) and were approved by the Norwegian Animal Research Authority (Forsøksdyrutvalget). Two Sprague-Dawley rats (Scanbur AS, Nittedal, Norway), mated at the Comparative Medicine Core Facility at the Norwegian University of Science and Technology in Trondheim, gave birth to two litters of 8 (litter A) and 11 pups (litter B). Dams with litter were kept on a 12:12 hours light:dark cycle with food and water ad libitum until P7.
Hypoxia-Ischemia
The Vannucci model for hypoxic-ischemic brain injury was used in P7 rats.20 Unilateral severing of the carotid artery followed by hypoxia reduces ipsilateral cerebral blood flow and results in infarction to the ipsilateral hemisphere while the contralateral hemisphere is apparently unaffected.7 Pups from both litters and of both genders were randomly allocated to HI or sham operation. Pups (n=10; 4 from litter A, 6 from litter B; mean bodyweight=20.3±3.5 g) were anesthetized with isoflurane (4% induction, 2% maintenance in O2; Baxter, Allerød, Denmark) and placed on a water-heated thermal pad (Gaymar Industries Ltd., Orchard Park, NY, USA). The right common carotid artery was identified, thermo-cauterized, and severed. In sham-operated littermates, the carotid artery was identified under anesthesia, but not severed (n=9; 4 from litter A, 5 from litter B; mean bodyweight=20.6±3.4 g). The surgical procedure took 5 to 10 minutes. Pups were returned to their dam for recovery and feeding for a minimum of 2 hours and a maximum of 3 hours. Thereafter, pups were put in a fiberglass box inside an incubator where temperature and oxygen concentrations were constantly monitored. Temperature was kept at 36±0.5°C. The box was flushed with preheated humidified 8% O2 in 92% N2 and the oxygen concentration was kept constant for 90 minutes. After saturating the box with the desired gas concentration, flow was kept at 5 L/min during exposure. During hypoxia sham-operated littermates were kept separate from the dam in a heated atmosphere (36±0.5°C). Thirty minutes after hypoxia ended all pups were injected intraperitoneally with [1,2-13C]glucose (564 mg/kg, 0.3 mol/L) and decapitated 30 minutes later, which has earlier been reported as the optimal labeling time after a bolus injection of 13C-labeled substrates to study brain metabolism in the P7 rat.6 One animal in the sham group (from litter B) had to be excluded due to an error with the injection. Heads were snap-frozen in liquid N2 and stored at −80°C until extraction.
Extraction
Contralateral and ipsilateral hemispheres were dissected, weighed, and extracted separately using methanol and chloroform. Methanol was added and tissue was homogenized using a Vibra Cell sonicator (Model VCX 750; Sonics & Materials, Newtown, CT, USA). Subsequently, chloroform and water were added, the samples were centrifuged at 3,000 g for 15 minutes, and the supernatant was transferred to a new tube. Water was added to the second tube and the samples were centrifuged at 3,000 g for 15 minutes to separate the lipids from the supernatant with the water-soluble tissue extracts. The supernatant was transferred to a third tube and thereafter lyophilized and resuspended in D2O. At this point, a proportion was taken out for analysis with HPLC before the remaining sample was lyophilized once more to minimize the proton content of water before analysis with nuclear magnetic resonance (NMR) spectroscopy.
High-Performance Liquid Chromatography
Amino acids in cell extracts were quantified by high-performance liquid chromatography (HPLC) on a Hewlett Packard 100 system (Agilent Technologies, Palo Alto, CA, USA). Amino acids were precolumn derivatized with o-phthaldialdehyde and subsequently separated on a ZORBAX SB-C18 (4.6 × 150 mm, 3.5 μm) column from Agilent using a phosphate buffer (50 mmol/L, pH=5.9) and a solution of methanol (98.75%) and tetrahydrofurane (1.25%) as eluents. α-Amino butyric acid was used as an internal standard. The separated amino acids were detected with fluorescence and compared with a standard curve derived from standard solutions of amino acids. All amounts were corrected for tissue wet weight.
1H- and 13C- Nuclear Magnetic Resonance Spectroscopy
Lyophilized samples were dissolved in 120 μL D2O containing 0.01% ethylene glycol and 0.018% DSS and thereafter transferred to SampleJet tubes (3.0 × 103.5 mm) for insertion into the SampleJet auto sampler (Bruker BioSpin GmbH, Rheinstetten, Germany). Two samples from the HI group (one from the ipsilateral and one from the contralateral hemisphere, both from animals from litter B) had to be excluded due to experimental errors. All samples were analyzed on a 14.1T Ultra shielded Plus Avance III magnet (Bruker BioSpin GmbH) operating at 600 MHz (for 1H) using QCI CryoProbe (Bruker BioSpin GmbH). 1H-NMR spectra were accumulated with a pulse angle of 90°, 2.7 s acquisition time, and 10 s relaxation delay. The number of scans was 128. Proton decoupled 13C-NMR spectra were obtained using an acquisition time of 1.7 s, 0.5 s relaxation delay, and a 30° flip angle. Scans were accumulated at 30 kHz spectral width with 98 K data points. The number of scans was typically 11,000. Relevant peaks in the spectra were identified and integrated using the TopSpin 3.0 software (Bruker BioSpin GmbH). Concentrations of metabolites were calculated from the integrals of the peaks using DSS (1H-NMR spectra) or ethylene glycol (13C-NMR spectra) as internal quantification standards. Concentrations from the 1H-NMR spectra were corrected for the numbers of protons that constituted the peak. Correction factors for incomplete relaxation and nuclear Overhauser effects in the 13C spectra were obtained by acquiring scans with completely relaxed nuclei (relaxation delay of 20 s) and only a brief proton decoupling during the radiofrequency pulse shortly before the signal was recorded to avoid heteronuclear splitting of signals, but no proton decoupling for the remainder of the acquisition to avoid nuclear Overhauser effect. The singlets in the 13C-nuclear magnetic resonance spectroscopy (13C-NMRS) data were corrected for naturally abundant 13C by subtracting 1.1% of the total cellular contents obtained from 1H spectra. All amounts were corrected for tissue wet weight. Percent excess enrichment was calculated after subtracting natural abundance where appropriate, and is in the following referred to as percent enrichment.
Labeling Patterns after Injection of [1,2-13C]Glucose
If [1,2-13C]glucose is metabolized via glycolysis, then it will lead to [2,3-13C]pyruvate, which can be reduced to [2,3-13C]lactate or transaminated to [2,3-13C]alanine (Figure 1). [2,3-13C]Pyruvate can enter the TCA cycle via pyruvate dehydrogenation as [1,2-13C]acetyl CoA, leading to the formation of [1,2-13C]citrate. After several steps, α-[4,5-13C]ketoglutarate is formed, which can exit the TCA cycle and give rise to [4,5-13C]glutamate, [4,5-13C]glutamine, and [1,2-13C]GABA. If α-[4,5-13C]ketoglutarate remains in the TCA cycle, then the label will be scrambled at the step of the symmetric molecule succinate, leading to equal amounts of [1,2-13C]- and [3,4-13C]succinate, which can give rise to fumarate, malate, oxaloacetate, and aspartate labeled in the same positions. [1,2-13C]- or [3,4-13C]oxaloacetate can condense with acetyl CoA, leading to the formation of [3-13C]glutamate/glutamine or [1,2-13C]glutamate/glutamine and [4-13C]GABA or [3-13C]GABA from the second turn of the TCA cycle if the acetyl CoA is unlabeled. If it is labeled, then the molecules will in addition be labeled in the positions mentioned above from the first turn of the TCA cycle, i.e., [3,4,5-13C]glutamate or [1,2,4,5-13C]glutamate, [3,4,5-13C]glutamine or [1,2,4,5-13C]glutamine, and [1,2,3-13C]GABA or [1,2,4-13C]GABA.
Figure 1.

Simplified presentation of 13C labeling patterns of metabolites after injection of [1,2-13C]glucose. (A) Overview of the principal metabolic pathways investigated in this study. (B) Labeling patterns in lactate, alanine, aspartate, glutamate, glutamine, and GABA after metabolism of [1,2-13C]glucose. Circles symbolize the carbon backbone of the molecules. Red crosses mark the position of the label resulting from glycolysis, followed by conversion to acetyl CoA by PDH where applicable. A purple cross indicates that the pyruvate (resulting from glycolytic metabolism) has instead undergone pyruvate carboxylation before being converted to the metabolite in question. Green circles mark labeling from the PPP, also followed by conversion to acetyl CoA by PDH where applicable. A blue oval indicates that the pyruvate (resulting from metabolism in the PPP) has instead entered the TCA cycle via PC. After PC, the metabolite can undergo backflux from oxaloacetate to succinate. If the glucose has been metabolized via PPP before being converted to pyruvate and subjected to pyruvate carboxylation, then this will lead to distinct labeling patterns. These are marked as ‘BF' in the figure. For simplicity, only condensation of oxaloacetate with unlabeled acetyl CoA is shown for the second turn. BF, backflux; GS, glutamine synthetase; P, phosphate; PAG, phosphate activated glutaminase; PC, pyruvate carboxylase; PDH, pyruvate dehydrogenase; PPP, pentose phosphate pathway.
If [2,3-13C]pyruvate is instead subjected to pyruvate carboxylation, then this will lead to the formation of [2,3-13C]oxaloacetate. [2,3-13C]Oxaloacetate can be transaminated to form [2,3-13C]aspartate, or it can condense with acetyl CoA forming [3,4-13C]citrate. After several steps, α-[2,3-13C]ketoglutarate is formed, which can give rise to [2,3-13C]glutamate, [2,3-13C]glutamine, and [3,4-13C]GABA. If the label remains in the TCA cycle for a second turn, then it will give rise to equal amounts of [3-13C]glutamate and [1,2-13C]glutamate, [3-13C]glutamine and [1,2-13C]glutamine, and [3-13C]GABA and [4-13C]GABA if the acetyl CoA is unlabeled.
If [1,2-13C]glucose is metabolized via the PPP, then one of the labeled 13C atoms will be discarded as 13CO2, thus forming one molecule of [1-13C]ribulose-5-phosphate. If labeled pentose sugars are further metabolized in the nonoxidative stage of the PPP, then the carbon atoms are rearranged leading to a colocalization of two of the 13C within one of the molecules of fructose-6-phosphate. Thus, the metabolism of three molecules of [1,2-13C]glucose leads to the formation of one [1-13C]fructose, one [1,3-13C]fructose, and one unlabeled glyceraldehyde-3-phosphate. The fructose can reenter the glycolytic pathways where it can either go upstream to form [1-13C]glucose-6-phosphate/[1,3-13C]glucose-6-phosphate, or it can go downstream to form [3-13C]pyruvate/[1,3-13C]pyruvate. If [1-13C]glucose-6-phosphate reenters the PPP, then the label will be discarded and yield unlabeled pentose sugars. [3-13C]- and [1,3-13C]pyruvate can give rise to lactate or alanine labeled in the same positions. Thus, the amounts of lactate and alanine labeled in the C3 position reflect the labeling via the PPP. If metabolized via PDH, then both [3-13C]pyruvate and [1,3-13C]pyruvate will be converted to [2-13C]acetyl CoA, which can enter the TCA cycle forming [2-13C]citrate. Metabolism of [2-13C]citrate in the TCA cycle leads to [4-13C]glutamate/glutamine, [2-13C]GABA, and equal amounts of [2-13C]- and [3-13C]aspartate in the first turn. In the second turn, it will lead to [2-13C]glutamate/glutamine, [3-13C]glutamate/glutamine, [3-13C]GABA, [4-13C]GABA, and aspartate labeled equally in all four positions.
Calculations of Metabolic Ratios
Metabolism of [1,2-13C]glucose leads to clearly distinguishable labeling patterns at the level of lactate, alanine and in the metabolites arising from the first turn of the TCA cycle. In the second turn, however, isotopomers from several metabolic pathways will lead to similar labeling patterns and second turn metabolites were therefore not included in these calculations. Consequently, a necessary assumption for the following equations is that the different metabolic pathways are not associated with very different TCA cycling ratios.
Pentose phosphate pathway/glucose metabolism ratio
The sum of labeling from glucose via the PPP and the glycolysis is called GM. It should be noted that glucose can also be used for the synthesis of glycogen. Consequently, in these equations GM only denotes the catabolic glucose metabolism. Due to redistribution of the carbon atoms within the PPP, two labeled molecules of pyruvate correspond to the utilization of three molecules of [1,2-13C]glucose. In contrast, when metabolized via glycolysis, three labeled molecules of pyruvate correspond to the utilization of the same number of [1,2-13C]glucose molecules. Consequently, all values representing the PPP must be multiplied by 1.5 to adjust for this difference.
The PPP/GM ratio for lactate (lac) and alanine (ala) is calculated as:
 |
The PPP/GM ratio for glutamate (glu) can be calculated as:
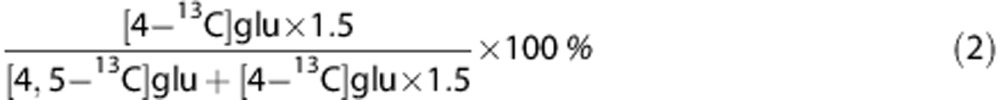 |
Since this calculation only includes labeling from PDH, and not from PC, it is less suitable for glutamine that is mainly situated in the astrocytic compartment and to a large extent labeled via PC.6
The PPP/GM ratio for GABA can be calculated as:
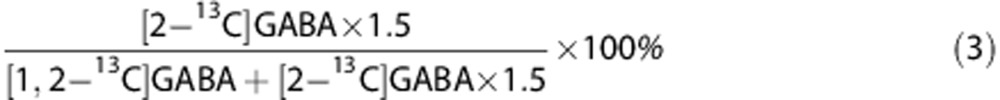 |
The sum of labeling in lactate, alanine, glutamate, glutamine (gln), and GABA from the two pathways can be combined to form an overall ratio of total PPP (PPPtot)/total GM (GMtot):
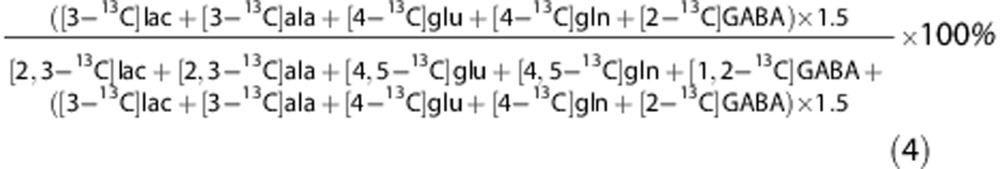 |
Pyruvate carboxylase/pyruvate dehydrogenase ratios
The PC/PDH ratio for glutamate and glutamine is calculated as:
 |
For GABA, the PC/PDH ratio will be:
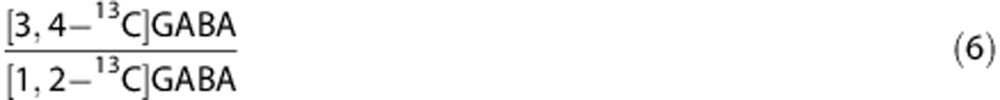 |
For aspartate (asp), the PC/PDH ratio is calculated using:
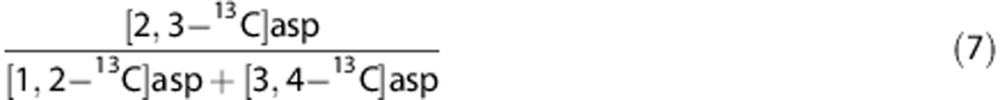 |
The sum of labeling in glutamate, glutamine, GABA, and aspartate from PC and PDH from the two pathways can be compared in an overall ratio of total PC (PCtot)/total PDH (PDHtot):
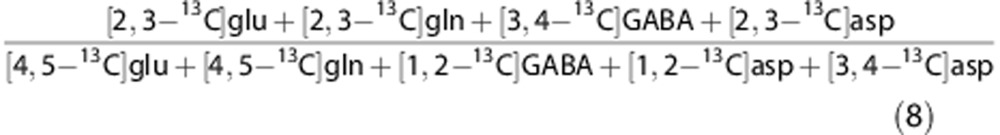 |
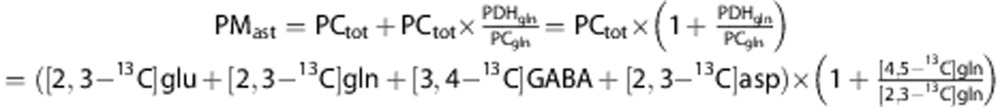
Astrocyte metabolism
The total glucose metabolized in astrocytes at the level of pyruvate (PMast) is the sum of pyruvate metabolized via PC and via PDH in astrocytes:
 |
Since pyruvate carboxylation only occurs in astrocytes, PCast can be represented by PCtot. Furthermore, since glutamine is mainly synthesized in astrocytes, the ratio of labeled glutamine via PDH (PDHgln) and PC (PCgln) can be used as an approximation of the proportional pyruvate metabolism via PDH versus PC in astrocytes. The pyruvate metabolized via PDH in astrocytes (PDHast) can therefore be approximated by:
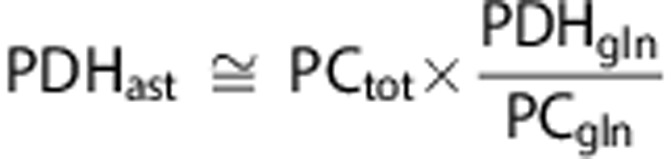 |
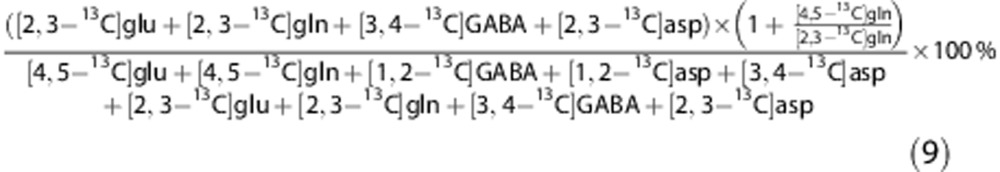
The total glucose metabolized in astrocytes at the level of pyruvate (PMast) can therefore be calculated as:
 |
This can further be used to calculate a ratio between glucose metabolized in astrocytes at the level of pyruvate, and the total amount of glucose metabolized at the level of pyruvate.
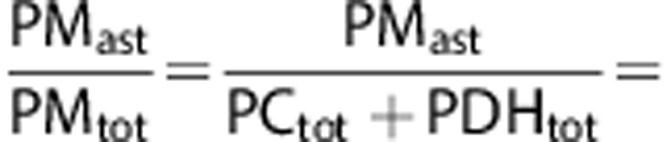 |
 |
Statistics
Data are presented as means±standard error of the mean (s.e.m.) or means±95% confidence intervals. Paired Student's t-tests were used to compare means between ipsi- and contralateral hemispheres from the same animal. Unpaired Student's t-tests were used to compare means from ipsi- and contralateral hemispheres, respectively, between experimental groups. Before choosing the adequate type of unpaired test, Levene's test for equal variances was performed. P<0.05 was chosen as the level of significance. All comparisons were made using two-tailed statistical tests.
Results
The main findings are summarized in Figure 2. There were no differences in the tissue wet weight between any of the groups (HI: 0.369±0.008 g ipsilateral, 0.357±0.011 g contralateral; Sham: 0.386±0.012 g ipsilateral, 0.373±0.018 g contralateral).
Figure 2.

The major overall metabolic changes in the ipsilateral and contralateral hemispheres of animals subjected to hypoxia-ischemia (HI) (n=9) compared with sham-operated animals (n=8) (ipsilateral versus ipsilateral and contralateral versus contralateral) based on results presented in Tables 1 and 3. Results are presented as the percent change relative to sham. The measure of variance is the s.e.m. as the percent of control. The values are based on the sum of amounts of several labeled metabolites except from the values for glucose, which are only based on changes in amounts of [1,2-13C]glucose. Glycolysis: sum of [2,3-13C]lactate and [2,3-13C]alanine. PPP: sum of [4-13C]glutamate, [4-13C]glutamine, [2-13C]GABA, [3-13C]lactate, and [3-13C]alanine. PC: sum of [2,3-13C]glutamate, [2,3-13C]glutamine, and [2,3-13C]aspartate. PDH: sum of [4,5-13C]glutamate, [4,5-13C]glutamine, [1,2-13C]GABA, [1,2-13C]aspartate, and [3,4-13C]aspartate. To test for differences, an unpaired Student's t-test was applied. *P<0.05, **P<0.01, ***P<0.001. The metabolic pathway is marked as ‘n.s.' when no significant differences were found. n.s., not significantly different from control; PC, pyruvate carboxylase; PDH, pyruvate dehydrogenase; PPP, pentose phosphate pathway.
Figure 3 shows excerpts from typical 13C-NMR spectra after injection of [1,2-13C]glucose. The doublets of [4,5-13C]glutamate and [4,5-13C]glutamine were lower in the animals subjected to HI especially in the ipsilateral hemisphere (Figure 3C), reflecting reduced labeling of glutamate via PDH. Peaks corresponding to labeling from PC in glutamate and glutamine ([2,3-13C]glutamate and [2,3-13C]glutamine) were visible in all the spectra, showing that PC was present after HI.
Figure 3.

13C-nuclear magnetic resonance (13C-NMR) spectra of brain extracts of: (A) sham-operated animal; (B) the contralateral hemisphere of an HI animal; (C) the ipsilateral hemisphere of an HI animal. The horizontal axis has been truncated at several places. The peaks of lactate, alanine, glutamate, glutamine, GABA, aspartate, NAA, creatine, and taurine are marked. All ‘singlets' are marked in (C) while the ‘doublets' are marked in (B) or (A). The isotopomers for NAA, creatine, and taurine were not labeled above natural abundance. HI, hypoxic-ischemia; NAA, N-acetyl aspartate; p.p.m., parts per million.
Glucose, Lactate, and Alanine
There were increased amounts of glucose, both labeled and unlabeled in both hemispheres compared with sham (Table 1; Figure 2), whereas the total amount of lactate and the amount of [2,3-13C]lactate were not significantly increased. The percent enrichment in lactate was reduced by 20% in the contralateral hemisphere compared with sham. The total amount of alanine was doubled in the contralateral hemisphere and tripled in the ipsilateral hemisphere while the percent enrichment of [2,3-13C]alanine was reduced in both hemispheres.
Table 1. Total amounts, 13C labeled isotopomers and % enrichment in glucose, lactate, and alanine.
| Amounts (nmol/g tissue) or % excess enrichment (%) |
Sham, n=8 |
HI, n=9 |
Si versus HIi | Sc versus HIc | Si versus Sc | HIi versus HIc | ||
|---|---|---|---|---|---|---|---|---|
| Ipsilateral | Contralateral | Ipsilateral | Contralateral | |||||
| Glucose | ||||||||
| Total | 1,577±139 | 1,551±121 | 2,234±163 | 2,525±137 | ** | *** | * | |
| [1,2-13C] | 621±43 | 622±36 | 783±46 | 897±49 | * | *** | 0.07 | |
| % [1,2-13C] | 34.5±1.1 | 35.5±0.9 | 31.6±1.3 | 31.7±1.0 | * | |||
| Lactate | ||||||||
| Total | 2,220±149 | 2,206±456 | 2,617±238 | 2,423±529 | 0.08 | |||
| [2,3-13C] | 160.9±5.1 | 156.6±7.8 | 167.0±18.5 | 145.4±9.2 | ||||
| [3-13C] | 6.5±0.8 | 5.8±0.7 | 1.1±0.6 | 4.1±1.2 | *** | |||
| % [2,3-13C] | 7.38±0.30 | 7.57±0.24 | 6.42±0.52 | 6.11±0.38 | ** | |||
| % [3-13C] | 0.29±0.04 | 0.28±0.03 | 0.04±0.02 | 0.16±0.05 | *** | 0.07 | ||
| Alanine | ||||||||
| Total | 588±51 | 554±33 | 1,692±197 | 1,033±101 | ** | ** | ** | |
| [2,3-13C] | 36.5±0.7 | 35.1±1.0 | 68.7±9.3 | 40.7±3.0 | ** | ** | ||
| [3-13C] | 0.9±0.2 | 1.1±0.2 | 0.5±0.3 | 0.0±0.0 | ** | |||
| % [2,3-13C] | 6.48±0.49 | 6.49±0.42 | 4.18±0.45 | 4.27±0.53 | ** | ** | ||
| % [3-13C] | 0.18±0.05 | 0.21±0.04 | 0.04±0.02 | 0.01±0.00 | * | ** | ||
NMRS, nuclear magnetic resonance spectroscopy; P7, postnatal day 7.
P7 rats were injected with [1,2-13C]glucose and brain extracts were analyzed using 1H-NMRS (total amounts) and 13C-NMRS (labeled amounts). For more details, see Materials and Methods. Results are presented as mean±s.e.m. Animals subjected to hypoxia-ischemia (HI) were compared with sham-operated animals (ipsilateral versus ipsilateral and contralateral versus contralateral) using an unpaired Student's t-test while ipsi- and contralateral hemispheres within each animal were compared using a paired Student's t-test. P values are given in the four columns to the right: Si versus HIi=ipsilateral sham versus ipsilateral HI; Sc versus HIc=contralateral sham versus contralateral HI; Si versus Sc=ipsi- versus contralateral hemisphere in sham; HIi versus HIc=ipsi- versus contralateral hemisphere in HI. Near significant P values (<0.1) are given in numbers. *P<0.05, **P<0.01, ***P<0.001.
Amounts of Central Metabolites
The total amounts of central metabolites are listed in Table 2. There were no differences in glutathione, taurine, or creatine when comparing HI and sham-operated animals. In the ipsilateral hemisphere, there were increased amounts of GABA, serine, glycine, threonine, tyrosine, tryptophan, and methionine while these amino acids were all unaltered in the contralateral hemisphere compared with sham. Compared with sham, amounts of valine, phenylalanine, and branched chain amino acids were increased in both hemispheres, with the exception of the amounts of isoleucine in the contralateral hemisphere.
Table 2. Total amounts of central metabolites.
| Amounts (nmol/g tissue) |
Sham, n=8 |
HI, n=9 |
Si versus HIi | Sc versus HIc | Si versus Sc | HIi versus HIc | ||
|---|---|---|---|---|---|---|---|---|
| Ipsilateral | Contralateral | Ipsilateral | Contralateral | |||||
| Glutathione | 904±27 | 836±25 | 824±36 | 877±28 | 0.10 | * | ||
| Taurine | 7,532±206 | 7,482±222 | 7,370±205 | 7,875±223 | * | |||
| Creatinea | 5,045±168 | 4,910±66 | 4,724±152 | 5,087±70 | 0.09 | * | ||
| Myo-inositola | 2,724±316 | 2,180±62 | 2,151±73 | 2,621±252 | 0.08 | |||
| NAAa | 1,718±69 | 1,658±38 | 1,611±70 | 1,691±46 | ||||
| Succinatea | 138±10 | 122±3 | 127±5 | 133±6 | ||||
| Fumaratea | 31±3 | 30±2 | 29±1 | 34±2 | 0.09 | |||
| Glutamate | 4,351±175 | 4,117±161 | 3,836±142 | 4,520±175 | * | * | ||
| GABA | 906±33 | 887±67 | 1,327±105 | 970±147 | ** | ** | ||
| Glutamine | 2,658±39 | 2,554±37 | 2,423±83 | 2,654±69 | * | ** | ||
| Aspartate | 1,978±78 | 1,887±28 | 1,640±57 | 1,716±112 | ** | |||
| Serine | 859±20 | 808±23 | 1,023±67 | 829±33 | * | ** | ||
| Glycine | 585±9 | 565±15 | 725±39 | 524±18 | ** | ** | ||
| Threonine | 601±14 | 572±11 | 755±25 | 616±23 | *** | *** | ||
| Tyrosine | 213±21 | 202±21 | 391±55 | 207±17 | ** | ** | ||
| Tryptophan | 33±1 | 33±2 | 64±6 | 38±2 | *** | 0.06 | *** | |
| Methionine | 21±2 | 19±1 | 37±6 | 16+1 | * | ** | ||
| Valine | 27±2 | 26±2 | 108±20 | 33±1 | ** | ** | ** | |
| Phenylalanine | 33±3 | 32±2 | 86±9 | 45±3 | *** | ** | ** | |
| Isoleucine | 21±2 | 21±2 | 45±6 | 22±0 | ** | ** | ||
| Leucine | 72±10 | 68±7 | 158±26 | 90±6 | * | * | ||
| Lysine | 101±5 | 99±5 | 243±31 | 134±5 | ** | *** | ** | |
HI, hypoxia-ischemia; HPLC, high-performance liquid chromatography; NMRS, nuclear magnetic resonance spectroscopy; P7, postnatal day 7; NAA, N-acetyl aspartate.
Brain extracts of ipsi- and contralateral hemispheres from P7 rats subjected to HI were analyzed using 1H-NMRS and HPLC. For more details, see Materials and methods. Results are presented as mean±s.e.m. P values are given in the four columns to the right: Si versus HIi=ipsilateral sham versus ipsilateral HI; Sc versus HIc=contralateral sham versus contralateral HI; Si versus Sc=ipsi- versus contralateral hemisphere in sham; HIi versus HIc=ipsi- versus contralateral hemisphere in HI. The near significant P values (<0.1) are given in numbers. *P<0.05, **P<0.01, ***P<0.001.
Indicates that the results are from 1H-NMRS.
Pentose Phosphate Pathway Activity
The amount of [3-13C]lactate was significantly reduced in the ipsilateral, but not in the contralateral hemisphere (Table 1). However, the amount of [3-13C]alanine from PPP was only significantly reduced in the contralateral hemisphere compared with sham. However, the percent enrichment of [3-13C]alanine was reduced in both hemispheres. Labeling of glutamate via PPP followed by PDH was reduced in both hemispheres (Table 3). After HI, the PPP/GM ratios were clearly reduced in both ipsi- and contralateral hemispheres (Figure 4A), except for lactate in the contralateral hemisphere. The observed reductions of 13C label in lactate, glutamate, and alanine could have been caused by increased cycling between the glycolysis and the PPP, and thus reflect an actual increase in PPP activity. To evaluate this possibility, the amount of [1-13C]glucose, one of the products of such cycling, was quantified. However, no increase was found, thereby confirming that labeling via PPP was in fact reduced after HI. The PPP/GM ratios in sham-operated animals were lower than those earlier reported for the neonatal brain6 (glutamate, P<0.05, lactate and alanine, P<0.001).
Table 3. Labeled amounts and % enrichment in glutamate, glutamine, GABA, and aspartate.
| Amounts (nmol/g tissue) or % excess enrichment (%) |
Sham, n=8 |
HI, n=9 |
Si versus HIi | Sc versus HIc | Si versus Sc | HIi versus HIc | ||
| |
Ipsilateral |
Contralateral |
Ipsilateral |
Contralateral |
|
|
|
|
| Glycolysis and PDH | ||||||||
| [4,5-13C] Glutamate | 189.8±18.6 | 193.5±22.6 | 109.3±10.3 | 136.3±17.2 | ** | 0.06 | * | |
| [1,2-13C] GABA | 15.5±1.7 | 15.0±1.5 | 7.6±1.1 | 8.8±1.5 | *** | ** | ||
| [4,5-13C] Glutamine | 32.5±4.3 | 32.8±4.4 | 17.8±2.0 | 20.3±2.7 | * | * | ||
| [1,2-13C] Aspartate | 24.6±3.2 | 24.1±3.4 | 11.7±1.3 | 14.0±2.1 | ** | * | 0.09 | |
| [3,4-13C] Aspartate | 28.5±3.4 | 30.2±3.8 | 15.3±1.9 | 18.5±2.6 | ** | * | 0.08 | * |
| [1,2-13C] Glutamate | 28.4±2.3 | 28.4±3.1 | 15.5±2.0 | 19.9±2.9 | *** | 0.06 | 0.08 | |
| [1,2-13C] Glutamine | 6.8±0.9 | 6.6±0.5 | 4.5±0.3 | 5.1±0.6 | * | 0.06 | ||
| % [4,5-13C] Glutamate | 4.52±0.60 | 4.68±0.60 | 2.66±0.25 | 2.94±0.36 | * | * | 0.06 | |
| % [1,2-13C] GABA | 1.40±0.20 | 1.34±0.14 | 0.47±0.08 | 0.73±0.13 | ** | ** | * | |
| % [4,5-13C] Glutamine | 1.23±0.17 | 1.29±0.18 | 0.74±0.08 | 0.77±0.10 | * | * | ||
| % [1,2-13C] Aspartate | 2.14±0.25 | 2.14±0.25 | 1.22±0.11 | 1.33±0.17 | ** | * | ||
| % [3,4-13C] Aspartate | 2.48±0.27 | 2.69±0.26 | 1.59±0.15 | 1.78±0.19 | * | * | ** | * |
| % [1,2-13C] Glutamate | 0.67±0.07 | 0.69±0.08 | 0.37±0.04 | 0.43±0.06 | ** | * | ||
| % [1,2-13C] Glutamine | 0.26±0.03 | 0.26±0.02 | 0.19±0.02 | 0.19±0.02 | 0.08 | * | ||
| PPP and PDH | ||||||||
| [4-13C] Glutamate | 8.0±2.3 | 8.8±2.4 | 0.5±0.3 | 1.7±0.9 | * | * | ||
| [2-13C] GABA | NA | NA | NA | NA | ||||
| [4-13C] Glutamine | NA | NA | NA | NA | ||||
| % [4-13C] Glutamate | 0.20±0.06 | 0.22±0.06 | 0.01±0.01 | 0.04±0.02 | * | * | ||
| % [2-13C] GABA | NA | NA | NA | NA | ||||
| % [4-13C] Glutamine | NA | NA | NA | NA | ||||
| Glycolysis and PC | ||||||||
| [2,3-13C] Glutamate | 15.7±0.8 | 15.8±1.2 | 12.6±0.8 | 13.8±1.3 | * | |||
| [3,4-13C] GABA | ND | ND | ND | ND | ||||
| [2,3-13C] Glutamine | 24.9±2.1 | 23.9±2.7 | 17.2±1.8 | 20.8±2.7 | * | 0.07 | ||
| [2,3-13C] Aspartate | 10.1±0.9 | 9.9±0.8 | 5.8±0.6 | 6.0±0.9 | *** | ** | ||
| % [2,3-13C] Glutamate | 0.37±0.03 | 0.38±0.03 | 0.31±0.02 | 0.30±0.03 | 0.13 | 0.06 | ||
| % [3,4-13C] GABA | ND | ND | ND | ND | ||||
| % [2,3-13C] Glutamine | 0.94±0.08 | 0.94±0.11 | 0.71±0.08 | 0.79±0.11 | 0.07 | |||
| % [2,3-13C] Aspartate | 0.89±0.07 | 0.90±0.05 | 0.62±0.06 | 0.58±0.07 | ** | ** | ||
HI, hypoxic-ischemia; ND, not detectable; NA, not labeled above natural abundance; PC, pyruvate carboxylase; PDH, pyruvate dehydrogenase; PPP, pentose phosphate pathway; NMRS, nuclear magnetic resonance spectroscopy; P7, postnatal day 7.
P7 rats were injected with [1,2-13C]glucose and brain extracts were analyzed using 13C-NMRS. For more details, see Materials and Methods. Results are presented as mean±s.e.m. Isotopomeres labeled via the same metabolic pathways are listed together: top=labeled via glycolysis followed by PDH; middle=labeled via PPP followed by PDH; bottom=labeled via glycolysis followed by PC. P values are given in the four columns to the right: Si versus HIi=ipsilateral sham versus ipsilateral HI; Sc versus HIc=contralateral sham versus contralateral HI; Si versus Sc=ipsi- versus contralateral hemisphere in sham; HIi versus HIc=ipsi- versus contralateral hemisphere in HI. Near significant P values (<0.1) are given in numbers. *P<0.05, **P<0.01, ***P<0.001.
Figure 4.

Rat pups (Sham n=8, HI n=9) were injected with [1,2-13C]glucose on postnatal day 7. Brain extracts were analyzed using 13C-nuclear magnetic resonance spectroscopy (13C-NMRS). (A) Pentose phosphate pathway activity given in percent of glucose metabolism (sum of PPP and glycolysis). (B) Pyruvate carboxylase/pyruvate dehydrogenase ratios: a value of 1 indicates equal amounts of labeling via pyruvate carboxylase and pyruvate dehydrogenase. The ‘Total' represents the sum of all relevant metabolites, also including glutamine and GABA for the PPP/GM ratio and including GABA for the PC/PDH ratio. For more details, see Materials and Methods. Results are presented as mean±95% confidence intervals. Animals subjected to HI were compared with sham-operated animals (ipsilateral versus ipsilateral and contralateral versus contralateral) using an unpaired Student's t-test. Also, the two hemispheres in each animal were compared using a paired Student's t-test, but no significant differences were found. *P<0.05, **P<0.01, ***P<0.001. Contra, contralateral; HI, hypoxia-ischemia; ipsi, ipsilateral; GM, glucose metabolism (sum of glycolysis and PPP); PC, pyruvate carboxylase; PDH, pyruvate dehydrogenase; PPP, pentose phosphate pathway.
Pyruvate Carboxylase and Pyruvate Dehydrogenase Activity
Amounts of aspartate, glutamine, and glutamate labeled via PC activity (Table 3; Figure 2) as well as total amounts of these metabolites (Table 2) were reduced in the ipsilateral hemisphere after HI. In the contralateral hemisphere, there was no significant reduction in amounts or labeling from PC activity in glutamate or glutamine compared with sham. However, there was reduced labeling in aspartate (Table 3) while total amounts of aspartate (Table 2) were preserved.
In both hemispheres, labeling via PDH (Table 3; Figure 2) was reduced. Notably, the percent enrichment in glutamate, glutamine, aspartate, and GABA was all reduced by >40% in the ipsilateral hemisphere, and by >30% in the contralateral hemisphere.
The ratios between labeling via PC and PDH (Figure 4B) in glutamine and glutamate in the sham-operated animals were in good accordance with earlier reported values for the neonatal brain.6 After HI, the PC/PDH ratios were unaltered in aspartate while it was increased in glutamate ipsilaterally and in glutamine contralaterally. The total PC/PDH ratios were increased in both hemispheres. In addition, astrocytes were metabolizing a larger proportion of the glucose at the level of pyruvate in the ipsilateral hemisphere (PMast/PMtot ratio: HI: 37.3±0.9% versus Sham: 34.2±0.5%, P value=0.010).
TCA Cycling and Pyruvate Recycling
[1,2-13C]glutamate and [1,2-13C]glutamine are the result of TCA cycling. The amounts of these metabolites and the percent enrichment in these positions were significantly or near significantly reduced (Table 3). [5-13C]glutamate and [5-13C]glutamine were not present above the level of natural abundance, indicating that there was not enough pyruvate recycling to reach detectable levels (data not shown), in accordance with earlier reports.6
Hemisphere Differences in Sham Animals
Apart from amounts of glutathione (Table 2: 8% higher in the ipsilateral hemisphere) and percent enrichment in [3,4-13C]aspartate (Table 3: 8.5% higher in the contralateral hemisphere), there were no significant differences between hemispheres in sham-operated animals. The observed differences in glutathione and [3,4-13C]aspartate were small and it is unlikely that they have an actual biologic significance.
Discussion
During immediate recovery after neonatal HI, we found profound changes in the ipsilateral (hypoxic-ischemic) hemisphere in the metabolism of glucose (see Figure 2), many of which were contrary to what was expected based on earlier reports from the adult brain. The PPP activity was reduced and there were indications of mitochondrial hypometabolism. Glucose metabolism via PC was relatively preserved compared with metabolism via PDH. Interestingly, also in the contralateral (hypoxic) hemisphere, which is supposedly unaffected in this model of neonatal HI, the overall PPP activity was reduced and there were indications of mitochondrial hypometabolism.
Glucose Uptake, Glycolysis, and the TCA Cycle
Increased amounts of glucose were found in the ipsilateral hemisphere after HI. In combination with the normal percent enrichment in glucose, this confirms earlier findings of rapid reperfusion via collateral circulation in this model.21 Moreover, the finding of bilaterally increased amounts of glucose is in good accordance with earlier studies by Vannucci et al.5 Total glucose metabolism cannot be accounted for without measurements of glycogen and CO2, which were not performed in the present study. However, even though glycogen synthesis increases in the recovery phase after neonatal HI,22 it is still possible to compare the relative contributions to glucose catabolism of PPP versus glycolysis by analyzing labeling patterns in lactate and alanine.
Glycolysis appears to be normalized within 60 minutes of reperfusion
During HI, glucose utilization via anaerobic glycolysis increases dramatically to continue adenosine triphosphate (ATP) generation, resulting in an accumulation of lactate and a rapid depletion of brain glucose.23 Such an increased anaerobic glycolytic flux during HI was supported by an increase in lactate after 30 minutes of reperfusion (three-fold, unpublished results), while at 60 minutes the levels of lactate were no longer increased. This rapid decline in lactate levels is in line with earlier reports,23 and contrast the prolonged lactate elevation after adult ischemia.24 The cause may be that upon reperfusion unlabeled lactate accumulated during HI was rapidly metabolized or released into the blood, since the neonatal brain has both a higher ability to use lactate as an energy substrate25 and a higher transport capacity for lactate over the blood brain barrier.26 The lower lactate levels together with normal amounts of lactate labeled from glycolysis at 60 minutes of reperfusion suggest that the glycolytic flux was no longer increased, or that there was a compensatory increased clearance to the blood.
Mitochondrial hypometabolism
After HI, there was a clear reduction in labeling from PDH in glutamate, glutamine, aspartate, and GABA in the ipsilateral hemisphere. At the same time, there was a decrease in the amount of glutamate and an increase in the amounts of amino acids that can be substrates for transamination of α-ketoglutarate for glutamate formation; alanine, valine, phenylalanine, isoleucine, leucine, and lysine. The above indicates that glutamate formation and turnover were reduced. This reduction was also reflected in its products glutamine and GABA. Summarized, this suggests that ipsilateral mitochondrial glucose metabolism was reduced after HI. Such hypometabolism will lead to impaired production of high-energy phosphates, which has indeed been reported in the ipsilateral hemisphere after neonatal HI.27 Some of the factors pointing to mitochondrial hypometabolism were also present in the contralateral hemisphere, differing from Yager et al27 who reported unaltered levels of ATP, thus suggesting normal mitochondrial function in the contralateral hemisphere. Utilization of unlabeled lactate accumulated during HI may account for part of the bilateral reduction in labeling from PDH in glutamate, glutamine, aspartate, and GABA. However, the percent enrichment in lactate in the ipsilateral hemisphere was not reduced, while that of glutamate, glutamine, aspartate, and GABA was reduced by >40%, indicating that dilution of label from unlabeled lactate may not explain the entire difference.
The Pentose Phosphate Pathway
The PPP/GM ratios in sham animals were lower than what has earlier been reported for the neonatal brain.6 However, several factors in the sham procedure distinguished this group from animals under physiologic conditions, such as the brief period of anesthesia, surgery and also the separation from the dam for 90 minutes when HI animals were exposed to hypoxia. Therefore, the difference in ratios emphasizes the necessity of adequate shams in experimental studies of HI.
Pentose phosphate pathway activity was reduced after neonatal hypoxia-ischemia
The PPP activity was clearly reduced in the ipsilateral hemisphere after HI (Figures 2 and 4). In the contralateral hemisphere, PPP/GM ratios were reduced in glutamate and alanine, but not in lactate. Just as for labeling via PDH after glycolysis, less labeling via PPP in glutamate and alanine could be due to the large accumulation of lactate during HI and a consequential dilution of label downstream of lactate. Mitochondrial hypometabolism could also have contributed to lower labeling in glutamate via the PPP. Since PPP activity in lactate was not significantly reduced in the contralateral hemisphere, the PPP may have been less severely affected in the contralateral compared with the ipsilateral hemisphere where it was clearly reduced. Another possible explanation is that there are several ‘metabolic compartments' related to the PPP in the brain, i.e., different activities of the PPP in astrocytes, neurons, and oligodendrocytes, predominantly leading to PPP-related labeling in different substances (lactate, glutamate, and alanine), and that hypoxia and HI affect PPP activity differently in these cells.
The reduction in pentose phosphate pathway activity may be linked to lower defense against reactive oxygen species
Compared with upregulation of the PPP after insults that induce oxidative stress in adults,12, 13 the pronounced downregulation in the neonatal brain after HI was surprising. However, this is in line with evidence that the neonatal brain is more vulnerable to oxidative stress.10 If the observed reduction in PPP activity leads to a reduction in the defense against reactive oxygen species, then it should be correlated with changes in activity of glutathione reductase and glutathione peroxidase, since NADPH generated from the PPP is a cofactor for glutathione reductase. Indeed, 2 hours after neonatal HI in mice, glutathione peroxidase activity was reduced by 50%.28 In rats subjected to HI, superoxide dismutase activity increased while glutathione peroxidase and catalase activity remained stable,29 a combination associated with accumulation of H2O2.10 Thus, the observed reduction in PPP activity may be an important component in the high susceptibility to oxidative stress in the neonatal brain and the pathway may be an interesting therapeutic target to reduce the detrimental consequences of neonatal HI for long-term brain function. We did not observe changes in total glutathione, which is in line with earlier reports.30 However, whether glutathione was oxidized is not known since our method did not differentiate between the reduced and oxidized forms.
Is glycolysis prioritized?
Via glycolysis, three molecules of glucose yield six molecules of pyruvate, six ATPs, and six molecules of NADH. However, via the PPP one carbon atom is lost in the first oxidative step. It follows that three molecules of glucose via the PPP yield five pyruvate molecules and five ATPs, thus an ∼17% reduction in ATP generation when compared with glycolysis only. In the immediate recovery after neonatal HI there is severe energy deprivation and, as we have shown, continued mitochondrial hypometabolism in the ipsilateral hemisphere. It therefore seems probable that ATP production via glycolysis is maximized during recovery. From in vitro experiments with neurons there is evidence for a tight regulatory link between the PPP and the glycolysis.31 Moreover, glutamate excitotoxicity, part of the injury cascade after HI, is also associated with increased glycolysis and reduced PPP activity in vitro.32 However, as mentioned above, the normal amounts of labeled lactate suggest that glycolysis was not enhanced at this time point, while PPP activity was reduced. If glycolysis is indeed normalized, then the depression of PPP should be mediated by a mechanism which deactivated PPP without enhancing glycolysis, or which deactivated PPP for a longer time than it stimulated glycolysis.
Pyruvate Carboxylation
Pyruvate carboxylase activity was reduced after hypoxia-ischemia, but not as much as pyruvate dehydrogenase activity
Labeling via PC activity was impaired in the ipsilateral (hypoxic-ischemic) hemisphere while it was preserved in the contralateral (hypoxic) hemisphere after neonatal HI (Figure 2), whereas there was no detectable PC activity after ischemia in adult rats.18 A limitation of the current study was the lack of differentiation between ipsilateral severely and moderately injured tissue, since the whole hemisphere was analyzed in one sample. Nevertheless, there are clear differences when comparing PC in neonatal HI versus adult ischemia. In neonatal HI, PC activity, although reduced, was relatively preserved compared with mitochondrial glucose metabolism via PDH, as shown by the increase in the total ratio for PC/PDH in both hemispheres. This is in contrast to adult ischemia where the reduction in PC is more pronounced than that of PDH.18, 19
Since glutamine is only synthesized in glia33 and most of the glutamate is localized in neurons34 the proportional decrease in labeling via PDH in glutamine and glutamate suggests a similar inhibition of mitochondrial metabolism in both cellular compartments. However, due to the concurrent relative preservation of labeling via PC, astrocytes metabolize a larger proportion of the available glucose at the level of pyruvate after HI, shown by the increase in PMast/PMtot ratio (see Results). The presence of both PC activity and synthesis of glutamine, two ATP demanding processes, implies that astrocytes have at least partly maintained or reestablished their energy balance at this time point after neonatal HI.
Possible implications for metabolic interactions between astrocytes and neurons and excitotoxicity
We found decreased levels of total glutamate and decreased neurotransmitter synthesis shown in the reduction of percent enrichment in glutamate via PDH. However, neonatal HI causes a dramatic immediate release of glutamate into the extracellular compartment due to depolarization of cells after the initial energy failure.35, 36 This increase in extracellular concentration is counteracted by washout into the blood and the cerebrospinal fluid36 and uptake into astrocytes.37 In this context, it is of interest to note that contribution from PC, representing actual de novo synthesis of glutamate, was preserved after neonatal HI. In addition, the PC/PDH ratio was increased in glutamate in the ipsilateral hemisphere. Anaplerosis may be beneficial if the neurons have a reduction in the concentration of TCA cycle intermediates after the massive release of glutamate into the extracellular space during HI. Under these conditions, glutamine transferred from astrocytes may be necessary for neurons to reestablish oxidative metabolism after HI. De novo glutamine synthesis may also be beneficial in relation to ammonia detoxification. Indeed, Pimentel et al38 have described increased activity of enzymes that can generate ammonia in the immediate phase after HI in P7 rats. However, glutamate release has been shown to continue during recovery with a secondary rise around 6 hours.35, 36 The susceptibility to excitotoxic injury is high in the neonatal brain, possibly due to an abundance of hyper-excitable glutamate receptors (reviewed in Sanchez and Jensen39). Moreover, early in brain development astrocytes have few glutamate transporters (GLT-1 and GLAST)37 and there is little transfer of glutamate from neurons to astrocytes under normal conditions, possibly indicating low glutamate uptake.6 This may be an important factor for the high sensitivity to excitotoxicity in the neonatal brain. Consequently, continued replenishment of the glutamate neurotransmitter pool via PC in astrocytes during recovery after neonatal HI may contribute to excitotoxicity in cells with dysfunctional energy metabolism.
GABA
There was a clear accumulation of GABA in the ipsilateral hemisphere after neonatal HI, in line with reports of adult ischemia.18, 19 The decreased amounts of label and the proportionally more reduced percent enrichment with [1,2-13C]GABA compared with [4,5-13C]glutamate indicate that both the production and the degradation of GABA were decreased. Consequently, the accumulation of GABA must have been caused by decreased degradation. In contrast to the inhibitory and neuroprotective properties of GABA in the adult brain, it can act as an excitatory neurotransmitter in the neonatal brain (reviewed by Ben-Ari40). Thus, it is conceivable that an increase in GABA after HI may contribute to excitotoxicity in the neonatal brain.
Conclusion
During recovery after neonatal HI, glucose metabolism via the PPP was reduced in both ipsi- and contralateral hemispheres and glucose metabolism via pyruvate carboxylation was relatively preserved compared with metabolism via PDH. Future studies should explore whether this paradoxical downregulation of the PPP may contribute to the increased susceptibility of the neonatal brain to oxidative stress and whether continued de novo synthesis of glutamate may contribute to excitotoxicity in the immediate recovery phase after HI. Alterations in these central metabolic pathways may represent future therapeutic targets in the treatment of neonatal HI.
Acknowledgments
The NMR spectroscopy was performed at the MR Core Facility at NTNU. The technical assistance of Lars Evje is gratefully acknowledged.
The authors declare no conflict of interest.
Footnotes
This work was supported by a grant from the Liaison Committee between the Central Norway Regional Health Authority (RHA) and the Norwegian University of Science and Technology (NTNU; to TSM) and from the Medical Faculty at NTNU (EMFB).
References
- Lai MC, Yang SN. Perinatal hypoxic-ischemic encephalopathy. J Biomed Biotechnol. 2011;2011:609813. doi: 10.1155/2011/609813. [DOI] [PMC free article] [PubMed] [Google Scholar]
- Northington FJ, Ferriero DM, Graham EM, Traystman RJ, Martin LJ. Early neurodegeneration after hypoxia-ischemia in neonatal rat is necrosis while delayed neuronal death is apoptosis. Neurobiol Dis. 2001;8:207–219. doi: 10.1006/nbdi.2000.0371. [DOI] [PubMed] [Google Scholar]
- Thurston JH, McDougal DB., Jr. Effect of ischemia on metabolism of the brain of the newborn mouse. Am J Physiol. 1969;216:348–352. doi: 10.1152/ajplegacy.1969.216.2.348. [DOI] [PubMed] [Google Scholar]
- Hawkins RA, Williamson DH, Krebs HA. Ketone-body utilization by adult and suckling rat brain in vivo. Biochem J. 1971;122:13–18. doi: 10.1042/bj1220013. [DOI] [PMC free article] [PubMed] [Google Scholar]
- Vannucci RC, Yager JY, Vannucci SJ. Cerebral glucose and energy utilization during the evolution of hypoxic-ischemic brain damage in the immature rat. J Cereb Blood Flow Metab. 1994;14:279–288. doi: 10.1038/jcbfm.1994.35. [DOI] [PubMed] [Google Scholar]
- Morken TS, Brekke E, Haberg A, Wideroe M, Brubakk AM, Sonnewald U.Neuron-astrocyte interactions, pyruvate carboxylation and the pentose phosphate pathway in the neonatal rat brain Neurochem Res 2013. doi: 10.1007/s11064-013-1014-3(e-pub ahead of print). [DOI] [PubMed]
- Vannucci RC, Vannucci SJ. Perinatal hypoxic-ischemic brain damage: evolution of an animal model. Dev Neurosci. 2005;27:81–86. doi: 10.1159/000085978. [DOI] [PubMed] [Google Scholar]
- Ben-Yoseph O, Boxer PA, Ross BD. Noninvasive assessment of the relative roles of cerebral antioxidant enzymes by quantitation of pentose phosphate pathway activity. Neurochem Res. 1996;21:1005–1012. doi: 10.1007/BF02532410. [DOI] [PubMed] [Google Scholar]
- McKenna MC, Dienel GA, Sonnewald U, Waagepetersen HS, Schousboe A.Energy metabolism of the brainIn: Siegel G, Albers W, Price D, Brady S, (eds). Basic neurochemistry8th edn.Elsevier: London; 2012223–258. [Google Scholar]
- Volpe JJ.Neurology of the newborn5th edSaunders: Philadelphia; 2008 [Google Scholar]
- Vento M, Asensi M, Sastre J, Garcia-Sala F, Pallardo FV, Vina J. Resuscitation with room air instead of 100% oxygen prevents oxidative stress in moderately asphyxiated term neonates. Pediatrics. 2001;107:642–647. doi: 10.1542/peds.107.4.642. [DOI] [PubMed] [Google Scholar]
- Bartnik BL, Sutton RL, Fukushima M, Harris NG, Hovda DA, Lee SM. Upregulation of pentose phosphate pathway and preservation of tricarboxylic acid cycle flux after experimental brain injury. J Neurotrauma. 2005;22:1052–1065. doi: 10.1089/neu.2005.22.1052. [DOI] [PubMed] [Google Scholar]
- Domanska-Janik K. Hexose monophosphate pathway activity in normal and hypoxic rat brain. Resuscitation. 1988;16:79–90. doi: 10.1016/0300-9572(88)90073-1. [DOI] [PubMed] [Google Scholar]
- Baquer NZ, Hothersall JS, McLean P, Greenbaum AL. Aspects of carbohydrate metabolism in developing brain. Dev Med Child Neurol. 1977;19:81–104. doi: 10.1111/j.1469-8749.1977.tb08027.x. [DOI] [PubMed] [Google Scholar]
- Shank RP, Bennett GS, Freytag SO, Campbell GL. Pyruvate carboxylase: an astrocyte-specific enzyme implicated in the replenishment of amino acid neurotransmitter pools. Brain Res. 1985;329:364–367. doi: 10.1016/0006-8993(85)90552-9. [DOI] [PubMed] [Google Scholar]
- Laake JH, Slyngstad TA, Haug FM, Ottersen OP. Glutamine from glial cells is essential for the maintenance of the nerve terminal pool of glutamate: immunogold evidence from hippocampal slice cultures. J Neurochem. 1995;65:871–881. doi: 10.1046/j.1471-4159.1995.65020871.x. [DOI] [PubMed] [Google Scholar]
- Wilbur DO, Patel MS. Development of mitochondrial pyruvate metabolism in rat brain. J Neurochem. 1974;22:709–715. doi: 10.1111/j.1471-4159.1974.tb04284.x. [DOI] [PubMed] [Google Scholar]
- Haberg A, Qu H, Haraldseth O, Unsgard G, Sonnewald U. In vivo injection of [1-13C]glucose and [1,2-13C]acetate combined with ex vivo13C nuclear magnetic resonance spectroscopy: a novel approach to the study of middle cerebral artery occlusion in the rat. J Cereb Blood Flow Metab. 1998;18:1223–1232. doi: 10.1097/00004647-199811000-00008. [DOI] [PubMed] [Google Scholar]
- Haberg A, Qu H, Sonnewald U. Glutamate and GABA metabolism in transient and permanent middle cerebral artery occlusion in rat: importance of astrocytes for neuronal survival. Neurochem Int. 2006;48:531–540. doi: 10.1016/j.neuint.2005.12.025. [DOI] [PubMed] [Google Scholar]
- Rice JE, 3rd, Vannucci RC, Brierley JB. The influence of immaturity on hypoxic-ischemic brain damage in the rat. Ann Neurol. 1981;9:131–141. doi: 10.1002/ana.410090206. [DOI] [PubMed] [Google Scholar]
- Mujsce DJ, Christensen MA, Vannucci RC. Cerebral blood flow and edema in perinatal hypoxic-ischemic brain damage. Pediatr Res. 1990;27:450–453. doi: 10.1203/00006450-199005000-00007. [DOI] [PubMed] [Google Scholar]
- Brucklacher RM, Vannucci RC, Vannucci SJ. Hypoxic preconditioning increases brain glycogen and delays energy depletion from hypoxia-ischemia in the immature rat. Dev Neurosci. 2002;24:411–417. doi: 10.1159/000069051. [DOI] [PubMed] [Google Scholar]
- Yager JY, Brucklacher RM, Vannucci RC. Cerebral oxidative metabolism and redox state during hypoxia-ischemia and early recovery in immature rats. Am J Physiol. 1991;26:H1102–H1108. doi: 10.1152/ajpheart.1991.261.4.H1102. [DOI] [PubMed] [Google Scholar]
- Folbergrova J, Zhao Q, Katsura K, Siesjo BK. N-tert-butyl-alpha-phenylnitrone improves recovery of brain energy state in rats following transient focal ischemia. Proc Natl Acad Sci USA. 1995;92:5057–5061. doi: 10.1073/pnas.92.11.5057. [DOI] [PMC free article] [PubMed] [Google Scholar]
- Dombrowski GJ, Jr., Swiatek KR, Chao KL. Lactate, 3-hydroxybutyrate, and glucose as substrates for the early postnatal rat brain. Neurochem Res. 1989;14:667–675. doi: 10.1007/BF00964877. [DOI] [PubMed] [Google Scholar]
- Vannucci SJ, Simpson IA. Developmental switch in brain nutrient transporter expression in the rat. Am J Physiol Endocrinol Metab. 2003;285:E1127–E1134. doi: 10.1152/ajpendo.00187.2003. [DOI] [PubMed] [Google Scholar]
- Yager JY, Brucklacher RM, Vannucci RC. Cerebral energy metabolism during hypoxia-ischemia and early recovery in immature rats. Am J Physiol. 1992;262:H672–H677. doi: 10.1152/ajpheart.1992.262.3.H672. [DOI] [PubMed] [Google Scholar]
- Fullerton HJ, Ditelberg JS, Chen SF, Sarco DP, Chan PH, Epstein CJ, et al. Copper/zinc superoxide dismutase transgenic brain accumulates hydrogen peroxide after perinatal hypoxia ischemia. Ann Neurol. 1998;44:357–364. doi: 10.1002/ana.410440311. [DOI] [PubMed] [Google Scholar]
- Weis SN, Schunck RV, Pettenuzzo LF, Krolow R, Matte C, Manfredini V, et al. Early biochemical effects after unilateral hypoxia-ischemia in the immature rat brain. Int J Dev Neurosci. 2011;29:115–120. doi: 10.1016/j.ijdevneu.2010.12.005. [DOI] [PubMed] [Google Scholar]
- Wallin C, Puka-Sundvall M, Hagberg H, Weber SG, Sandberg M. Alterations in glutathione and amino acid concentrations after hypoxia-ischemia in the immature rat brain. Brain Res Dev Brain Res. 2000;125:51–60. doi: 10.1016/s0165-3806(00)00112-7. [DOI] [PubMed] [Google Scholar]
- Herrero-Mendez A, Almeida A, Fernandez E, Maestre C, Moncada S, Bolanos JP. The bioenergetic and antioxidant status of neurons is controlled by continuous degradation of a key glycolytic enzyme by APC/C-Cdh1. Nat Cell Biol. 2009;11:747–752. doi: 10.1038/ncb1881. [DOI] [PubMed] [Google Scholar]
- Rodriguez-Rodriguez P, Fernandez E, Almeida A, Bolanos JP. Excitotoxic stimulus stabilizes PFKFB3 causing pentose-phosphate pathway to glycolysis switch and neurodegeneration. Cell Death Differ. 2012;19:1582–1589. doi: 10.1038/cdd.2012.33. [DOI] [PMC free article] [PubMed] [Google Scholar]
- Norenberg MD, Martinez-Hernandez A. Fine structural localization of glutamine synthetase in astrocytes of rat brain. Brain Res. 1979;161:303–310. doi: 10.1016/0006-8993(79)90071-4. [DOI] [PubMed] [Google Scholar]
- Storm-Mathisen J, Leknes AK, Bore AT, Vaaland JL, Edminson P, Haug FM, et al. First visualization of glutamate and GABA in neurones by immunocytochemistry. Nature. 1983;301:517–520. doi: 10.1038/301517a0. [DOI] [PubMed] [Google Scholar]
- Puka-Sundvall M, Sandberg M, Hagberg H. Brain injury after hypoxia-ischemia in newborn rats: relationship to extracellular levels of excitatory amino acids and cysteine. Brain Res. 1997;750:325–328. doi: 10.1016/s0006-8993(97)00024-3. [DOI] [PubMed] [Google Scholar]
- Vannucci RC, Brucklacher RM, Vannucci SJ. CSF glutamate during hypoxia-ischemia in the immature rat. Brain Res Dev Brain Res. 1999;118:147–151. doi: 10.1016/s0165-3806(99)00142-x. [DOI] [PubMed] [Google Scholar]
- Danbolt NC. Glutamate uptake. Prog Neurobiol. 2001;65:1–105. doi: 10.1016/s0301-0082(00)00067-8. [DOI] [PubMed] [Google Scholar]
- Pimentel VC, Zanini D, Cardoso AM, Schmatz R, Bagatini MD, Gutierres JM, et al. Hypoxia-ischemia alters nucleotide and nucleoside catabolism and Na+,K+-ATPase activity in the cerebral cortex of newborn rats. Neurochem Res. 2013;38:886–894. doi: 10.1007/s11064-013-0994-3. [DOI] [PubMed] [Google Scholar]
- Sanchez RM, Jensen FE. Maturational aspects of epilepsy mechanisms and consequences for the immature brain. Epilepsia. 2001;42:577–585. doi: 10.1046/j.1528-1157.2001.12000.x. [DOI] [PubMed] [Google Scholar]
- Ben-Ari Y. Excitatory actions of GABA during development: the nature of the nurture. Nat Rev Neurosci. 2002;3:728–739. doi: 10.1038/nrn920. [DOI] [PubMed] [Google Scholar]