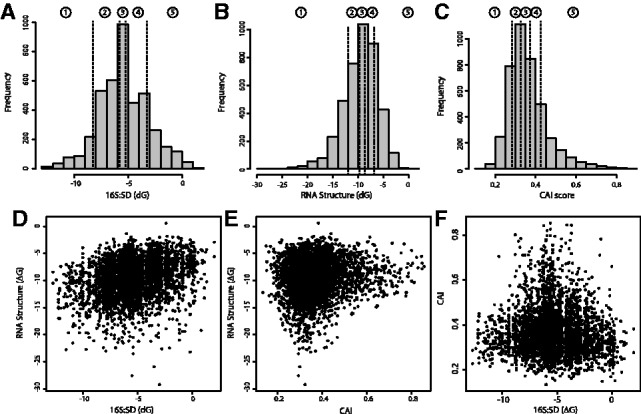
Fig. 3.

(A–C) Distribution of the three different sequence properties (hybridization energy between the 16S rRNA and SD sequence (A), minimum folding energy of RNA structure in the translation initiation region (B) and CAI of gene sequences (C)) influencing translation efficiency in E.coli. The dashed lines indicate the quintile boundaries for the scores of each property, which were later used in design mode to discretize the parameter space. (D–F) Scatter plots showing the cross-correlation between the three sequence properties of interest
