

Abstract
Motivation: MicroRNA (miRNA) expression has been found to be deregulated in human cancer, contributing, in part, to the interest of the research community in using miRNAs as alternative therapeutic targets. Although miRNAs could be potential targets, identifying which miRNAs to target for a particular type of cancer has been difficult due to the limited knowledge on their regulatory roles in cancer. We address this challenge by integrating miRNA-target prediction, metabolic modeling and context-specific gene expression data to predict therapeutic miRNAs that could reduce the growth of cancer.
Results: We developed a novel approach to simulate a condition-specific metabolic system for human hepatocellular carcinoma (HCC) wherein overexpression of each miRNA was simulated to predict their ability to reduce cancer cell growth. Our approach achieved >80% accuracy in predicting the miRNAs that could suppress metastasis and progression of liver cancer based on various experimental evidences in the literature. This condition-specific metabolic system provides a framework to explore the mechanisms by which miRNAs modulate metabolic functions to affect cancer growth. To the best of our knowledge, this is the first computational approach implemented to predict therapeutic miRNAs for human cancer based on their functional role in cancer metabolism. Analyzing the metabolic functions altered by the miRNA-identified metabolic genes essential for cell growth and proliferation that are targeted by the miRNAs.
Availability and implementation: See supplementary protocols and http://www.egr.msu.edu/changroup/Protocols%20Index.html.
Contact: krischan@egr.msu.edu
Supplementary information: Supplementary data are available at Bioinformatics online.
1 INTRODUCTION
MicroRNA (miRNA) expression has been found to be deregulated in human cancer (Sassen et al., 2008). Some of the first miRNAs identified to be involved in cancer were miR-15 and miR-16, which were found downregulated in most lymphocytic leukemia patients (Calin et al., 2002). Others include oncogenic miR-17-92, which promotes c-Myc-induced tumorigenesis in mice (He et al., 2005), and a tumor suppressor miRNA let-7, which inhibits expression of the oncogene RAS in lung cancer cell lines (Johnson et al., 2005). Further, a global decrease in miRNA levels was observed in human cancers (Gaur et al., 2007; Lu et al., 2005). Knockout of the miRNA processing enzymes, Drosha and Dicer, enhances cancer cell growth in vitro and their invasiveness in mice (Kumar et al., 2007), confirming that widespread reduction in miRNA expression could promote tumorigenesis. Therefore, miRNAs could have intrinsic functions in tumor suppression and be potential therapeutic targets. Synthetic miRNAs can be introduced into mammalian systems (Tsuda et al., 2005), as was shown in a pioneering study on therapeutic miRNA delivery of miR-26 s in a HCC mice model that successfully inhibited tumor cell proliferation and induced cancer-specific apoptosis (Kota et al., 2009).
Although miRNAs could be potential alternative targets for cancer treatment, it has been difficult to identify which miRNAs to target for a particular type of cancer, as the underlying mechanisms of how miRNAs are involved in cancer are largely unknown. Experimental evidences of how miRNAs regulate their targets in cancer cells have been limited. The expression of individual targets, such as RAS (Johnson et al., 2005) and E2F1 (O’Donnell et al., 2005), has been shown to be regulated by miRNAs and thereby used to explain the association of miRNAs with cancer. However, each miRNA could regulate many target genes, and the same miRNA could have oncogenic or anti-tumorgenic activity depending on the context or cell type in which the targets are expressed. Current computational studies focus primarily on analyzing miRNA expression profiles to identify miRNAs that are differentially expressed or signatures that can separate a particular cancer type from normal samples (Kuo et al., 2012; Liang, 2008; Oulas et al., 2011). More advanced data mining approaches integrate miRNA, gene expression data and putative miRNA–gene interactions to identify regulatory modules in which the miRNA expression is found to be negatively correlated with putative targets in the cancer samples (Xin et al., 2009; Xionghui Zhou et al., 2011; Zhang et al., 2011). Nevertheless, it remains unclear whether the altered miRNA expressions are the cause or consequence of the carcinogenesis processes, and which miRNAs could be good targets for treatment. Furthermore, as an miRNA could simultaneously target many genes, it has been difficult with current approaches to systematically predict the effect on perturbation of an miRNA.
In this study, we propose an alternative approach to tackle this problem and integrate putative miRNA–target-gene interactions, metabolic modeling and context-specific gene expression data. Our analysis focuses on the human metabolic system, as abnormal metabolic functions are known to be involved in supporting tumor growth and proliferation (Vander Heiden et al., 2012). For example, most cancer cells have higher glycolytic rates, which is called ‘Warburg effect’ (DeBerardinis et al., 2008; Vander Heiden et al., 2009). A recent study on breast cancer further uncovered alterations in glucose metabolism mediated by the phosphoglycerate dehydrogenase enzyme (Locasale et al., 2011), whose expression was found to be associated with poor prognosis (Pollari et al., 2011). Because metabolism plays an essential role in cell growth and proliferation, genes regulating metabolism have been used as drug targets in the treatment of cancer (Galmarini et al., 2008; Serkova et al., 2007).
We hypothesize that miRNAs could be implicated in the metabolic regulation of cancer, and study the targets of miRNAs in the context of the human metabolic network for which detailed mechanistic information is available for systems modeling. Our approach takes advantage of current knowledge of the human metabolic network to reconstruct a context-specific metabolic system for human liver cancer (HCC). The model is used to predict miRNAs whose overexpression or delivery could inhibit cancer cell growth by downregulating its target metabolic genes. By explicitly modeling the cancer phenotype as a specific metabolic state, we are able to predict not only the miRNAs ‘involved’ or ‘altered’ in cancer but also the potential miRNA targets that could change the cancer metabolic phenotype if perturbed. These targets could be candidates in the treatment of the disease. This is in contrast to previous studies of miRNA in cancer where the ‘cancer phenotype’ is used as a label/annotation of samples against another label of ‘normal’ (Kuo et al., 2012; Liang, 2008; Oulas et al., 2011). Our approach provides a computational platform to integrate knowledge from different sources, to study in silico the global effect of miRNA perturbations on the metabolic network and to generate hypotheses that could provide insights into the mechanisms underlying the regulation of miRNAs on cancer metabolism.
2 METHODS
2.1 Basic assumptions in network reconstruction
Our network reconstruction is based on two assumptions (see Supplementary Methods for the comparisons with previous approaches):
Information on the context-dependent gene expression, e.g. microarray data, tissue-specific gene database, studies of gene expression in the literature, can provide the relative gene expression state change between phenotypes, rather than the ‘expression level/state’ of a gene. A single ‘expression value’ cannot indicate a gene’s expression level (or its ON/OFF state) without a comparison with different phenotypes. This is because for different genes, the amount of expression that is required to turn them ON should be different. For example, signaling molecules could have large impact when they are expressed at low levels, whereas housekeeping genes would require a constitutively higher amount of expression to support cell survival (Paolella, 1997), so the expression level of these two types of genes (i.e. signaling molecules: LOW, housekeeping: HIGH) within the samples for a given phenotype would not correlate with their ON/OFF states that is defined by a single threshold or expression level. Therefore, we assume only those genes whose expression levels are significantly changed (differentially up- or downregulated) will have an impact on the metabolic functions.
- The state change of the genes/enzymes as indicated by the context information determines the state change of the reactions by modulating the maximum reaction rate. This is different from previous approaches that associate gene expression with reaction states by either removing a reaction when the corresponding gene expression is low (Becker and Palsson, 2008) or correlating the flux through the reaction with gene expression level (Shlomi et al., 2008). Our assumption is based on the Michaelis–Menten enzyme kinetics equation in which the maximum reaction rate (i.e. the maximum capacity of a flux through a reaction tunnel) is positively correlated or proportional to the concentration/activity of the gene/enzyme that catalyzes the reaction, assuming that the environmental factors (e.g. temperature, medium) are constant, the system is at thermodynamic equilibrium and all measurements are assumed to be at pseudo-steady state:
Where Kcat is a reaction constant and [E] is the concentration of the enzyme.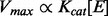
2.2 Algorithm for the reconstruction of context-dependent metabolic network
Step 1. Compute the states of the genes under the condition of interest: the context information is used to determine the change of gene expression between the reference condition and the condition of interest. For example, based on microarray data, the state of a gene changes only when it is differentially expressed, and the amount of changes  can be computed based on the ‘log fold-change’ [‘Enew/Eref’ is modeled with 2log(expression level new) −
log(expression level ref)] obtained from microarray analysis. Qualitative information from the literature or tissue-specific dataset directly determines the state of a gene under a condition of interest, but the amount of state change is computed by subtracting the reference state from the state under the condition of interest, to determine the state of the reactions in the next step. In these cases, the state of the genes is represented by discrete variables
can be computed based on the ‘log fold-change’ [‘Enew/Eref’ is modeled with 2log(expression level new) −
log(expression level ref)] obtained from microarray analysis. Qualitative information from the literature or tissue-specific dataset directly determines the state of a gene under a condition of interest, but the amount of state change is computed by subtracting the reference state from the state under the condition of interest, to determine the state of the reactions in the next step. In these cases, the state of the genes is represented by discrete variables  (i.e. low, median, high), and the state changes (‘Enew/Eref’ is modeled with 2(state of Enew) −
(state of Eref)) depend on the context information. Starting from the generic human metabolic network, the reference condition is defined by having all the genes initially in state 1, and the initial bounds are computed with flux variability analysis (FVA) (Mahadevan and Schilling, 2003; Shlomi et al., 2011).
(i.e. low, median, high), and the state changes (‘Enew/Eref’ is modeled with 2(state of Enew) −
(state of Eref)) depend on the context information. Starting from the generic human metabolic network, the reference condition is defined by having all the genes initially in state 1, and the initial bounds are computed with flux variability analysis (FVA) (Mahadevan and Schilling, 2003; Shlomi et al., 2011).
Step 2. Compute the states of reactions: based on the gene-protein-reaction information in the network, genes that are components of an enzyme complex have the ‘AND’ relationship, thus the change of the activity of these complexes are defined by 
 in which
  are the state change of gene component
  in complex
  . Complexes/genes that are different isozymes for the same reaction have an ‘OR’ relationship, thus the amount of state change on a reaction is then defined by the state changes of the isozymes:
  . Lastly, the upper bound of a reaction is changed:
  , as the state changes are defined as the ‘log fold change’. The optimization function to determine the flux (see Section 2.3) for each reaction in the reconstructed network is as follows:
In which xj and yj are initiated with FVA when we begin with the generic human metabolic network, and the upper bound  is determined by context-dependent gene expression level. FVA analysis on the generic human model provides the initial bounds/maximum fluxes of reactions, constrained by the uptake of glucose (whereas the uptake of oxygen, calcium, sodium, potassium and other irons and phosphate is not constrained).
The algorithm is implemented in MATLAB and can be used as an add-on component to the COBRA toolbox version 2.0 (Becker et al., 2007; Schellenberger et al., 2011) for network reconstruction.
2.3 Simulation based on a metabolic network model
We apply constraint-based modeling [e.g. flux balance analysis, FBA (Stephanopoulos et al., 1998)] to simulate the state of the system without detailed kinetic data, assuming that the flux distributions based on the stoichiometric mass balance are at steady state or pseudo-steady state. A reaction network is represented by the stoichiometric matrix: S [with m compounds (rows) and n reactions (columns)], the flow vector v (n by 1 vector) for the reactions and the concentration vector: X (m by 1 vector) for the compounds/metabolites. Thus we have  .
.
Assuming pseudo-steady state, the time derivative is zero, therefore  . Imposing mass balance and capacity constraints defines the space of feasible steady state flux distributions of the network, and we further apply an objective function Z (for biomass production), which is a linear function of fluxes:
in which c is a column vector to assign weights to each reaction, cT is the transpose of the vector c and V is the flux vector through all the reactions. The value of c for cancer cells is determined in the literature (Shlomi et al., 2011). Optimization (maximization) of the objective function Z identifies a solution of V.. An FVA can further explore the solution space to exam the maximum/minimum fluxes for each reaction with respect to the objective function. The constrained linear optimization problem for FBA and FVA can be solved by linear programming (Orth et al., 2010; Toya et al., 2011). We use the COBRA toolbox version 2.0 for the flux analysis (Becker et al., 2007; Schellenberger et al., 2011), and GUROBI (http://www.gurobi.com/) for the linear optimization.
2.4 Datasets and the working pipeline
2.4.1 Metabolic network and the reconstruction
The generic human metabolic network is obtained from Duarte et al. (2007). Liver-specific gene expression is extracted from a curated dataset in the literature (Shlomi et al., 2008), which provides the metabolic genes that are specific (differentially up- or downregulated) in human liver. The function for biomass production was obtained from Shlomi et al. (2011), which is based on experimentally measured compositions of DNA, RNA, amino acids and lipids in cancer cells (grown in Roswell Park Memorial Institute (RPMI)-1640 medium) (Shlomi et al., 2011). Based on the information of gene expression and the biomass function, we reconstructed a liver-specific metabolic network from the generic human metabolic network. The rationale for optimizing biomass production is because we are focused on the potential of miRNAs on affecting tumor growth, and we assume that the miRNAs affect the maximal rate of cancer cell growth that can be achieved. The doubling time estimated by the unperturbed and perturbed models range from 10 to 30 h, which we think is reasonable based on our experiences in culturing liver cancer cells (e.g. HepG2).
2.4.2 Incorporation of miRNA regulation
The metabolic gene targets of each miRNA are obtained from TargetScan, which is based on sequence complementarity and conservation of the target sites within vertebrates (Friedman et al., 2009). We are aware that there are many miRNA target databases that could provide different sets of miRNA targets. Given limitations in experimental approaches to systematically verify miRNA–target relationships, a fair comparison between these target databases is difficult. TargetScan has been shown to have higher sensitivity and specificity compared with other approaches (Zhang and Verbeek, 2010). We used only the results of the 153 conserved miRNA family and only the targets with conserved binding sites (across mammalians). Based on the gene targets of miRNAs in the human metabolic system, we simulated the liver-specific metabolic network by optimizing the biomass production (which assumes the primary objective of cancer cells is to grow and proliferate) to predict whether an miRNA could effectively inhibit cancer growth.
2.4.3 Test the accuracy of prediction
To assess the accuracy of the prediction, i.e. whether the predicted effect of an miRNA on biomass production correlates with its ability to inhibit/promote cancer growth, requires a test set. There is no comprehensive list available of miRNAs that have been investigated experimentally for a cancer type. Therefore, we manually searched in the published literature for evidence for each of the 153 miRNA families. Through an exhaustive search we found 50 related papers in peer-reviewed journals, which involve experimental studies on HCC or related human liver cell lines with regards to 41 of the 153 miRNA families. We read the papers and curated a test set that includes these 41 miRNAs that have been experimentally studied in liver cancer. The in vivo or in vitro evidences show 23 of these 41 miRNAs inhibit liver cancer growth/metastasis if overexpressed, whereas 18 have no effect or have the opposite (i.e. enhancing) effect (Supplementary Table S1). We established the accuracy of our approach by comparing the prediction results with the test set.
We compared our approach with a previous method GIMME (gene inactivity moderated by metabolism and expression), which also reconstructs tissue-specific networks and simulates by optimizing an objective function (Becker and Palsson, 2008; Chang et al., 2010). GIMME takes in gene expression data and removes all the reactions associated with genes that are expressed lowly. Because removing reactions from the network may disconnect the fluxes, GIMME then adds back some reactions to connect the network (so that the objective function is fulfilled). There could be many ways to add reactions back into the system to make the fluxes connected (e.g. one valid way is to add back all reactions that were removed, which actually retain the original human recon 1, the non-specific model), and GIMME adds the least possible amount of reactions to fulfill the objective function. In our reconstruction approach, we do not remove reactions; instead, the flux bounds of the reactions are changed by the differentially expressed genes. A new network flux scenario can be determined by the updated reaction bounds, rather than by removing or adding back reactions as in GIMME. The code of GIMME was downloaded from Becker et al. (2007) and Schellenberger et al. (2011), and our online tutorials describe how we applied GIMME.
2.4.4 Exploring mechanisms of how miRNAs affect cancer metabolism
The data to support our ‘essential metabolic genes’ are obtained from COLT-Cancer, a genome-wide pooled small hairpin RNA (shRNA) screen dataset (Koh et al., 2011). Essential is defined by a significant (P < 0.05) reduction in the survival and proliferation of the cells on their knockdown by shRNA in more than one cancer cell lines. The data of the liver cancer gene signatures are from the Liverome database (Lee et al., 2011), which collects the genes that have been shown to be differentially expressed in liver cancer tissues or in highly invasive liver cancer cell lines. We further collected miRNA expression data for HCC from Li et al. (2008), compared with our curated literature evidences, to show that the expression change at the miRNA level may not necessarily indicate whether it is a good target.
See Supplementary Methods for a comparison of approaches in the reconstruction of a context-specific metabolic network. The network reconstruction and miRNA prediction pipeline is available, and a step-by-step protocol is provided, see Supplementary Protocol file.
3 RESULTS
In this study, we reconstruct a human context-dependent metabolic network to associate gene expression changes with constraints on the reactions. Based on a reference metabolic network [e.g. the generic human metabolic network (Duarte et al., 2007)] and the context information obtained from gene expression data of a particular phenotype of interest, our approach estimates the activity change of each reaction and adjusts the upper bounds (i.e. the maximum capacity) of the reaction, to provide a new metabolic network model that is specific to the condition. The process is shown in Figure 1, and the algorithm is described in Section 2.
Fig. 1.
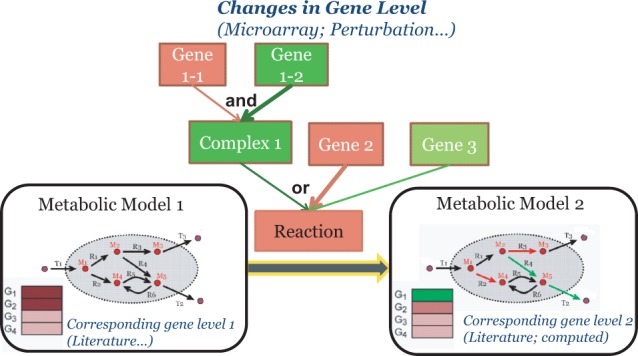
Reconstruct context-specific metabolic network. The context information provides the state change of the gene expression between two phenotypes. The state change of each reaction is then determined by the state change of the genes that regulate the reaction. In this example, a reaction can be catalyzed (activated) by any of the three isozymes. The first isozyme is a complex involving two genes: gene 1-1 and gene 1-2. The other two isozymes are encoded by gene 2 and gene 3. Based on a gene expression profile where gene 1-1 and gene 2 are upregulated, whereas gene 1-2 and gene 3 are downregulated, although the isozyme complex 1 is not activated, as it relies on the activation of both gene 1-1 and gene 1-2, the reaction is activated, as the isozyme encoded by gene 2 is activated. The activities of the reactions then determine the change of fluxes in the metabolic network. Thus the gene expression phenotype is associated with a metabolic state
Information on the human liver-specific gene expression is obtained from a curated dataset in the literature (Shlomi et al., 2008). Our approach is applied to reconstruct a liver cancer-specific metabolic model from the human generic metabolic network by setting the maximum capacity of the reactions based on context information obtained from gene expression data of cancer samples. The liver-specific metabolic network is used to predict the growth and proliferation rate of cancer cells with FBA (Section 2). Because cancer cells modulate metabolic functions to help support their rapid growth and proliferation, biomass production (Shlomi et al., 2011) was used as the objective function to reflect the growth and proliferation rate of the cancer cells. The rate of biomass production is based on experimentally measured compositions of DNA, RNA, amino acids and lipids in cancer cells (Shlomi et al., 2011) and reflects the maximum rate of cell growth and proliferation that can be achieved.
To estimate the robustness of the network reconstruction against potential noise from gene expression data, we applied FVA (Delgado and Liao, 1997; Park et al., 2009) on the reconstructed liver model. FVA performs a sensitivity analysis of the fluxes with respect to changes in reaction bounds that are determined by the gene expression data. The results of FVA show that a 25% reduction of the upper bound in all the reactions that carry fluxes would only reduce the output of the model by no more than 10% (i.e. retain 90% of the biomass production). On average, the bounds need to be changed 83% for any reaction that carry fluxes to be able to change biomass production by 10%. Nevertheless in our reconstruction, for a reaction to have a 25% reduction in the bounds requires all the genes in a particular enzyme complex that catalyze the reaction to have >2-fold downregulation in expression. Therefore, the FVA results suggest a robust system that is insensitive to potential noise in the microarray data.
3.1 Prediction of the metabolic state of liver cancer cells on perturbation of miRNA levels that regulate metabolic genes
Collating the metabolic gene targets of each miRNA obtained from TargetScan, which is based on sequence complementarity and conservation of the target sites within vertebrates (Friedman et al., 2009), results in 153 conserved miRNA family with conserved binding sites (across mammalians). The model assumes the gene targets are inhibited (50% knockdown) on overexpression of their miRNA regulator, as the miRNA binds to these target mRNAs by base pairing and forms RNA-induced silencing complex that then inhibits protein translation and/or enhances degradation of the mRNAs (Bartel, 2004). A condition-specific metabolic system is constructed by overexpressing each miRNA with their targets downregulated (i.e. 50% decrease in gene expression) and simulated to obtain the maximum achievable biomass production rate F on the perturbation of the miRNA. This is compared with the rate F0 in the ‘wild-type’ liver cancer metabolic network without upregulation of the miRNAs. A score  is computed for each miRNA to indicate their ability to reduce cancer growth. The miRNAs are ranked by this score. The procedure is shown in Figure 2.
Fig. 2.
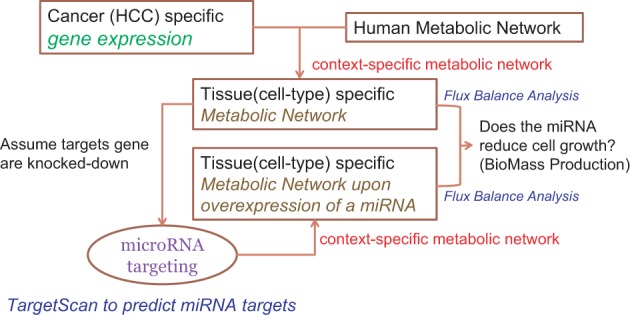
A pipeline for predicting therapeutic miRNAs for human liver cancer. The information of liver-specific gene expression is used to reconstruct a liver-specific metabolic network from the generic human network. Based on the liver-specific network, each miRNA is perturbed (overexpressed thus the putative targets are partially knocked down) to reconstruct a metabolic network on perturbation. FBA is applied on the liver-specific network, and the perturbed network is used to estimate whether the perturbation reduces cell growth/proliferation based on the objective function for cancer cells (i.e. biomass production)
To estimate the robustness of the prediction against potential errors (e.g. false positives) in the miRNA target prediction, we perturb the system by randomly removing a small fraction of the targets predicted for each miRNA. Our simulations show that with 10% of the predicted targets randomly removed for each miRNA, the prediction results are stable, i.e. the predicted changes in biomass production correlate to the unperturbed model with an average Pearson correlation coefficient of 0.90 (standard deviation 0.05) in 100 simulations. Even with as many as 20% or one-fifth of the predicted targets randomly changed (removed) for each miRNA, the simulation results remain correlated with the unperturbed model with an average Pearson correlation coefficient of 0.80 (standard deviation 0.09) in 100 random simulations. We further examine to what extent our assumption of miRNA-induced knockdown rate (originally set as 50% or 2-fold downregulation) affects the prediction. We simulate the model with 25% (4-fold) and 12.5% (8-fold) knockdown. These perturbed models predict biomass production changes that still correlated well with the original model. The Pearson correlation coefficients to the original model (with the parameter set to 50%) are 0.91 and 0.86 (P = 0) in the 25 and 12.5% knockdown, respectively.
To assess the accuracy of the prediction, we search in the literature for information on the 153 miRNA families and collate a test set including 41 miRNAs that have been experimentally studied in liver cancer. The in vivo or in vitro evidences show 23 of these 41 miRNAs inhibit liver cancer growth/metastasis if overexpressed, whereas 18 have no effect or have the opposite (i.e. enhancing) effect (Supplementary Table S1). Based on our scoring and ranking of the miRNAs, a Receiver-Operating Characteristic curve is plotted for the predictions of these 41 miRNAs in the test set (the black line with circular markers in Fig. 3), which shows a prediction accuracy (area under curve) >82% [the best cutoff based on the test set is at 0.2 in the unit of milligram per gram dry weight per hour (mg/gDW/h)]. In the test set, 5 of the top 5 (100%, hypergeometric test P < 0.05) or 12 of the top 15 (80%, hypergeometric test P < 0.02) with the highest scores predicted to inhibit HCC are supported experimentally by the literature to be tumor suppressors in HCC (see Supplementary Table S1). Comparison with a current approach GIMME (Becker and Palsson, 2008; Chang et al., 2010) for network reconstruction that was previously applied to human metabolism (the green line with square markers in Fig. 3) gave a prediction accuracy of 64%, only slightly better than random ( ) and lower than the predictions based on our approach. For example, with the same cutoff with a false-positive rate of 0.33, our approach achieves 0.91 precision (true-positive rate), a higher prediction accuracy than GIMME (0.57).
Fig. 3.
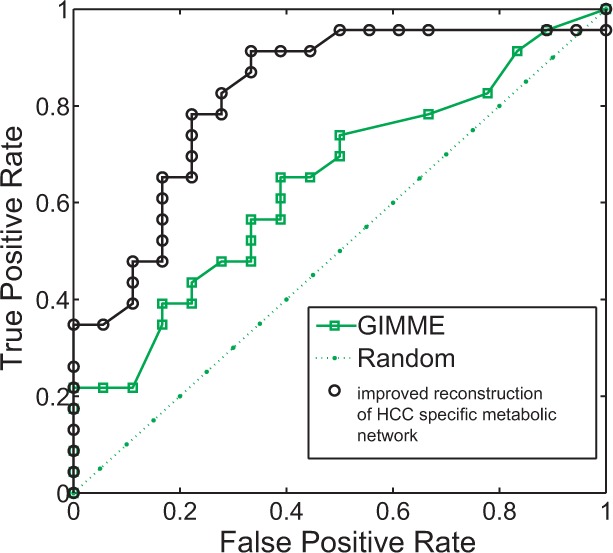
The Receiver-Operating Characteristic curve of the prediction based on the test set. Black line (with circular markers) shows the prediction result from our approach of network reconstruction, and the green line (with square markers) shows the result when GIMME is applied
We apply the approach to the entire 153 miRNA families (which includes the 41 miRNAs in the test set and the other 112 miRNAs that have no information on their impact on liver cancer). Four of the top 10 miRNAs with the highest scores are in the test set and all of them are supported experimentally by the literature to be tumor suppressors in HCC (see Supplementary Table S2). We predict the other 6 miRNAs of the top 10 could be novel candidates of tumor suppressors of HCC for further experimental studies. Although there is no experimental evidence currently for these six miRNAs in peer-reviewed journals, we found in newly published conference abstracts that 3 of the 6 miRNAs have been suggested to be tumor suppressors, among which miR-149 and miR-491 have been tested in liver cancer cell lines (see Supplementary Table S2).
Next, we further explored the reconstructed metabolic network for liver cancer to identify potential mechanisms by which the miRNAs inhibit cancer growth.
3.2 Metabolic functions modulated by miRNAs to inhibit cancer growth
To study the metabolic functions that the miRNAs modulate to inhibit cancer growth, we compared the averaged flux changes induced by the top 50 miRNAs (predicted to inhibit cancer growth) with the bottom 50 (predicted not to inhibit cancer growth) ranked based on their scores, to identify the subsystems with the greatest change. We found that the largest flux changes occurred for the production of nucleotides and amino acids, the glycolysis/gluconeogenesis pathways, the tricarboxylic acid cycle and pyruvate metabolism, as well as transport processes across the cellular, mitochondrial and peroxisomal membranes. These are essential metabolic functions that support the biosynthetic processes and energy requirements of the cells. Tumor-specific metabolic machinery regulates these processes to facilitate cell growth and proliferation (Vander Heiden et al., 2009), and our model indicates that these miRNAs could alter the metabolic processes that support cancer growth.
One of the most well-known cancer biochemical phenotype is the Warburg effect (WARBURG, 1956a, b). The Warburg effect is known as a metabolic adaptive response in cancer cells to satisfy the high demand of the molecular building blocks of the cell, i.e. nucleotides, fatty acids, lipids and amino acids, and the energy requirements through ATP, to facilitate proliferation (Shlomi et al., 2011; Vander Heiden et al., 2009). Cancer cells metabolize glucose at high rates and shift the flux downstream of glucose from the mitochondrial tricarboxylic acid cycle to the more rapid anerobic glycolysis, thereby producing vast amounts of lactate that is secreted from the cancer cells (Vander Heiden et al., 2009). Because an indicator of the Warburg effect is excessive lactate production, we analyzed the flux change (from the FBA results) in response to miRNA perturbations on the reaction catalyzed by lactate dehydrogenase (LDH), which converts pyruvate into lactate. The result (Fig. 4) shows that the flux is decreased significantly (on average by 50%) on overexpressing the miRNAs that scored higher (top 50), whereas the bottom 50 miRNA did not impact this flux (P < 0.001 t-test). We perform FVA analysis on the models and the upper bounds of the LDH reaction for the top 50 miRNAs also show on average a >40% decrease. These results suggest that the top miRNAs could impact liver cancer growth by mitigating the Warburg effect to alter the cancer metabolic phenotype.
Fig. 4.
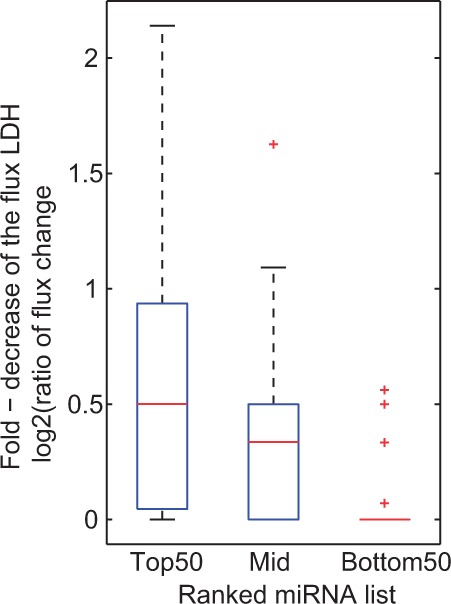
The flux change in response to miRNA perturbations on the reaction catalyzed by lactate dehydrogenase. The y-axis: log-fold change [i.e. log2(ratio of flux change)]. P < 0.001 comparing the top and bottom, middle and bottom ranked miRNAs
3.3 miRNA target metabolic enzymes that are essential for cancer growth
Each miRNA has multiple targets, but the correlation between the number of targets in metabolism and their ability to inhibit cancer growth is low (Pearson correlation coefficient = 0.26). Permutation tests were performed on the top 10 predicted miRNAs, by knocking down the same number of random genes as the number of miRNA targets, for 1000 times. We found that the number of target genes of the miRNAs is not correlated with their ability to inhibit cancer growth. In contrast, the top 10 miRNAs decrease the proliferation significantly (P < 0.05). Thus, we hypothesize that there are important enzymes, on targeting, wherein the cell growth and proliferation are reduced. We applied our reconstruction and simulation approach to estimate the change in biomass production on knockdown of each metabolic gene individually. This identified the essential genes (or genes that supports cancer growth) that could reduce cell growth on knockdown of the metabolic gene (i.e. reduce biomass production). In practice these are numerical computations, there will be values having small fluctuation around 0. Thus the threshold is set at 0.01 mg/gDW/h to obtain robust results. Essential is defined by a significant reduction in the survival and proliferation of the cells on their knockdown by shRNA (where CULT database provides a P-value < 0.05 on their scores of gene activity ranking profiles on shRNA knockdown). Of the 48 genes (among >1900 metabolic genes) that are predicted to be essential for the growth and proliferation of liver cancer cells (i.e. reduces biomass production on knockdown), 24 can be targeted by miRNAs (Supplementary Table S3). We search in a genome-wide pooled shRNA screen dataset (Koh et al., 2011) containing breast cancer, pancreatic and ovarian cancer cell lines and found that many of the genes in the list, including phosphorylase, glycogen; brain (PYGB), glucan (1,4-alpha-), branching enzyme 1 (GBE1), Stearoyl-CoA desaturase-1 (SCD), enolase, pyruvate kinase and solute carrier family proteins have been identified as essential genes in >2 cancer cell lines. Because there are no liver cell lines in these studies, we further analyzed a collection of liver cancer gene signatures in the Liverome database (Lee et al., 2011) to determine if these genes are differentially expressed in liver cancer tissues or in highly invasive liver cancer cell lines. We found a majority of these genes (71%, or 17 of 24) have been identified as gene signatures for liver cancer or for invasiveness/metastasis in liver cancer based on their gene expression analysis (Supplementary Table S3, the columns: signature of cancer/normal and signature of invasiveness).
Although the evidence found suggests that these genes could be important for liver cancer, they have not been fully explored. According to text mining studies of the abstracts in the pubmed literature (Lee et al., 2011), there is only one enzyme (enolase) that has been experimentally studied and associated with liver cancer. However, some of the others have been studied in other types of cancers to demonstrate their functional role in tumor growth. The glycolytic pathway is directly responsive to the Warburg effect in cancer, thus the key glycolytic enzymes, enolases and pyruvate kinases, both in the list, have been shown to promote cancer invasion and proliferation (Capello et al., 2011; Christofk et al., 2008; Tu et al., 2010). Knockdown of pyruvate kinase PKM2 reverses the Warburg effect and suppresses tumorigenesis in mice model (Christofk et al., 2008). The high expression of enolase correlates with poor prognosis in breast cancer and a decrease in its expression in tamoxifen-resistant breast cancer cells significantly augments the effectiveness of tamoxifen treatment (Tu et al., 2010). The pentose phosphate pathway uses glucose to generate ribose rings that are essential for the synthesis of DNA and RNA. Both of these key enzymes that catalyze the production of ribose-5-phosphate are on the list of essential genes: ribulose-5-phosphate-3-epimerase (RPE) and ribose 5-phosphate isomerase A (RPIA). Our simulation predicts that downregulation of either of these two metabolic genes reduces DNA/RNA synthesis, which is consistent with a recent study in pancreatic cancer (Ying et al., 2012) that showed knockdown of either of the two enzymes (or both) reduced glucose flux into nucleotide production and suppressed tumor growth. Fatty acid metabolism and lipid synthesis are also important in cell proliferation as they are primary components of cellular membrane. SCD activity is involved in the synthesis of unsaturated fatty acids and could promote the oncogenic process and was suggested as a therapeutic target for prostate cancer (Fritz et al., 2010; Hess et al., 2010; Igal, 2010, 2011). In addition, phosphoglucomutase 1 (PGM1) (Singh et al., 2011), hydroxyacyl-CoA dehydrogenase alpha/beta (HADHA/B) family (Zhou et al., 2012) and the solute carrier family 25 genes (Sotgia et al., 2012) have been shown to be upregulated in cancer. glycogenin 1 (GYG1) and glycogen synthase 1 (GYS1) are involved in glycogenolysis/glycogenesis and are listed as signatures of metastasis in the Liverome database. Upregulation of GYS1 has been shown to provide nutritional support to renal cancer cells (Tsavachidou et al., 2010). The expressions of two other genes, DLD and PYGB, are unclear but are listed as liver cancer signatures in the Liverome database. The phospholipase A2, group IVA (PLA2G4A), GBE1 and galactose-1-phosphate uridylyltransferase (GALT) genes have not been explored in cancer thus far according to the literature and could be potential targets for further study experimentally. Figure 5 summarizes the metabolic pathways and processes that could be affected by these essential enzymes identified to be targeted by miRNAs in the analysis.
Fig. 5.
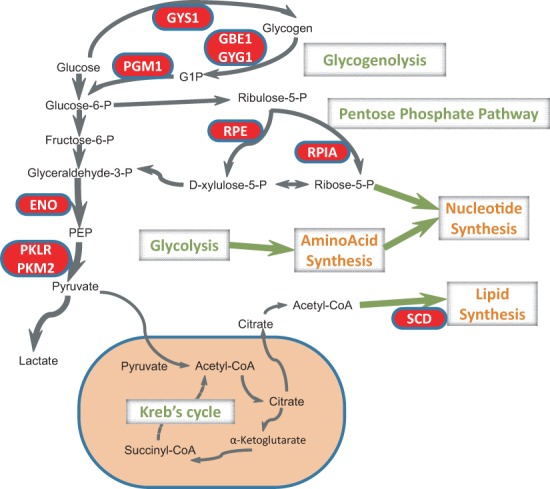
The metabolic pathways and processes that could be affected by these essential enzyme
We analyzed the miRNAs that target these enzymes that could be essential for liver cancer and found a strong association between targeting these enzymes and the ability of the miRNAs to inhibit liver cancer growth. For example, 90% of the miRNAs ranked in the top 50 based on their score target at least one of these essential enzymes, whereas none of the miRNAs at the bottom 50 target these enzymes (P < 0.01 in Fisher exact test). These observations suggest that miRNAs could modulate metabolic function by targeting metabolic enzymes that are essential for cell growth and proliferation. Supplementary Table S4 lists the five miRNAs in the test set that have the highest score and their essential metabolic gene targets predicted by the analysis, as well as previous studies showing their signaling targets and involvement in liver cancer. Overall the model predictions and analysis suggest that miRNAs could directly modulate cancer metabolism, in addition to signaling pathways.
4 DISCUSSION
4.1 Predicting targets for the treatment of cancer
Many computational approaches rely on statistics and data mining/machine learning techniques to predict cancer-related genes (Kuo et al., 2012; Liang, 2008; Oulas et al., 2011). The prediction is usually based on whether there are significant differences in the gene expression of the cancer as compared with normal samples. These approaches might identify genes that could distinguish/separate cancer and normal phenotype, but may not necessarily be the ‘targets’ that change the phenotype and thus not ideal for treatment of cancer. The expression change in an miRNA level may not necessarily indicate whether it is a good target. To show this, we collected miRNA expression data on HCC from Li et al. (2008) and provide this information of the miRNAs in our study in the Supplementary Table S5. Given the propensity to identify targets by searching for differentially expressed genes, we found that, in our test set, 43% (10 of 23) of the miRNAs whose overexpression/delivery are able to inhibit the growth, invasion or metastasis of HCC are not differentially expressed [e.g. including miR-124, which was identified by researchers at Dana-Farber Cancer Institute who are planning to begin a clinical trial (Hatziapostolou et al., 2011, 4)], whereas some of them are even highly expressed in HCC. This suggests that the gene targets for the treatment of cancer may not necessary be identified by mining/learning from gene expression changes alone. This is because in these mining/learning methods the cancer phenotype is only a ‘label’ or ‘annotation’ on the samples that are unable to capture the information contained in a ‘cancer phenotype’ (i.e. other than the specific gene expression pattern, the specific cellular behavior or the specific metabolic states). Our approach differs from previous approaches to predict miRNAs involved in cancer by predicting miRNA targets whose overexpression or delivery could inhibit HCC through explicitly modeling the cancer phenotype as a specific metabolic state. We compare our prediction against a test set and show that we could fairly accurately identify the miRNA targets. We believe that only when one is able to clearly model a phenotype can one predict the targets to modulate the phenotype.
4.2 Future studies on the role of miRNAs in cancer metabolism
Current studies on the role of miRNAs in liver cancer [reviewed in (Huang and He, 2011)] have been focused on targets in signaling processes, involving the apoptosis pathway (e.g. Bcl-w, Ras), cell cycle progression and migration/invasion signaling (e.g. CDK, cyclins, PI3K signaling PTEN, c-Met, FOS). There are a few studies that explore the regulation of cancer metabolic functions by miRNAs [see review (Singh et al., 2011)], but currently they focus only on glycolysis, in which essential enzymes PGM1 and ENO1 are shown to be regulated by miRNA-29 a and miR-17-92. Nevertheless, in these studies it is unclear whether the miRNAs directly target these enzymes. Alternatively, we provide a modeling approach that focuses on direct metabolic targets of miRNAs and enables predictions based on the metabolic system. The results of this modeling approach suggest that miRNAs could regulate cancer growth by directly modulating metabolic functions.
Given that miRNAs could target metabolic functions to regulate cancer growth, one could inspect the list of metabolic enzymes reported in the literature (resulting either from experimental studies of network-based theoretical work) that are capable of preventing or delaying cancer growth and then predict the appropriate miRNAs that target at least one of these enzymes. In contrast to this simple method, we applied a systematic study to model the metabolic systems that are perturbed by miRNAs. Thus our model has the advantage of not only predicting and prioritizing miRNAs for further experimental study but also could provide a systematic view of the combinatorial effect of multiple targets of an miRNA on human metabolism, which could facilitate exploration of the mechanisms of how miRNAs regulate metabolic functions. The proposed approach can be easily applied to other cancer types to predict specific miRNAs for the cancer type.
There are many other approaches developed to constrain reaction fluxes in metabolic models based on gene expression to build context-specific models (Wu and Chan, 2012), including GIMME (Becker and Palsson, 2008; Chang et al., 2010), iMAT (Shlomi et al., 2008), Model Building Algorithm (Folger et al., 2011; Gille et al., 2010; Jerby et al., 2010), E-flux (Colijn et al., 2009), tFBA (Van Berlo et al. 2011), MADE (Jensen and Papin, 2011) and mCADRE (Wang et al., 2012). Our reconstruction is based on significant changes of gene expression rather than direct association of ON/OFF in gene expression with presence/absence of fluxes, which is similar to tFBA and MADE. Nevertheless, our approach differs from theirs in the sense that we apply rules to constrain the fluxes and optimize cell growth like GIMME, rather than optimizing consistencies between expression and fluxes. Our unique contribution is in the incorporation of miRNA regulation to the system. Although there has not been an unbiased comparison between different reconstruction approaches, it could be valuable to adopt or incorporate these alternative approaches, and to take the advantage of the accumulation of metabolomic data (Chan et al. 2003; Caspi et al. 2008; Srivastava and Chan, 2008; Patti et al. 2012) in future work to improve our reconstruction specific for miRNA predictions.
The limitation of the study is that there could be indirect effects potentially responsive to signaling and transcriptional regulations that are mediated by the miRNAs. The possible interactions between miRNA, signaling processes, transcription factors and the expression of metabolic genes complicated the study in exploring the functional roles of miRNAs in cancer (Huang and He, 2011). We have thus considered only the direct targets of miRNAs in the metabolic system, but there could be indirect targets whose expression is altered by transcription factors that are regulated by miRNAs. For example, miR-26 is known to inhibit HCC by directly targeting the signaling process (mediated by cyclin D and cyclin E) that regulates cell cycle, thereby affecting cancer metabolism (Kota et al., 2009). Only accounting for its direct targets among the metabolic genes cannot capture such information in the signaling process, therefore one should further incorporate the transcriptional regulatory network to describe regulation at this level. Paired miRNA and gene expression profiles on perturbation of the miRNAs, if available, could be integrated to build a more comprehensive model of target genes’ expressions. This model would predict the response of the gene targets to overexpression of a particular miRNA, instead of assuming that all the predicted gene targets are inhibited on overexpression or therapeutic delivery of their miRNA regulators. It was recently found that some miRNAs might also increase gene expression (Place et al., 2008), but currently few of these have been observed in human. As more information is known for this type of regulation, they could be further included in the model to provide a more accurate prediction of the miRNA targets. Future studies with miRNAs will aim to incorporate more complex gene networks in regulating the expression of metabolic genes and account for potential interactions between miRNA, signaling, transcription and metabolic systems to achieve a systematic understanding of cancer metabolism.
Funding: This study was supported in part by the National Institute of Health (R01GM079688, R01GM089866 and R21CA176854), the National Science Foundation (CBET 0941055).
Conflict of Interest: none declared.
Supplementary Material
REFERENCES
- Bartel DP. MicroRNAs: genomics, biogenesis, mechanism, and function. Cell. 2004;116:281–297. doi: 10.1016/s0092-8674(04)00045-5. [DOI] [PubMed] [Google Scholar]
- Becker SA, et al. Quantitative prediction of cellular metabolism with constraint-based models: the COBRA Toolbox. Nat. Protoc. 2007;2:727–738. doi: 10.1038/nprot.2007.99. [DOI] [PubMed] [Google Scholar]
- Becker SA, Palsson BO. Context-specific metabolic networks are consistent with experiments. Plos Comput. Biol. 2008;4:e1000082. doi: 10.1371/journal.pcbi.1000082. [DOI] [PMC free article] [PubMed] [Google Scholar]
- Calin GA, et al. Frequent deletions and down-regulation of micro- RNA genes miR15 and miR16 at 13q14 in chronic lymphocytic leukemia. Proc. Natl Acad. Sci. USA. 2002;99:15524–15529. doi: 10.1073/pnas.242606799. [DOI] [PMC free article] [PubMed] [Google Scholar]
- Capello M, et al. α-enolase: a promising therapeutic and diagnostic tumor target. FEBS J. 2011;278:1064–1074. doi: 10.1111/j.1742-4658.2011.08025.x. [DOI] [PubMed] [Google Scholar]
- Caspi R, et al. The MetaCyc database of metabolic pathways and enzymes and the BioCyc collection of pathway/genome databases. Nucleic Acids Res. 2008;36:D623–D631. doi: 10.1093/nar/gkm900. [DOI] [PMC free article] [PubMed] [Google Scholar]
- Chan C, et al. Metabolic flux analysis of cultured hepatocytes exposed to plasma. Biotechnol. Bioeng. 2003;81:33–49. doi: 10.1002/bit.10453. [DOI] [PubMed] [Google Scholar]
- Chang RL, et al. Drug off-target effects predicted using structural analysis in the context of a metabolic network model. Plos Comput. Biol. 2010;6:e1000938. doi: 10.1371/journal.pcbi.1000938. [DOI] [PMC free article] [PubMed] [Google Scholar]
- Christofk HR, et al. The M2 splice isoform of pyruvate kinase is important for cancer metabolism and tumour growth. Nature. 2008;452:230–233. doi: 10.1038/nature06734. [DOI] [PubMed] [Google Scholar]
- Colijn C, et al. Interpreting expression data with metabolic flux models: predicting mycobacterium tuberculosis mycolic acid production. Plos Comput. Biol. 2009;5:e1000489. doi: 10.1371/journal.pcbi.1000489. [DOI] [PMC free article] [PubMed] [Google Scholar]
- DeBerardinis RJ, et al. The biology of cancer: metabolic reprogramming fuels cell growth and proliferation. Cell Metab. 2008;7:11–20. doi: 10.1016/j.cmet.2007.10.002. [DOI] [PubMed] [Google Scholar]
- Delgado J, Liao JC. Inverse flux analysis for reduction of acetate excretion in Escherichia coli. Biotechnol. Prog. 1997;13:361–367. doi: 10.1021/bp970047x. [DOI] [PubMed] [Google Scholar]
- Duarte NC, et al. Global reconstruction of the human metabolic network based on genomic and bibliomic data. Proc. Natl Acad. Sci. USA. 2007;104:1777–1782. doi: 10.1073/pnas.0610772104. [DOI] [PMC free article] [PubMed] [Google Scholar]
- Folger O, et al. Predicting selective drug targets in cancer through metabolic networks. Mol Syst Biol. 2011;7 doi: 10.1038/msb.2011.35. 501. [DOI] [PMC free article] [PubMed] [Google Scholar]
- Friedman RC, et al. Most mammalian mRNAs are conserved targets of microRNAs. Genome Res. 2009;19:92–105. doi: 10.1101/gr.082701.108. [DOI] [PMC free article] [PubMed] [Google Scholar]
- Fritz V, et al. Abrogation of de novo lipogenesis by stearoyl-CoA desaturase 1 inhibition interferes with oncogenic signaling and blocks prostate cancer progression in mice. Mol. Cancer Ther. 2010;9:1740–1754. doi: 10.1158/1535-7163.MCT-09-1064. [DOI] [PMC free article] [PubMed] [Google Scholar]
- Galmarini CM, et al. Cytotoxic nucleoside analogues: different strategies to improve their clinical efficacy. Curr. Med. Chem. 2008;15:1072–1082. doi: 10.2174/092986708784221449. [DOI] [PubMed] [Google Scholar]
- Gaur A, et al. Characterization of microRNA expression levels and their biological correlates in human cancer cell lines. Cancer Res. 2007;67:2456–2468. doi: 10.1158/0008-5472.CAN-06-2698. [DOI] [PubMed] [Google Scholar]
- Gille C, et al. HepatoNet1: a comprehensive metabolic reconstruction of the human hepatocyte for the analysis of liver physiology. Mol. Syst. Biol. 2010;6:411. doi: 10.1038/msb.2010.62. [DOI] [PMC free article] [PubMed] [Google Scholar]
- Hatziapostolou M, et al. An HNF4α-miRNA inflammatory feedback circuit regulates hepatocellular oncogenesis. Cell. 2011;147:1233–1247. doi: 10.1016/j.cell.2011.10.043. [DOI] [PMC free article] [PubMed] [Google Scholar]
- He L, et al. A microRNA polycistron as a potential human oncogene. Nature. 2005;435:828–833. doi: 10.1038/nature03552. [DOI] [PMC free article] [PubMed] [Google Scholar]
- Hess D, et al. Inhibition of StearoylCoA desaturase activity blocks cell cycle progression and induces programmed cell death in lung cancer cells. Plos One. 2010;5:e11394. doi: 10.1371/journal.pone.0011394. [DOI] [PMC free article] [PubMed] [Google Scholar]
- Hiller K, et al. Elucidation of cellular metabolism via metabolomics and stable-isotope assisted metabolomics. Curr. Pharm. Biotechnol. 2011;12:1075–1086. doi: 10.2174/138920111795909096. [DOI] [PubMed] [Google Scholar]
- Huang S, He X. The role of microRNAs in liver cancer progression. Br. J. Cancer. 2011;104:235–240. doi: 10.1038/sj.bjc.6606010. [DOI] [PMC free article] [PubMed] [Google Scholar]
- Igal RA. Roles of StearoylCoA desaturase-1 in the regulation of cancer cell growth, survival and tumorigenesis. Cancers. 2011;3:2462–2477. doi: 10.3390/cancers3022462. [DOI] [PMC free article] [PubMed] [Google Scholar]
- Igal RA. Stearoyl-CoA desaturase-1: a novel key player in the mechanisms of cell proliferation, programmed cell death and transformation to cancer. Carcinogenesis. 2010;31:1509–1515. doi: 10.1093/carcin/bgq131. [DOI] [PubMed] [Google Scholar]
- Jensen PA, Papin JA. Functional integration of a metabolic network model and expression data without arbitrary thresholding. Bioinformatics. 2011;27:541–547. doi: 10.1093/bioinformatics/btq702. [DOI] [PMC free article] [PubMed] [Google Scholar]
- Jerby L, et al. Computational reconstruction of tissue-specific metabolic models: application to human liver metabolism. Mol. Syst. Biol. 2010;6:401. doi: 10.1038/msb.2010.56. [DOI] [PMC free article] [PubMed] [Google Scholar]
- Johnson SM, et al. RAS is regulated by the let-7 microRNA family. Cell. 2005;120:635–647. doi: 10.1016/j.cell.2005.01.014. [DOI] [PubMed] [Google Scholar]
- Koh JLY, et al. COLT-Cancer: functional genetic screening resource for essential genes in human cancer cell lines. Nucleic Acids Res. 2011;40:D957–D963. doi: 10.1093/nar/gkr959. [DOI] [PMC free article] [PubMed] [Google Scholar]
- Kota J, et al. Therapeutic microRNA delivery suppresses tumorigenesis in a murine liver cancer model. Cell. 2009;137:1005–1017. doi: 10.1016/j.cell.2009.04.021. [DOI] [PMC free article] [PubMed] [Google Scholar]
- Kumar MS, et al. Impaired microRNA processing enhances cellular transformation and tumorigenesis. Nat. Genet. 2007;39:673–677. doi: 10.1038/ng2003. [DOI] [PubMed] [Google Scholar]
- Kuo TY, et al. Computational analysis of mRNA expression profiles identifies microRNA-29a/c as predictor of colorectal cancer early recurrence. Plos One. 2012;7:e31587. doi: 10.1371/journal.pone.0031587. [DOI] [PMC free article] [PubMed] [Google Scholar]
- Lee L, et al. Liverome: a curated database of liver cancer-related gene signatures with self-contained context information. BMC Genomics. 2011;12:S3. doi: 10.1186/1471-2164-12-S3-S3. [DOI] [PMC free article] [PubMed] [Google Scholar]
- Li W, et al. Diagnostic and prognostic implications of microRNAs in human hepatocellular carcinoma. Int. J. Cancer. 2008;123:1616–1622. doi: 10.1002/ijc.23693. [DOI] [PubMed] [Google Scholar]
- Liang Y. An expression meta-analysis of predicted microRNA targets identifies a diagnostic signature for lung cancer. BMC Med. Genomics. 2008;1:61. doi: 10.1186/1755-8794-1-61. [DOI] [PMC free article] [PubMed] [Google Scholar]
- Locasale JW, et al. Phosphoglycerate dehydrogenase diverts glycolytic flux and contributes to oncogenesis. Nat Genet. 2011;43:869–874. doi: 10.1038/ng.890. [DOI] [PMC free article] [PubMed] [Google Scholar]
- Lu J, et al. MicroRNA expression profiles classify human cancers. Nature. 2005;435:834–838. doi: 10.1038/nature03702. [DOI] [PubMed] [Google Scholar]
- Mahadevan R, Schilling CH. The effects of alternate optimal solutions in constraint-based genome-scale metabolic models. Metab. Eng. 2003;5:264–276. doi: 10.1016/j.ymben.2003.09.002. [DOI] [PubMed] [Google Scholar]
- O’Donnell KA, et al. c-Myc-regulated microRNAs modulate E2F1 expression. Nature. 2005;435:839–843. doi: 10.1038/nature03677. [DOI] [PubMed] [Google Scholar]
- Orth JD, et al. What is flux balance analysis? Nat. Biotechnol. 2010;28:245–248. doi: 10.1038/nbt.1614. [DOI] [PMC free article] [PubMed] [Google Scholar]
- Oulas A, et al. Computational identification of miRNAs involved in cancer. Methods Mol. Biol. 2011;676:23–41. doi: 10.1007/978-1-60761-863-8_2. [DOI] [PubMed] [Google Scholar]
- Paolella P. Introduction to Molecular Biology. 1st edn. Boston, Mass: McGraw-Hill Science/Engineering/Math; 1997. [Google Scholar]
- Park JM, et al. Constraints-based genome-scale metabolic simulation for systems metabolic engineering. Biotechnol. Adv. 2009;27:979–988. doi: 10.1016/j.biotechadv.2009.05.019. [DOI] [PubMed] [Google Scholar]
- Patti GJ, et al. Innovation: Metabolomics: the apogee of the omics trilogy. Nat. Rev. Mol. Cell Biol. 2012;13:263–269. doi: 10.1038/nrm3314. [DOI] [PMC free article] [PubMed] [Google Scholar]
- Place RF, et al. MicroRNA-373 induces expression of genes with complementary promoter sequences. Proc. Natl Acad. Sci. USA. 2008;105:1608–1613. doi: 10.1073/pnas.0707594105. [DOI] [PMC free article] [PubMed] [Google Scholar]
- Pollari S, et al. Enhanced serine production by bone metastatic breast cancer cells stimulates osteoclastogenesis. Breast Cancer Res. Treat. 2011;125:421–430. doi: 10.1007/s10549-010-0848-5. [DOI] [PubMed] [Google Scholar]
- Sassen S, et al. MicroRNA—implications for cancer. Virchows Arch. 2008;452:1–10. doi: 10.1007/s00428-007-0532-2. [DOI] [PMC free article] [PubMed] [Google Scholar]
- Schellenberger J, et al. Quantitative prediction of cellular metabolism with constraint-based models: the COBRA Toolbox v2.0. Nat. Protoc. 2011;6:1290–1307. doi: 10.1038/nprot.2011.308. [DOI] [PMC free article] [PubMed] [Google Scholar]
- Serkova NJ, et al. NMR-based metabolomics: translational application and treatment of cancer. Curr. Opin. Mol. Ther. 2007;9:572–585. [PubMed] [Google Scholar]
- Shlomi T, et al. Network-based prediction of human tissue-specific metabolism. Nat. Biotechnol. 2008;26:1003–1010. doi: 10.1038/nbt.1487. [DOI] [PubMed] [Google Scholar]
- Shlomi T, et al. Genome-scale metabolic modeling elucidates the role of proliferative adaptation in causing the Warburg Effect. Plos Comput. Biol. 2011;7:e1002018. doi: 10.1371/journal.pcbi.1002018. [DOI] [PMC free article] [PubMed] [Google Scholar]
- Singh PK, et al. Regulation of Aerobic Glycolysis by microRNAs in Cancer. Mol. Cell Pharmacol. 2011;3:125–134. [PMC free article] [PubMed] [Google Scholar]
- Sotgia F, et al. Mitochondria ‘fuel’ breast cancer metabolism: fifteen markers of mitochondrial biogenesis label epithelial cancer cells, but are excluded from adjacent stromal cells. Cell Cycle. 2012;11:4390–4401. doi: 10.4161/cc.22777. [DOI] [PMC free article] [PubMed] [Google Scholar]
- Srivastava S, Chan C. Application of metabolic flux analysis to identify the mechanisms of free fatty acid toxicity to human hepatoma cell line. Biotechnol. Bioeng. 2008;99:399–410. doi: 10.1002/bit.21568. [DOI] [PMC free article] [PubMed] [Google Scholar]
- Stephanopoulos GN, et al. Metabolic Engineering: Principles and Methodologies. 1st edn. San Diego, California: Academic Press; 1998. [Google Scholar]
- Toya Y, et al. Metabolic flux analysis and visualization. J. Proteome Res. 2011;10:3313–3323. doi: 10.1021/pr2002885. [DOI] [PubMed] [Google Scholar]
- Tsavachidou D, et al. Glycogen metabolism provides nutritional support to renal cancer cells under conditions of stress and may serve as a marker of response to antiangiogenic therapy with bevacizumab. AACR Meet. Abstr. 2010;2010:PR12. [Google Scholar]
- Tsuda N, et al. Synthetic microRNA and double-stranded RNA targeting the 3’-untranslated region of HER-2/neu mRNA inhibit HER-2 protein expression in ovarian cancer cells. Int. J. Oncol. 2005;27:1299–1306. [PubMed] [Google Scholar]
- Tu SH, et al. Increased expression of enolase alpha in human breast cancer confers tamoxifen resistance in human breast cancer cells. Breast Cancer Res. Treat. 2010;121:539–553. doi: 10.1007/s10549-009-0492-0. [DOI] [PubMed] [Google Scholar]
- Van Berlo RJP, et al. Predicting metabolic fluxes using gene expression differences as constraints. IEEE/ACM Trans. Comput. Biol. Bioinform. 2011;8:206–216. doi: 10.1109/TCBB.2009.55. [DOI] [PubMed] [Google Scholar]
- Vander Heiden MG, et al. Metabolic pathway alterations that support cell proliferation. Cold Spring Harb. Symp. Quant. Biol. 2012;76:325–334. doi: 10.1101/sqb.2012.76.010900. [DOI] [PubMed] [Google Scholar]
- Vander Heiden MG, et al. Understanding the Warburg effect: the metabolic requirements of cell proliferation. Science. 2009;324:1029–1033. doi: 10.1126/science.1160809. [DOI] [PMC free article] [PubMed] [Google Scholar]
- Wang Y, et al. Reconstruction of genome-scale metabolic models for 126 human tissues using mCADRE. BMC Syst. Biol. 2012;6:153. doi: 10.1186/1752-0509-6-153. [DOI] [PMC free article] [PubMed] [Google Scholar]
- WARBURG O. On respiratory impairment in cancer cells. Science. 1956a;124:269–270. [PubMed] [Google Scholar]
- WARBURG O. On the origin of cancer cells. Science. 1956b;123:309–314. doi: 10.1126/science.123.3191.309. [DOI] [PubMed] [Google Scholar]
- Wu M, Chan C. Human metabolic network: reconstruction, simulation, and applications in systems biology. Metabolites. 2012;2:242–253. doi: 10.3390/metabo2010242. [DOI] [PMC free article] [PubMed] [Google Scholar]
- Xin F, et al. Computational analysis of microRNA profiles and their target genes suggests significant involvement in breast cancer antiestrogen resistance. Bioinformatics. 2009;25:430–434. doi: 10.1093/bioinformatics/btn646. [DOI] [PMC free article] [PubMed] [Google Scholar]
- Xionghui Zhou, et al. 2011 IEEE International Conference on Systems Biology (ISB) New York, NY: IEEE; 2011. Context-specific miRNA regulation network predicts cancer prognosis; pp. 225–243. [Google Scholar]
- Ying H, et al. Oncogenic Kras maintains pancreatic tumors through regulation of anabolic glucose metabolism. Cell. 2012;149:656–670. doi: 10.1016/j.cell.2012.01.058. [DOI] [PMC free article] [PubMed] [Google Scholar]
- Zhang S, et al. A novel computational framework for simultaneous integration of multiple types of genomic data to identify microRNA-gene regulatory modules. Bioinformatics. 2011;27:i401–i409. doi: 10.1093/bioinformatics/btr206. [DOI] [PMC free article] [PubMed] [Google Scholar]
- Zhang Y, Verbeek FJ. Comparison and integration of target prediction algorithms for microRNA studies. J. Integr. Bioinform. 2010;7:3. doi: 10.2390/biecoll-jib-2010-127. [DOI] [PubMed] [Google Scholar]
- Zhou Z, et al. Estrogen receptor alpha interacts with mitochondrial protein HADHB and affects beta-oxidation activity. Mol. Cell. Proteomics. 2012;11 doi: 10.1074/mcp.M111.011056. M111.011056. [DOI] [PMC free article] [PubMed] [Google Scholar]
Associated Data
This section collects any data citations, data availability statements, or supplementary materials included in this article.