

Abstract
Motivation: Identifying subclonal mutations and their implications requires accurate estimation of mutant allele fractions from possibly duplicated sequencing reads. Removing duplicate reads assumes that polymerase chain reaction amplification from library constructions is the primary source. The alternative—sampling coincidence from DNA fragmentation—has not been systematically investigated.
Results: With sufficiently high-sequencing depth, sampling-induced read duplication is non-negligible, and removing duplicate reads can overcorrect read counts, causing systemic biases in variant allele fraction and copy number variation estimations. Minimal overcorrection occurs when duplicate reads are identified accounting for their mate reads, inserts are of a variety of lengths and samples are sequenced in separate batches. We investigate sampling-induced read duplication in deep sequencing data with 500× to 2000× duplicates-removed sequence coverage. We provide a quantitative solution to overcorrection and guidance for effective designs of deep sequencing platforms that facilitate accurate estimation of variant allele fraction and copy number variation.
Availability and implementation: A Python implementation is freely available at https://bitbucket.org/wanding/duprecover/overview.
Contact: wzhou1@mdanderson.org, kchen3@mdanderson.org
Supplementary information: Supplementary data are available at Bioinformatics online.
1 INTRODUCTION
Many somatic mutations, including known driver mutations, are found in only a subset of tumor cells (Gerlinger et al., 2012). Detecting the presence of these subclonal mutations and estimating their population size can critically affect the clinical diagnosis and therapeutic intervention of individual cancer patients (Farhangfar et al., 2013). This realization has led to the rapid development of deep sequencing as a molecular diagnostic platform in cancer clinics (Wagle et al., 2012). Estimating the variant allele fraction (VAF) from somatic samples sheds light on the intrinsic sample heterogeneity that originates from somatic mutations, and hence the etiology of many diseases, particularly cancer (Cibulskis et al., 2013; Ding et al., 2012; Nik-Zainal et al., 2012; Shah et al., 2012). In addition, genomic regions (such as genes or exons) may exist in different numbers of copies due to mutational events such as duplication and deletion. This is referred to as copy number variation. In oncology, comparisons between copy numbers of different genes or between copy numbers of the same gene from different samples (normal versus tumor tissue, for instance) disclose signs of any selective pressure driving tumorigenesis (Dewal et al., 2010). Both tasks can be approached by counting reads from next-generation sequencing (NGS) experiments (Mardis, 2011).
In practice, read counting is complicated by amplification bias, namely, the bias as a result of the preference of the polymerase chain reaction (PCR) in reproducing reads of different lengths and compositions (Aird et al., 2011; Minikel, 2012). Removing duplicate reads—reads of the same length and sequence identity—is a widely used practice to correct this bias when analyzing NGS data (Fig. 1a) (DePristo et al., 2011; Li et al., 2009). The underlying assumption of this approach is that PCR amplification is responsible for most of the read duplication. Extending from this assumption, a long-standing recognition has been held in the community that removing duplicate reads at least does not harm the data.
Fig. 1.

Duplicate read removal and insert cover. Duplicate reads removal for (a) single-end reads at a single SNV site. The arrow indicates the procedure of duplicate read removal, (b) single-end reads at multiple sites, (c) paired-end reads at single SNV site and (d) paired-end reads at multiple SNV sites. Each color of the inserts corresponds to a unique insert cover, λ. Boxed reads are regarded as duplicates and are removed
An alternative source of read duplication is sampling coincidence, whereby inserts are fragmented at identical genomic positions during library construction. The practice of removing duplicate reads is well justified only when the sequencing depth is low and sampling coincidence is unlikely. This was true when most NGS applications were of low sequencing depths and were oriented toward uncovering germline mutations from monoclonal samples. However, as recent studies that aim to detect rare somatic mutations from heterogeneous samples have pushed sequencing depth to a high magnitude (Ding et al., 2012; Shah et al., 2012), the validity of this assumption requires serious re-evaluation.
This article provides a quantitative understanding of the source of read duplication by quantifying the read duplication that is induced by sampling coincidence. By providing a statistical formulation for the bias of the allele fraction estimator based on de-duplicated reads, we are led to conclude that at a high sequencing depth, the practice of duplicate read removal can overcorrect amplification bias. From simulations, we show that the extent of overcorrection is jointly determined by the sequencing depth, the variance of the insert size, the strategy used for marking duplicate reads and intrinsic sequence properties, such as the existence of segregating sites in the neighboring region and the linkage disequilibrium (LD) pattern among sites.
To quantify the amount of sampling-induced read duplication, we applied our model and overcorrection amendment method to data from a clinical cancer sequencing platform that produces  to
to  sequence coverage to exons in 202 targeted cancer genes. Consistent with the currently applied assumption behind duplicate read removal, we found that PCR amplification, rather than sampling coincidence, is responsible for most read duplication. When duplicate reads are removed, the read depth is not as high as originally designed from the experiment, reflecting an insufficient sample complexity in the experiment. However, for reads that are treated as single-end reads because the corresponding mates cannot be identified (∼one-tenth of reads), sampling-induced read duplication is not rare. Further, when we artificially mixed different deep sequencing samples to a much higher read depth, we observed more sampling-induced read duplication, as expected. Hence, we predict that further increases in sequencing depth or reduction in insert size variation may lead to non-negligible biases that require a method of correction such as what we provide in this article.
In the field of RNA-seq, where read count is used to estimate transcription level, two recent studies have taken into account ‘natural duplication’ (Baumann and Doerge, 2013; Mezlini et al., 2013). This concept is analogous to what we study in this article, albeit studied without systematic investigation of segregating sites or VAF bias. With that in mind, the contribution of this article is 3-fold. First, we call attention to the potential bias in estimating VAF and copy number variation due to overcorrecting read counts in deep DNA sequencing (particularly whole exome sequencing for clinical applications). Although duplicate read removal does not lead to substantial overcorrection on the datasets we studied, our simulations demonstrate that overcorrection from duplicate read removal could be substantial at smaller insert size variances and higher read depths. Second, we provide insights into the design of ultra-deep sequencing experiments such that duplicate read removal is most effective and overcorrection is minimal. Third, we propose a practical computational method for estimating the amount of sampling-induced read duplication for evaluating whether a dataset is amenable to de-duplication and for amending the overcorrection. Through simulations, we show that our methods can recover the true VAF or copy number variation (up to the extent permitted by the data).
2 METHODS
2.1 Modeling sampling-induced read duplication
We start by considering a single nucleotide variation (SNV) site with no segregating sites in the neighboring region. Let n be the number of inserts that cover site v (read depth), the VAF of allele i at site v be denoted by pi,  , p be the vector composed of pi and
  , where Σ is the set of alleles. For a single site,
  . Because v is the only segregating site in this region, we classify unique inserts—inserts with distinct start and end locations when aligned—by the insert size and the allele identity at v. Each element in the matrix
  stands for the number of unique inserts of length l and covering allele
  at v. Likewise, c is a matrix where
  denotes the number of reads (not necessarily unique) of length l and covering allele h at v. The probability of observing unique read configuration m given the underlying allele fraction p can be modeled by marginalizing out all possible values of insert size configuration
  and read count configuration c.
| (1) |
where  is the vector of the number of inserts of each insert size, i.e.
  is the number of inserts of insert size l.
  can either be learnt from data or modeled using a multinomial distribution with normally distributed means (Supplementary Section S1).
  models the sampling of inserts that covers each of the alleles in a multinomial distribution,
  or
or
 |
(2) |
assuming the probability of an insert covering allele h is independent of the probability of it having a certain insert size, l.
The term  models the sampling coincidence. Assuming that the position samplings of reads of different lengths and allele identities are independent, the joint probability can be expressed in the product
  . Given an insert size l, there are
  ways of positioning the read, where r is the read length (Fig. 1c). In other words, there are only η possible unique inserts that can cover site v for each allele. We assume for one sampling that seeing each of the η candidate inserts is equally probable. The probability of obtaining
  unique inserts from sampling a total of
  reads can be described by the following distribution:
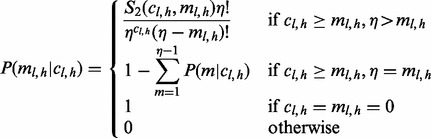 |
(3) |
where  denotes the Stirling number of the second kind (Abramowitz and Stegun, 1972). See Supplementary Section S1.1 for a detailed derivation of this expression.
2.2 Generalizing to multiple sites
The aforementioned formulation can be extended to multiple sites that are close to each other and can potentially be covered by the same insert. Because neighboring SNV sites can alter the probability of sampling-induced duplication at the target site (Section 3), it is best to consider SNV sites that are covered by at least one insert as one multiple nucleotide variation site, when estimating sampling-induced duplication.
Let ξ be a maximum phasable window (MPW), which is defined as a set of contiguous SNV sites in the genome such that no insert simultaneously covers an SNV site inside and outside the window. Let w be the number of SNV sites in ξ, H be the set of all possible haplotypes and  . For example, if all sites are biallelic,
  . The distances between these SNV sites (the number of nucleotides in between plus one) are denoted by
  . An insert cover
  is the set of SNV sites that are visible from the insert. Λ is the set of all insert covers (see Fig. 1b and d for an illustration). For inserts composed of one single-end read, there can be
  different insert covers. For inserts of two paired-end reads, the number of all possible insert covers is
  . The number of SNV sites included in the cover
  is denoted by
  . For each cover λ,
  denotes the set of haplotypes defined by sites in λ. Two haplotypes defined on different covers are compatible if they agree on the shared sites. Haplotypes defined on non-overlapping inserts are by definition always compatible. We use the notation
  to indicate compatibility. Because a certain insert size allows for only a subset of insert covers of ξ, we use notation
  to denote the set of insert covers that is allowed by inserts of insert size l. We use
  to denote the number of unique inserts observed from the data that have insert size l and that cover
  , and
, and  to denote the number of all possible unique inserts of length l and that cover λ (see Supplementary Section S2 for a computation of
  in both cases of single-end and paired-end reads).
The fraction of unique reads reporting each haplotype on the entire MPW is  . In contrast to the single site case in which each read that covers the target site v can unambiguously resolve the allele identity, only the cover
  that includes all sites (the ‘widest’ cover) can phase the full haplotype. The other covers only restrict the possibilities to a smaller subset of haplotypes. Reads of different covers contribute differently to the VAF for the full haplotype. Therefore, we need to separately consider read counts for reads with different lengths and covers.
Following the notations used in the single site case, m is the number of unique reads that at least partially overlap with ξ, except that m is now a multilinear integer field:  . The domain of m is jointly and incrementally delineated by (i) the insert size (
 ), (ii) the insert cover (
 ) and (iii) the haplotype revealed by the cover (
 ). The same applies to c, which denotes actual insert counts with a specific l, λ and h. Extending from Equation (1), the probability of obtaining
  unique inserts can be modeled by marginalizing out all possible insert size configurations (
 ), cover configurations (
 ) and read count configurations (c):
| (4) |
Here,  (an element of
  ) is the number of reads (not necessarily unique) that are of insert size l,
  (an element of
  ) is the number of reads that are of insert size l and cover λ (see Supplementary Section S3 for details),
  is a vector and
  is a matrix. When there is only one site (w = 1), Λ contains only one cover. Hence,
  and
and  have the same dimension and a one-to-one correspondence. The aforementioned derivation reduces to the single nucleotide case [Equation (1)].
To model insert positions,  , assuming independence of sampling from the insert size, cover and haplotypes.
  has the same form as the single site case [Equation (3)] after replacing
  with
with  ,
,  with
with  and η with
  . The probability of the insert’s haplotype is modeled as a multinomial distribution. And the assignment of inserts to different haplotypes is assumed to be independent from the insert size and the cover. The haplotype sampling has the following form:
 |
(5) |
which is the same as Equation (2), except that  . That is, the expectation of haplotype h is the sum of the expectations of all the haplotypes
  on the full MPW that are compatible with h.
The term  models the sampling of covers given inserts with particular sizes in a multinomial distribution or
  . The expectation for the count of inserts having a particular cover is proportional to the number of unique inserts with that cover:
  .
.
2.3 Variant allele fraction estimator
For cases with single SNV sites, the allele fraction is estimated by computing the proportion of all unique inserts of that allele over all possible insert sizes, i.e.  , where
 |
For cases with multiple sites, due to the ambiguity encountered in phasing the haplotype on the full MPW from inserts with  , the haplotypes of the entire MPW can be estimated by maximizing the likelihood function defined in Equation (5) and replacing c by m (which is considered the corrected read count), i.e.
2.4 Amending read count overcorrection
In practice, the number of unique inserts (m) is used where read count (c) is meant because the observed read count is believed to have been distorted by amplification biases. However, due to the presence of sampling-induced read duplication, such treatment can be a substantial overcorrection of the read count (Section 3). Hence, we seek a maximum likelihood estimation  of c from m by
| (6) |
Here, the likelihood function is given by Equation (3) with irrelevant multiplicative terms omitted. The Stirling numbers are precomputed and retrieved in constant time. Equation (6) assumes  and
and  . When
  , no such insert is possible. When
  ,
,  is unbounded. This is the case of saturation. Intuitively, the more inserts one provides, the more likely saturation will be attained. Hence, inserts of lengths that result in saturation do not contribute to our understanding of the VAF, and we exclude inserts of such lengths in our read count correction. In the case where read counts from multiple alleles are compared, inserts of a length are excluded for all alleles even if they saturate the read count for only one allele.
The allele fraction is then estimated from the corrected read count by  , where
  is the set of all insert sizes such that inserts of that insert size saturate the read count for none of the alleles, i.e.
  .
.
Figure 2 plots the correction of read counts for the simplest case, where reads are single-end and of length 200. When unique read count is low ( ), the correction is negligible. The corrected read count surges drastically as the unique read count approaches the read length.
Fig. 2.
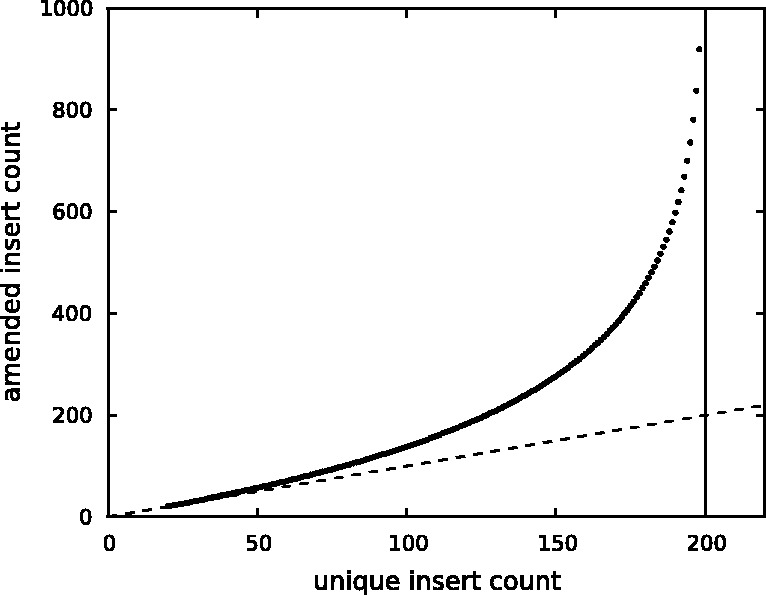
Read count correction. The dashed line corresponds to y = x. The vertical line is at x = 200 and corresponds to saturation
Generalizing to multiple sites, the de-duplicated read counts for a given insert size, cover and haplotype can be amended by the same formula as Equation (6), but replacing  with
with  and η with
  .
.
The fractions of haplotypes of the entire MPW are estimated from the corrected c by maximizing the likelihood function defined in Equation (5). Here, the count of inserts of each insert size and cover ( ) can be obtained from the data. After omitting the irrelevant multiplicative terms, the log likelihood function breaks down to
| (7) |
where 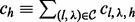 . As in the case of single site, we exclude in our estimation all the combinations of insert size and cover such that any haplotype of the combination is saturated:
  .
.
Owing to the constraint  , we regard the frequency of an arbitrarily chosen haplotype
  as being dependent on the other haplotype fractions:
 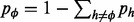 . The gradient of the likelihood function has the following expression:
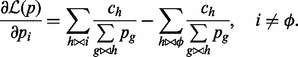 |
Then we apply a conjugated gradient method to optimize the likelihood function.
Because the estimation of  is subject to greater randomness when
  , we loosen the criterion for saturation to
 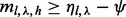 , where the parameter
  (i.e. we also exclude combinations of insert size and cover with
  ).
).
3 RESULTS
3.1 Overcorrection from duplicate read removal
The number of unique reads of a particular length that can cover a site is equal to the read length. Intuitively, when the read depth tends to infinity, the number of reads that support each allele at the target site is equal to the read length regardless of the underlying allele fraction. In Supplementary Section S4, we give a brief proof of this intuitive conjecture that  is biased.
3.1.1 Higher coverage and lower insert size variance result in greater bias
We use simulations to investigate various factors that affect bias in the following. We restrict our analysis to single-end reads for this section. The conclusions can be readily extended to paired-end reads by properly choosing the number of reads/inserts that cover a site by replacing  with
with  . Hence, in the following text, we use the terms ‘read’/‘insert’ and ‘read length’/‘insert size’ interchangeably unless specified.
Consider a scenario where three alleles exist for a site v in the sample. These three alleles have the following VAFs: 1/8, 3/8 and 4/8. We first consider the simplified scenario where the insert size is fixed at 200. We compare the biases against the numbers of reads that cover a specific site v (or the coverage at v). As expected, the estimated allele fractions deviate from their true value as coverage increases (see Supplementary Fig. S2). Thus, we corroborate our theoretic prediction that the VAF estimation may be biased when sequencing depth is high and sampling-induced read duplication is non-negligible.
When the insert size is allowed to vary, we investigate the joint effect of the mean as well as the variance of the insert size distribution under the aforementioned simulation setting. We observe that the longer and the more variant the insert size, the greater the number of unique reads that can cover site v (see Supplementary Fig. S3). This can be understood by knowing that higher variance in insert size effectively helps differentiate reads and reduce sampling-induced read duplication.
The extension of PCR amplification also depends on the insert size. The use of precision in selecting the insert size helps reduce the PCR amplification bias; but on the other hand, it introduces bias if duplicate reads are removed. Thus, the choice of different insert size selection directly affects the subsequent data analysis strategy, namely, whether to perform duplicate read removal (Section 4).
For samples with clonal heterogeneity, sites are usually biallelic and the fraction of the minor variant has the most clinical relevance. In Figure 3, we provide an estimation of the magnitude of the bias at different settings of the two most important factors: the coverage and the insert size variation. By mapping to this heat map, one may get a rough estimate of the magnitude of the bias in his/her estimation of the VAF. For example, when one has an insert size standard deviation ∼20 and coverage ∼5000, the bias is ∼0.01, which is ∼20% compared with the true value at 0.05. See Supplementary Section S7 of bias plots at different VAF values (which are qualitatively similar).
Fig. 3.
The VAF bias determined by coverage and insert size variance. Reads are paired-end and read length is 76. The insert size distribution is modeled as a Gaussian distribution with mean at 200 and standard deviation shown on the x-axis. The true VAF is 0.05. The darkness at each position indicates the magnitude of the bias in the VAF
3.1.2 Low entropy allele fractions are more biased, and germline samples remain unbiased
In investigating the bias in specific allele fraction configurations, we also observe that the VAF bias is inversely correlated with the information entropy of the VAF configuration, which is defined as  . This trend can be understood by considering the fact that the convergent
  —all alleles are equiprobable—has maximum entropy given the number of alleles. To illustrate this by simulation, we randomly sample VAFs of the four alleles and for each VAF, we estimate the magnitude of the bias (Supplementary Fig. S6). The higher the VAF entropy, the lower is the VAF bias (Spearman’s
  ). Another corollary from this observation is that VAF estimation in germline samples remains unbiased if no segregating sites exist in the neighboring region.
3.1.3 Segregating sites in the neighboring region and LD
In deriving the overcorrection bias on single sites, we assume that the neighboring region has no segregating sites. In cases where the neighboring region does contain segregating sites, we can estimate the asymptotic value of the estimator  as coverage tends to infinity by
  , where
  is the number of unique haplotypes that cover allele i within the reach of each insert size.
In Supplementary Figure S7, we simulate the previous example of three alleles but introduce segregating sites in the neighboring region and investigate the bias. Intuitively, neighboring segregating sites help increase the number of unique reads that cover the target site. When all the segregating sites are in linkage equilibrium, the magnitude of the bias is reversely associated with both the number of segregating sites and the number of alleles per site (Supplementary Fig. S7). Because of linkage equilibrium, 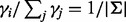 . In other words, each allele at the target sites is paired with an equal number of haplotypes defined by the alleles in the neighboring sites (
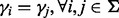 ). Therefore, the limiting VAF estimates remain the same.
In computing  , the knowledge of the positions of these segregating sites or how far they are from the target site is a prerequisite. The farther they are from the target site, the less likely it is that a read can be positioned to cover both the target site and the segregating sites, resulting in a weaker effect of these segregating sites. We simulate a simplified scenario with only one extra segregating site (Supplementary Fig. S8). The magnitude of the bias is compared against the distance between the neighboring segregating site and the target site. As expected, we observe that the longer the distance, the greater is the bias. Combining the previous conclusion that the presence of a segregating site reduces the bias helps us understand this result by considering a diminishing reductive effect from the sites farther from the target.
When the neighboring sites are in LD with the target site, the limiting VAF estimates deviate from  . For simplicity in computing the LD, we consider a scenario where both the target site and the segregating site (there is only one) contain two alleles. We consider two scenarios: (i) the target site has an allele fraction of
  and (ii) the target site has an allele fraction of
  . The first scenario corresponds to the case where there is sample heterogeneity or somatic copy number variation. The second scenario corresponds to pure germline samples. In the first case, the segregating site has allele fraction
  . In the second case, we assess both
  and
and  for the allele fraction on the segregating site. In both scenarios, we find that both the mean and the variation of the VAF determined by the level of LD and allele fraction estimated from germline samples remain unbiased (see Supplementary Section S10 for details).
In summary, the bias caused by overcorrecting sampling-induced read duplication when removing duplicate reads is affected not only by the number of segregating sites in the neighboring region but also their positions and the linkage pattern between the target site and the segregating sites. For a correct estimation of the allele fraction at a site where the neighboring region contains other SNV sites, it is more appropriate to treat these SNV sites together with the target site and estimate haplotype frequency on the entire DNA segment (the so-called MPW), the neighborhood of which we can assume has no segregating sites (Section 2). The subsequent allele fraction at a single site is a direct summation of the fractions of all the haplotypes with the allele defined on this segment.
3.2 Read count amendment in simulations
To assess our amendment to the overcorrection of duplicate read removal, we conduct two simulations. In one, we target detecting copy number variation by estimating the ratio of the copy number at a single site in two different samples. In the other simulation, we estimate the VAF at a multiple nucleotide variation site composed of two neighboring SNV sites.
Suppose we have two sets of reads that cover a site v. They correspond to tumor and normal samples from the same cancer patient. We want to compute the copy number variation between the two samples. Suppose e1 and e2 are the respective copy numbers of a site from the two samples, respectively, and c1 and c2 are the observed counts of reads from the two samples. To model the amplification bias, we introduce ϵ such that  .
.
To illustrate the joint effect of bias that arises from amplification and bias from removing sampling-induced duplication, we consider the situation where  . We suppose that amplification has preferentially enriched alleles in the second sample by
  , i.e. each read in the second sample is amplified twice as much as the reads in the first sample. At low coverage, if one removes all read duplicates (as depicted in red in Supplementary Fig. S11), one obtains a copy number variation with an expectation closer to the true ratio of 1/3. But the expectation starts to deviate from the true copy number variation and approaches the saturation ratio at one as coverage increases. The blue dots and boxes correspond to a process of counting reads without removing read duplicates. Their expectations remain at the biased ratio of 1/6. In both cases, the variance drops with the rise of coverage. This illustrates that although the removal of duplicate reads corrects for amplification bias at a low coverage, as coverage increases, overcorrection caused by removing sampling-induced read duplication is introduced.
In Supplementary Figure S11, the green boxes correspond to the amendment based on de-duplicated read counts. As shown in the figure, the correction successfully brings the biased read count ratio back to the true copy number variation. Although the variance of the copy number variation based on the amendment also has a reduced variance as coverage increases while remaining under 2000, it plateaus as coverage further increases. This is in contrast to the copy number variation estimated from the raw read count (Section 4). Again, this result emphasizes the distinct origins of read duplication: sampling coincidence and amplification artifact. Our overcorrection amendment method is capable of recovering sampling-induced read duplication as is necessary for accurately estimating copy number variation.
In the second simulation, we model the estimation of the haplotype frequency of a double nucleotide variation. Suppose the two SNV sites are 50 bp apart, and both sites are biallelic. Let  and
and  denote the alleles at the two sites. The haplotype frequencies for
  are 0.1, 0.3, 0.3 and 0.3, respectively. To introduce amplification bias, we amplify reads from the four haplotypes to folds of 2:2:2:1. Supplementary Figure S12 shows the estimation of the haplotype frequency of
  , which has a true haplotype frequency of 0.3. As shown in blue, estimation based on all the reads suffers from the amplification bias and is different from the true value of 0.3. As shown in red, estimation based on de-duplicated reads also deviates from the true value and converges toward 1/4 (which is one divided by the number of haplotypes) as coverage increases. Both estimates have a reduced variation as coverage increases. Estimation based on the amendment (green color) remains unbiased at the true haplotype frequency. Thus, the use of our amendment again corrects the bias in haplotype frequency estimation. In contrast to the estimates made without applying the amendment, the amended haplotype frequency has a reduced variance only before coverage reaches ∼3000, which is the coverage at which some combinations of cover and insert size begin to become saturated (data not shown).
3.3 Sampling-induced read duplication in clinical sequencing data
We apply our methods to a cancer dataset, T200 (SRA accession: SRP033243), in which the exons of 200 cancer-related genes are sequenced to a read depth of  (
( after removing read duplications). DNA samples obtained from lung cancer cell lines with known mutations are sequenced on a HiSeq 2000 (Illumina Inc., San Diego, CA, USA) on a version 3 TruSeq paired end flowcell according to the manufacturer’s instructions, at a cluster density between 700 and 1000 K clusters/mm2. In the T200 dataset, the insert sizes have mean
  and a relatively large variance (
 ). Compared with a normal distribution, the distribution of the insert size is skewed toward the long end (Supplementary Fig. S13). Because most reads are of a fixed read length (76 in some of the samples and 100 in others, depending on the sequencing platform), we regard reads of other read length as of poor quality and exclude them from the analysis.
From 675 SNV sites called from one sample, 371 contain no other segregating sites within 700 bp, and the other 304 SNV sites are organized into 77 MPWs. Each contains 2–32 SNV sites. Figure 4 shows plots, for the single site cases, of the read counts before and after duplicate read removal (y- and x-axes of the ‘x’ markers) together with the maximum likelihood amendment of the read count based on de-duplicated reads (dots). The left panel shows sampling-induced duplication based on marking the duplicate reads and accounting for the mate reads. In contrast to the large deviation of the ‘x’ markers from the x = y line, the dots are close to this line, meaning that sampling-induced read duplication is rare in this case. Most read duplication is probably due to PCR amplification rather than sampling coincidence.
Fig. 4.

Read count in T200 data. Left panel: paired-end reads duplication removal for single SNV site. That is, insert size is accounted for while marking duplicates. Right panel: Treat paired-end reads as single-end reads, i.e. the mate reads are ignored. Sites are single SNV sites. The ‘x’ markers correspond to counting reads without removing duplicates. Dots correspond to the read count correction using the model presented in this article. The dashed gray line is the x = y line. Each dot corresponds to a combination of the site, allele at the site and insert size of the reads that cover the site. The same unique read counts can be corrected to different values as a result of different insert sizes
The right panel shows the same result but for marking the duplicate reads as if they are single-end reads. This is done because in some instances, the two mate reads are not well sequenced or mapped. In this dataset, we found 204 895 such single-end reads aside from 790 142 complete inserts (the mate reads of which can be identified). In contrast to paired-end reads, single-end reads are more susceptible to sampling-induced read duplication because they lack the mate read information that differentiates themselves from other reads. Similar results are observed from multiple sites (Supplementary Fig. S14).
To illustrate sampling-induced read duplication under this insert size variation, a higher read depth is necessary. We mix reads from 82 samples from the T200 dataset. In this way, we obtain one dataset of up to 10 000 coverage. After de-duplication, only about one-tenth of the reads is left (Table 1); therefore, the read depth is not as high as it seems. Only complete inserts are used in computing the VAF. In the rightmost column of Table 1,  indicates the VAF when accounting for sampling-induced duplicate reads, but not those originating in the amplification process. In the four sites we show in Table 1, the value of
  lies between that of the allele fraction calculated from raw inserts (pv) and the allele fraction calculated from de-duplicated inserts (
 ). In all four sites,
  deviates from
  , which is an indication of the presence of sampling-induced duplication. The magnitude of deviation is higher for sites with higher coverage, which is consistent with the simulation results.
Table 1.
The VAF in T200 dataset
| Mutation | n | nd | pv |  |
 |
|---|---|---|---|---|---|
| KRAS(G12C) | 128 746 | 11 449 | 0.1373 | 0.2604 | 0.2306 |
| KRAS(Q61H) | 120 312 | 10 221 | 0.0509 | 0.0647 | 0.0532 |
| PIK3CA(E545K) | 76 657 | 7842 | 0.034 | 0.0414 | 0.0354 |
| STK11(Q37X) | 23 867 | 3362 | 0.1365 | 0.2073 | 0.2019 |
Note: All sites are biallelic. n is the number of inserts; nd is the number of inserts after de-duplication; pv is the VAF computed using all inserts;  is based on de-duplicated inserts; and
  is computed by applying the maximum likelihood amendment described in this article.
A strategy to reduce sampling-induced read duplication is to divide the samples into different batches. This way, some sampling duplicates can be distinguished by their batch origin. To simulate this process, we merge different numbers of samples from the T200 dataset. Conceptually, combining samples from the same sequencing platform and ignoring the sample identity is equivalent to obtaining a greater sample from the experiment when the underlying sample complexity is properly augmented correspondingly. As shown in Figure 5, the greater the number of samples merged, the stronger is the bias due to more sampling-induced read duplication.
Fig. 5.
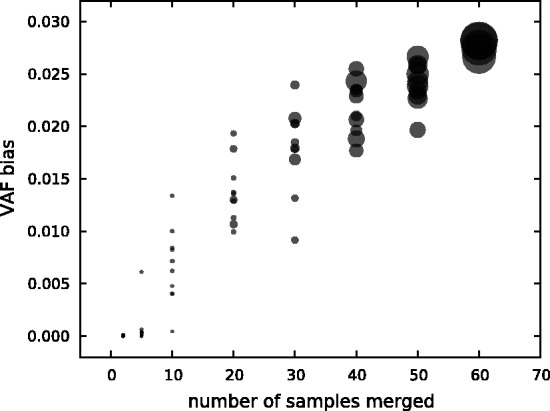
VAF bias on merging T200 samples At each number of samples merged, we randomly select the given number of samples from 65 samples with >1000 read depth at the target site. The target site shown in the plot is chr12:25398285 (KRAS). The size of each circle indicates the read depth of the corresponding sample aggregation
4 DISCUSSION
It has been generally perceived that the accuracy of allele fraction estimation can be infinitely improved by increasing sequencing depth. The practice of duplicate read removal may be a limiting factor for this improvement. This is because when read depth is high, sampling-induced read duplication becomes more common and their removal can disproportionately distort the read count. The overcorrection amendment method introduced in this article alleviates this problem, yet still fails to obtain an accurate estimation of the original read count when the number of unique reads is close to or at saturation (the variance of the maximum likelihood estimator tends to infinity). In fact, as coverage increases, more and more combinations of insert size and cover are saturated. The variance of the haplotype frequency estimation is not reduced as compared with the clear enhancement of the accuracy of the estimation made from raw reads or de-duplicated reads (Supplementary Fig. S12). Another reason is that the number of unique reads m is constrained to integers. The variance cannot be further reduced as coverage approaches the point where  (saturation; see green dots and boxes in Supplementary Fig. S11). In fact, as m reaches a value close to l,
  can never be reached. Thus one cannot accurately amend the VAF from the estimator
  based on one single sequencing experiment. This is again in contrast to the estimator keeping duplicate reads
  where
where 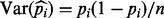 , where the higher the coverage, n, the smaller the variance and hence the more accurate the estimation.
The choice of performing duplicate read removal depends on whether the target quantity (e.g. VAF or copy number variation) is distorted (disproportionately amplified) by read duplication. The potential cause for distortion is PCR amplification bias and the bias introduced from removing sampling-induced read duplication. Insert size variance is a key player in determining the extent of both forms of biases. Data with large variances in insert size are more susceptible to PCR amplification bias but less susceptible to sampling-induced read duplication. For such datasets, duplicate read removal is more appropriate. On the other hand, for data with sharply selected insert sizes, PCR amplification bias is smaller, whereas sampling-induced read duplication is more frequent.
In practice, the reported sequencing depth may be misleading as it contains a large proportion (typically 30–70%) of amplification-induced duplicate reads. These duplicate reads do not help improve the measurement of the sample DNA. More specifically, the number of ligated fragments that can eventually be captured by emulsion beads (ABI SOLiD and Roche 454 sequencing) or by forming clusters on the flow cell lawn (Illumina Solexa sequencing) is smaller than that of the sequenced reads. For most applications that aim to decipher the VAF or copy number, the more appropriate definition of read depth should exclude PCR amplification-induced duplication. Based on such definition, some ultra-deep sequencing datasets may not be as deep as they seem.
An important limitation to the true read depth is the amount of sample DNA fragmented in the initial stage of the sequencing experiment or the so-called sample complexity. Assuming that all sites from the whole genome have equal amounts of DNA and no molecule is lost from fragmentation and size selection, the theoretical coverage limit can be calculated by  , where w is the weight of the DNA to start a sequencing experiment.
  is the average molecular weight of DNA molecules per base pair.
  is the length of the genome and NA is Avogadro’s constant. In deep sequencing experiments, w typically ranges from 200 to 500 ng, meaning that the upperbound of the coverage is from
  to
to  . This calculation assumes no loss from size selection and ligation, which is unrealistic. If the procedure that includes fragmentation, ligation, size selection and single molecule capturing loses
  of these molecules (which is not unlikely considering the chance of obtaining the desired insert size from random fragmentation), the coverage limit is only several thousands. Further, because not all sites are equally represented in the original DNA sample and some samples (e.g. those from tumors) have an abnormally higher ploidy and hence a higher L, the coverage limit may be even lower. Therefore, if one starts from a small amount of DNA (e.g. 10 ng) and sequences to a high coverage (e.g.
  ), most reads will necessarily be duplicates from PCR amplification. That being said, for samples with high coverage and truly high complexity, sampling-induced read duplication will become non-negligible.
Many factors besides the issue of read duplication can impact the VAF estimation. For example, bias in ligating fragments to the adaptor during library construction in the experiment can cause uneven sampling of inserts at different genomic positions. Our model assumes a uniform fragility of the genome; however, real sampling may be biased by base content and produce certain inserts more often than others, which will further aggravate sampling-induced read duplication. This variation in the capturing efficiency also applies to different exons in whole exome sequencing. In addition, the quality of alignment impacts the read count for a mutation site. For example, most alignment algorithms tend not to map/report mutations, SNVs or small indels, at the ends of the reads. This results in an underestimation of reads that have mutations at their ends. Further, reads that originate from paralogous regions may be mismapped, which will confound the VAF estimation when alleles from all paralogous sites are agglomerated and there exists a coverage bias between the paralogous region and the target region. This issue may also result from erroneous fetching of DNA sequences from undesired sources.
Our method can be extended to the scenario where one has knowledge of the mutations and is further interested in estimating the copy number variation (as in some cases of RNA-seq). For RNA-seq data, sampling-induced read duplication can be more extensive due to the uneven distribution of gene expression (highly expressed genes are more susceptible; see Supplementary Section S15 for an application to RNA-seq data). Compared with RASTA (Baumann and Doerge, 2013) and iReckon (Mezlini et al., 2013), our method does not make decisions as to the amount of sampling-induced read duplication for each unique insert/read. Rather, our method relies on the number of observed unique reads covering the target mutation site to infer the true count of reads that are not necessarily unique.
Besides computational remedies to amplification duplications, some recently emerging experimental techniques are showing promise as ways to resolve the current dilemma of read duplication. For example, in digital-PCR (Shiroguchi et al., 2012), each fragment is given a unique identifiable barcode before amplification, which allows for the estimation of fragment abundance by merely counting the barcodes. With further reduction in cost and removal of restrictions in sequencing depth (Baumann and Doerge, 2013), such a technique may replace the currently used paradigm of estimating allele frequencies.
5 CONCLUSION
Removing read duplicates, while correcting for PCR amplification bias, could introduce another bias owing to overcorrection of read counts as a result of sampling-induced read duplication. This bias is of particular concern when the sequencing is deep (e.g.  ) and the insert size is short and non-variant. A maximum likelihood amendment can be applied to the number of de-duplicated reads to account for sampling-induced read duplication. Sampling-induced read duplication in most current ultra-deep sequencing experiments is not prevalent due to the presence of a substantial amount of PCR amplification-originated duplicate reads. Nevertheless, attention must be paid to duplicate read removal in ultra-deep sequencing experiments that perform fewer rounds of PCR amplification and use tightly selected insert sizes.
Supplementary Material
ACKNOWLEDGEMENT
The authors thank LeeAnn Chastain for her careful proofreading and three anonymous reviewers for detailed constructive comments that greatly improved the manuscript.
Funding: The National Cancer Institute [grant R01-CA172652-01 to KC and grant P30 CA016672]; The MD Anderson Odyssey recruitment fellowship (to W.Z.); and the MD Anderson Cancer Center Sheikh Khalifa Ben Zayed Al Nahyan Institute of Personalized Cancer Therapy.
Conflict of Interest: none declared.
REFERENCES
- Abramowitz M, Stegun IA. Handbook of Mathematical Functions with Formulas, Graphs, and Mathematical Tables. 1972. Stirling numbers of the second kind. Chapter 24.14, 9th edn. Dover, New York, pp. 824–825. [Google Scholar]
- Aird D, et al. Analyzing and minimizing PCR amplification bias in Illumina sequencing libraries. Genome Biol. 2011;12:R18. doi: 10.1186/gb-2011-12-2-r18. [DOI] [PMC free article] [PubMed] [Google Scholar]
- Baumann DD, Doerge RW. Robust adjustment of sequence tag abundance. Bioinformatics. 2013 doi: 10.1093/bioinformatics/btt575. [Epub ahead of print, 10.1093/bioinformatics/btt575] [DOI] [PubMed] [Google Scholar]
- Cibulskis K, et al. Sensitive detection of somatic point mutations in impure and heterogeneous cancer samples. Nat. Biotechnol. 2013;31:213–219. doi: 10.1038/nbt.2514. [DOI] [PMC free article] [PubMed] [Google Scholar]
- DePristo MA, et al. A framework for variation discovery and genotyping using next-generation DNA sequencing data. Nat. Genet. 2011;43:491–498. doi: 10.1038/ng.806. [DOI] [PMC free article] [PubMed] [Google Scholar]
- Dewal N, et al. Power to detect selective allelic amplification in genome-wide scans of tumor data. Bioinformatics. 2010;26:518–528. doi: 10.1093/bioinformatics/btp694. [DOI] [PMC free article] [PubMed] [Google Scholar]
- Ding L, et al. Clonal evolution in relapsed acute myeloid leukaemia revealed by whole-genome sequencing. Nature. 2012;481:506–510. doi: 10.1038/nature10738. [DOI] [PMC free article] [PubMed] [Google Scholar]
- Farhangfar CJ, et al. The impact of tumor heterogeneity on patient treatment decisions. Clin. Chem. 2013;59:38–40. doi: 10.1373/clinchem.2012.194712. [DOI] [PubMed] [Google Scholar]
- Gerlinger M, et al. Intratumor heterogeneity and branched evolution revealed by multiregion sequencing. N. Engl. J. Med. 2012;366:838–892. doi: 10.1056/NEJMoa1113205. [DOI] [PMC free article] [PubMed] [Google Scholar]
- Li H, et al. The sequence alignment/map format and SAMtools. Bioinformatics. 2009;25:2078–2079. doi: 10.1093/bioinformatics/btp352. [DOI] [PMC free article] [PubMed] [Google Scholar]
- Mardis ER. A decade’s perspective on DNA sequencing technology. Nature. 2011;470:198–203. doi: 10.1038/nature09796. [DOI] [PubMed] [Google Scholar]
- Mezlini AM, et al. iReckon: simultaneous isoform discovery and abundance estimation from RNA-seq data. Genome Res. 2013;23:519–529. doi: 10.1101/gr.142232.112. [DOI] [PMC free article] [PubMed] [Google Scholar]
- Minikel EV. How PCR Duplicates Arise in Next-Generation Sequencing. 2012. http://www.cureffi.org/2012/12/11/how-pcr-duplicates-arise-in-next-generation-sequencing/ [Google Scholar]
- Nik-Zainal S, et al. The life history of 21 breast cancers. Cell. 2012;149:994–1007. doi: 10.1016/j.cell.2012.04.023. [DOI] [PMC free article] [PubMed] [Google Scholar]
- Shah SP, et al. The clonal and mutational evolution spectrum of primary triple-negative breast cancers. Nature. 2012;486:395–399. doi: 10.1038/nature10933. [DOI] [PMC free article] [PubMed] [Google Scholar]
- Shiroguchi K, et al. Digital RNA sequencing minimizes sequence-dependent bias and amplification noise with optimized single-molecule barcodes. Proc. Natl Acad. Sci. USA. 2012;109:134713–1352. doi: 10.1073/pnas.1118018109. [DOI] [PMC free article] [PubMed] [Google Scholar]
- Wagle N, et al. High-throughput detection of actionable genomic alterations in clinical tumor samples by targeted, massively parallel sequencing. Cancer Discov. 2012;2:82–93. doi: 10.1158/2159-8290.CD-11-0184. [DOI] [PMC free article] [PubMed] [Google Scholar]
Associated Data
This section collects any data citations, data availability statements, or supplementary materials included in this article.