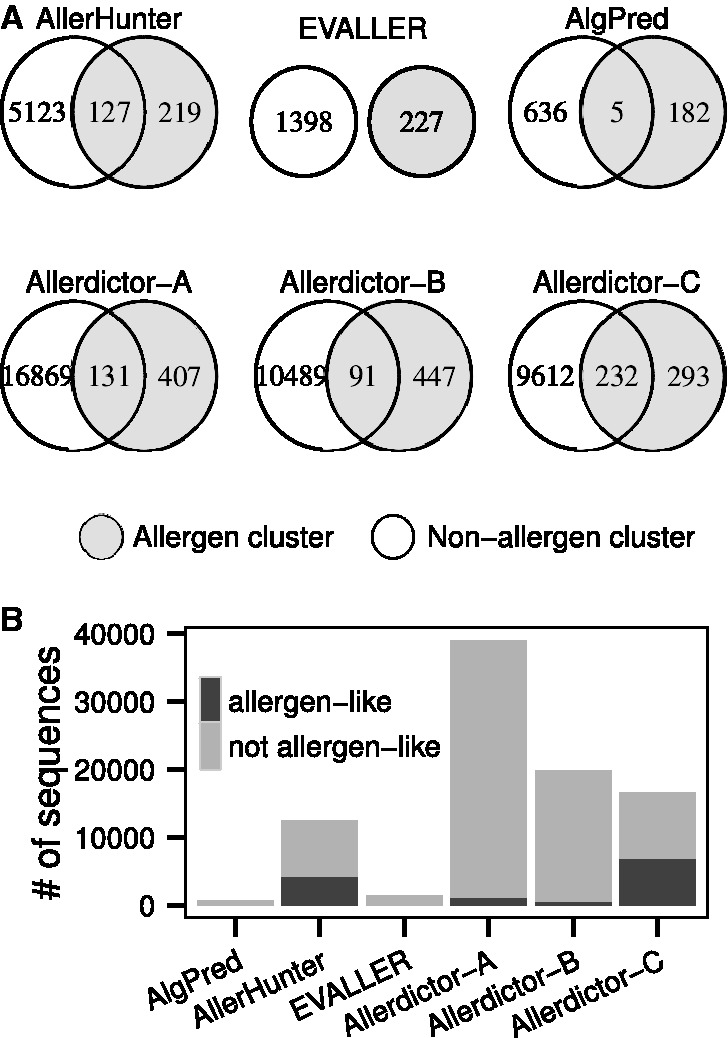
Fig. 1.

Sequence similarity between allergens and non-allergens in Allerdictor datasets and other datasets (BLASTClust cutoff ≥50% sequence identity for ≥50% query or subject coverage). The shared regions in Venn diagrams (A) are clusters that contain both allergen and non-allergen sequences. The total number of non-allergens that are allergen-like and not allergen-like are detailed in the column plot (B)
