

Abstract
Copper (Cu) is an essential trace element that requires tight homeostatic regulation to ensure appropriate supply while not causing cytotoxicity due to its strong redox potential. Our previous in vivo study has shown that iron deficiency (FeD) increases Cu levels in brain tissues, particularly in the choroid plexus, where the blood–cerebrospinal fluid (CSF) barrier resides. This study was designed to elucidate the mechanism by which FeD results in excess Cu accumulation at the blood–CSF barrier. The effect of FeD on cellular Cu retention and transporters Cu transporter-1 (Ctr1), divalent metal transporter 1 (DMT1), antioxidant protein-1 (ATOX1) and ATP7A was examined in choroidal epithelial Z310 cells. The results revealed that deferoximine treatment (FeD) resulted in 70% increase in cellular Cu retention (P < 0.05). A significant increase in the mRNA levels of DMT1, but not Ctr1, was also observed after FeD treatment, suggesting a critical role of DMT1 in cellular Cu regulation during FeD. Knocking down Ctr1 or DMT1 resulted in significantly lower Cu uptake by Z310 cells, whereas the knocking down of ATOX1 or ATP7A led to substantial increases of cellular retention of Cu. Taken together, these results suggest that Ctr1, DMT1, ATOX1 and ATP7A contribute to Cu transport at the blood–CSF barrier, and that the accumulation of intracellular Cu found in the Z310 cells during FeD appears to be mediated, at least in part, via the upregulation of DMT1 after FeD treatment.
Keywords: copper, iron, choroid plexus, blood-cerebrospinal fluid barrier, copper-transporter 1, Ctr1, divalent metal transporter 1, DMT1, antioxidant protein 1, ATOX1, ATP7A
Introduction
Iron deficiency (FeD) affects more than 400 million individuals and is most prevalent in infants and young children.1 The importance of iron (Fe) in normal body functions such as in oxygen transport, synthesis of DNA and proteins, and as co-factor for numerous enzymes, is well documented.2 –4 FeD during development can result in lifelong cognitive and motor impairment.2 In addition, it has been demonstrated that FeD alters the gene expression in the brain, which is implicated in the pathogenesis of Alzheimer’s disease, including amyloid precursor protein.3 Aside from genetic and nutritional factors, exposure to toxic substances such as lead has been associated with FeD.5
Recent studies have shown that Fe levels may modulate copper (Cu) transport in the central nervous system (CNS).6,7 Brains of young rats rendered FeD show elevated Cu levels.6 Previous studies from this group have also demonstrated that FeD results in elevated Cu levels in the brain parenchyma and cerebrospinal fluid (CSF), as well as an increased rate of transport across the brain barriers.7 This metabolic relationship between Fe and Cu homeostasis has also been demonstrated in many tissues.4,8,9 Excess Cu in cells can readily interact with oxygen to produce highly detrimental reactive oxygen species; the latter may contribute to various neurodegenerative disorders including Alzheimer’s, Parkinson’s, amyotrophic lateral sclerosis, prion disease and Wilson’s disease.10,11 Evidence from human studies have found that the Cu concentration in the CSF is significantly higher in patients with Parkinson’s disease than the control population, and that elevated Cu levels correlate with the disease severity and progression.12,13 It is because of the essentiality to cellular function and its cytotoxic nature that Cu is strictly regulated in the body.
Regulation of cellular Cu homeostasis requires various Cu transporters, as well as a subset of proteins known as Cu chaperones. Cellular Cu uptake is mediated by Cu transporter-1 (Ctr1) and/or divalent metal transporter 1 (DMT1). Inside the cells, Cu can be transported by chaperones COX17 to the mitochondria, copper chaperone for superoxide dismutase to Cu/Zn superoxide dismutase, and by antioxidant protein-1 (ATOX1) to the Golgi complex. The release of Cu from the cells is regulated by Cu efflux proteins ATP7A or ATP7B.14,15 Previous work from this laboratory has demonstrated that these transporters are present at both the blood–brain barrier (BBB) and blood–CSF barrier (BCB).15 Numerous studies have also looked at Cu regulation and distribution and the impact of Fe status in various tissues including enterocytes, hepatocytes and the brain.16 However, the exact mechanisms by which the brain barriers regulate Cu levels are poorly understood.
The chemical homeostasis of the CNS is maintained through the coordinated action of two major brain barrier systems, i.e. the BBB and the BCB. The BBB separates the blood circulation from the brain interstitial fluid, and the BCB separates the blood from the CSF. Both barriers selectively transport essential nutrients, metals and drug molecules into the CNS.17 The BCB is primarily located in the choroid plexus in the brain ventricles. The tissue possesses a polarized structure with the basolateral surface facing the blood and the apical microvilli of the epithelia in direct contact with the CSF. Data from our own in vivo experiments7,15 suggest that Cu appears to be taken up by the BBB, transported to the brain parenchyma and interstitium, followed by the diffusion into the CSF, and finally removed from the CSF to the blood through the BCB.
Our recent experimental evidence has shown that in vivo FeD in rats increases Cu levels in the choroid plexus, CSF and brain parenchyma.7 As DMT1, Ctr1, ATP7A and ATOX1 are abundantly expressed in the choroid plexus, we hypothesized that Fe deficiency may alter, either by directly or indirectly, the expression of metal transporters responsible for Cu transport, which contributed to overall increased Cu levels in the CNS. Thus, the purposes of this study was to investigate the mechanism whereby FeD altered Cu homeostasis in the BCB by using an immortalized choroidal Z310 cell line derived from rat choroidal epithelial cells. More specifically, we determined the relative contribution of the cellular Cu transporters to FeD-induced Cu overload in the BCB.
Materials and methods
Materials
Chemicals and reagents were obtained from the following sources: copper chloride, sodium pyruvate, calcium chloride, deferoxamine, hemin, β-actin, 2-mercaptoethanol, polyacrylamide, tetramethyl-ethylenediamine, 4-(2-hydro-xyethyl)-1-piperazineethanesulfonic acid (HEPES) and rabbit anti-mouse ATOX1 from Sigma Chemical Company (St Louis, MO, USA); Hank’s balanced salt solution (HBSS), fetal bovine serum (FBS), Dulbecco’s modified Eagle’s medium (DMEM), penicillin, streptomycin and gentamycin from Gibco (Grand Island, NY, USA); epidermal growth factor from Roche Applied Science (Indianapolis, IN, USA); and the polymerase chain reaction (PCR) buffer, dNTP, Oligo dT and MuLV reverse transcriptase from Applied Biosystems (Foster City, CA, USA). The siRNA for DMT1, Ctr1, ATOX1 and ATP7A were obtained from Ambion (Austin, TX, USA); rabbit anti-rat-DMT1 antibody from Alpha Diagnostic International (San Antonio, CA, USA); rabbit anti-human Ctr1 antibody from Santa Cruz Biotechnology (Santa Cruz, CA, USA); and Alexa-labeled secondary antibodies from Molecular Probes (Eugene, OR, USA). The rabbit anti-rat ATP7A was a gift from Dr Jonathan Gitlin (Vanderbilt University, Nashville, TN, USA). The enhanced chemiluminescene reagent (ECL) and ECL film were purchased from Amersham Biosciences (Piscataway, NJ, USA). All reagents were analytical grade, HPLC grade or the best available pharmaceutical grade.
64CuCl2 (specific activity 1–3 mCi/μg) was obtained from Washington University in St Louis (St Louis, MO, USA) and generated by cyclotron irradiation of an enriched 64Ni target.
Culture of choroidal epithelial Z310 cells
Culture procedure and characteristics of immortalized rat choroidal epithelial Z310 cells have been described in our previous publication.18 In brief, the cells were maintained in DMEM medium supplemented with 10% FBS, 100 U/mL of penicillin, 100 μg/mL of streptomycin and 40 μg/mL of gentamycin in a humidified incubator with 95% air to 5% CO2 at 37°C and passaged twice a week.
Fe deficiency and 64Cu cellular retention in Z310 cells
To create Fe deficiency conditions, cells were exposed to 50 μmol/L deferoximine for 10 h, respectively.19 The Z310 cells were then washed twice with phosphate-buffered saline and incubated in HBSS containing 5 μmol/L 64CuCl2 at 37°C for 60 min. After harvesting and washing, cell-retained 64Cu activity was determined with a gamma counter and the protein concentration was determined by the Bradford assay.
Quantitative PCR analyses of Cu transporters
The transcription of the genes encoding the Cu transporters were quantified using quantitative (q)-PCR; the general procedure has been described by Walker.20 In brief, the total RNA was isolated from Z310 cells using TRIzol reagent following the manufacturer’s instructions. An aliquot of RNA (1 μg) was reverse-transcribed with MuLV reverse transcriptase and oligo dT primers. The forward and reverse primers were designed using Primer Express 3.0 software. The Absolute QPCR SYBR green Mix kit (ABgene, Rochester, NY, USA) was used for q-PCR analyses. The amplification was carried out in the MX 3000P realtime PCR system (Stratagene, La Jolla, CA, USA). Amplification conditions were 15 min at 95°C, followed by 40 cycles of 30 s at 95°C, one minute at 55°C and 30 s at 72°C. A dissociation curve was used to verify that the majority of fluorescence detected could be attributed to the labeling of specific PCR products, and to verify the absence of primer dimmers and sample contamination.
The primer sequences of the Cu transporters were obtained from the National Center for Biotechnology Information. For DMT1, the sequences are forward primer 5′ CAGTGCTCTGT ACGTAACCTGTAAGC 3′, reverse primer 5′ CGCAGAAGA ACGAGGACCAA 3′ (Genbank Accession No. NM 013173); for rat Ctr1, forward primer 5′ ATGGAGATGCATCATAT GGG 3′, reverse primer 5′ TAATGGCAGTGCTCTGTGAT GT 3′ (Genbank Accession No. NM 133600); for ATOX1, forward primer 5′ AGTTCTCTGTGGACATGACCTG 3′, reverse primer 5′ AAGGTAGGAGACCGC TTTTCCT 3′ (Genbank Accession No. NM 053359); for ATP7A, forward primer 5′ CAGTGCTCTGTACGTAACCTG 3′, reverse primer 5′ CGCAGAAGAACGAGGACCAA 3′ (Genbank Accession No. NM 052803); and for rat glyceraldehyde-3-phosphate dehydrogenase (GAPDH), used as an internal control, forward primer 5′ CCTGGAGAAACCTGCCAA GTAT 3′ and reverse primer 5′ AGCCCAGGATGCCCTTT AGT 3′ (Genbank Accession No. NM_017008).
Knocking down of Cu transporters by RNAi in Z310 cells
The siRNA transfection was performed as follows. A prede-signed silencer select sequences for knocking down DMT1 (ID: s130558), Ctr1, ATOX1 (ID: s136464) and ATP7A (ID: s128718) knockdown were obtained commercially from Ambion. Transfection agent lipofectamine was found to work best in the Z310 cells after a series of screenings. Transfection conditions were optimized according to the following variables: initial seeding density, volume of transfection agent, duration of transfection and concentration of siRNA.
The RNA/transfection system was prepared as follows: 1 μL of lipofectamine was diluted in 100 μL of OPTI-MEM 1 medium and incubated for 10 min at room temperature. siRNA was added to a separate 100 μL OPTI-MEM medium to obtain a final concentration of 50 nmol/L per dish. The transfection agent and the siRNA were then mixed and incubated at room temperature for 45 min with occasional mixing. Cells were seeded at a density of 1 × 10⁵ cells/well in a six-well plate in the cell culture medium. The culture medium was replaced with 200 μL of the above mixture along with 800 μL of OPTI-MEM medium to obtain a total of 1 mL medium per well and the culture continued for five hours. An additional 1 mL of regular cell culture medium was added and the cells were grown for an additional 48 h. The cells were transfected with either scrambled siRNA as a negative control or the siRNA sequence-designed homologous to the gene of interest. A negative control was used to demonstrate that there was no non-specific toxicity caused by the transfection agent. The knockdown of the transporters was confirmed by q-PCR and Western blot analysis. The 64CuCl2 uptake studies were then performed as described earlier, and intracellular 64CuCl2 concentration was normalized to the total cellular protein content.
Western blot analyses
Z310 cells were collected and homogenized; the protein fractions were extracted by the method established in this laboratory.21,22 Samples were sonicated using Model 500 Sonic Dismembrator (Fisher Scientific, Pittsburgh, PA, USA) at duty cycle 20% and output of 4–6 for 30 pulses. After centrifugation at 10,000× g at 4°C for 10 min, aliquots of supernatants were assayed for protein concentrations by the Bradford method. A volume of the extract (50 μg of protein) was mixed with an equal volume of 2× sample buffer and run on a 10% sodium dodecyl sulfate–polyacrylamide gel. After the blots were transferred to a polyvinylidene fluoride membrane, the membrane was blocked with 5% dry milk in Tris-buffered saline at 37°C for one hour and immunoblotted with an antibody directly against DMT1 (1:500), Ctr1 (1:100), ATOX1 (1:100) or ATP7A (1:100) overnight. The membrane was stained with a horseradish peroxidase (HRP)-conjugated goat anti-rabbit IgG antibody (1:4000) at room temperature for one hour and developed using ECL reagent and films. The exposure time varied from 30 s to several minutes depending on the signal strength. β-Actin (42 kDa) (1:2000) was used as a loading control; the corresponding secondary antibody (1:5000) for β-actin was HRP-conjugated goat anti-mouse IgG. Band intensities were quantified using Scion Image software (Frederick, MD, USA).
Statistics
All data are expressed as mean±standard deviation unless stated otherwise. Statistical analyses of the differences between groups were carried out by one-way analysis of variance with a post hoc test using Fisher’s least significant difference. The Pearson correlation and linear regression analysis were determined using SPSS 18.0 statistic package (SPSS Inc, Chicago, IL, USA) for Windows. The differences between the means were considered significant if P values were equal or less than 0.05.
Results
Cellular Cu accumulation as a result of FeD
To further verify the Cu accumulation in the choroid plexus as a consequence of in vivo FeD diet,7 we created the FeD condition in a choroidal Z310 cell model. After the Z310 cells were incubated with an Fe chelator deferoximine for 10 h, the cellular 64Cu levels were significantly increased by 70% as compared with controls (P < 0.05, Figure 1). Thus, the data support our previous in vivo observation that the FeD condition increases Cu concentration in the BCB.
Figure 1.

Increased 64Cu accumulation in Z310 cells following iron deficiency (FeD). Cells were treated with 50 μmol/L of deferoximine for 10 h, followed by incubation with 5 μmol/L of 64CuCl2 for one hour. Data represent mean ± SD, n = 6, *P < 0.05
Expression of mRNAs encoding Cu transporters as a result of FeD
By normalizing the amount of mRNA using GAPDH, a housekeeping gene, we found that FeD resulted in a significant elevation of DMT1 mRNA by 100% (P < 0.01), and of the mRNA-encoding ATOX1 and ATP7A in the Z310 cells, which were elevated by 50% (P < 0.05) and 55% (P < 0.05), respectively (Table 1). However, FeD treatment did not affect the mRNA expression of Ctr1, a major cell surface Cu transporter known to be responsible for cellular Cu uptake. The data appeared to suggest that DMT1 may be more sensitive to FeD condition than the other Cu transporters, and thus may play a more significant role than Ctr1 in cellular accumulation of Cu in the BCB under FeD stress.
Table 1.
Expression of mRNAs encoding Cu transporters in choroidal Z310 cells as affected by FeD
| Gene | Control | FeD |
|---|---|---|
| Ctr1 | 1.00 ±0.12 | 1.25 ±0.16 |
| DMT1 | 1.00 ±0.05 | 2.03 ±0.09** |
| ATOX1 | 1.00 ±0.06 | 1.58 ±0.11* |
| ATP7A | 1.00 ±0.15 | 1.62 ±0.12* |
FeD, iron deficiency; Ctr1, Cu transporter-1; DMT, divalent metal transporter 1; ATOX1, antioxidant protein-1 The relative mRNA levels of genes of interest and GAPDH were quantified by realtime reverse transcriptase polymerase chain reaction and expressed as the ratio of gene of interest/glyceraldehyde-3-phosphate dehydrogenase. Data represent mean ±SEM, n = 4–5;
P < 0.05;
P < 0.01 compared with control
Cellular Cu accumulation as a result of knocking down Cu transporters
Cellular uptake of Cu is known to be mediated by Ctr1 and DMT1, and the intracellular trafficking and expulsion of Cu are regulated by ATOX1 and ATP7A. To understand the roles of these Cu transporters in the BCB, we used RNAi technique to selectively knock down the transporter and to assess Cu accumulation in choroidal Z310 cells. The system was first optimized using q-PCR, and Western blot to determine an optimal concentration of transporter siRNA at which a significant knockdown of the targeted protein would ensue. The cells treated with Ctr1 siRNA showed a significant reduction of Ctr1 mRNA (50%) and protein (60%) levels as compared with the scrambled siRNA controls (Figures 2a and b). The Ctr1 knockdown resulted in a 30% decrease in 64Cu uptake by the Z310 cells (P < 0.05, Figure 2c). Similarly, introducing DMT1 siRNA to the Z310 cells resulted in a significant reduction of both DMT1 mRNA (40%) and protein (50%) levels as compared with controls (Figures 3a and b). As a result, DMT1 knockdown led to a significant reduction (25%) in cellular Cu uptake by Z310 cells (P < 0.05, Figure 3c).
Figure 2.

Cu transporter-1 (Ctr1) knockdown and cellular Cu update. Z310 cells were cultured with 50 nmol/L of siRNA for 24 h. (a) Ctr1protein expression after siRNA treatment. (b) Ctr1 mRNA expression after siRNA treatment. (c) Cellular 64Cu uptake after Ctr1 knockdown. After recovery from the transfection of Ctr1 siRNA, cells were incubated with 5 μmol/L of 64CuCl2 for one hour. Data represent mean ±SD, n = 4–6; *P < 0.05 as compared with controls. GAPDH, glyceraldehyde-3-phosphate dehydrogenase; NC, negative control
Figure 3.

Divalent metal transporter 1 (DMT1) knockdown and cellular Cu uptake. Z310 cells were cultured with 50 nmol/L of siRNA for 24 h. (a) DMT1 protein expression after siRNA treatment. (b) DMT1 mRNA expression after siRNA treatment. (c) Cellular 64Cu uptake after DMT1 knockdown. After recovery from the transfection of DMT1 siRNA, cells were incubated with 5 μmol/L of 64CuCl2 for one hour. Data represent mean ± standard deviation, n = 4–6; *P < 0.05 as compared with controls. GAPDH, glyceraldehyde-3-phosphate dehydrogenase; NC, negative control
For efflux proteins, introducing ATOX1 siRNA to the cells caused a significant reduction of ATOX mRNA (75%) and protein (80%) levels as compared with the scrambled siRNA controls (P < 0.05, Figures 4a and b). In contrast to knockdown of Ctr1 and DMT1, ATOX1 knockdown increased cellular accumulation of Cu in Z310 cells by 75% (P < 0.05, Figure 4c). Finally, introducing ATP7A siRNA to the cells caused a significant reduction of both ATP7A mRNA (50%) and protein (40%) levels as compared with the scrambled siRNA controls (Figures 5a and b). Similar to ATOX1 knockdown, ATP7A knockdown resulted in a significant retention of Cu in the Z310 cells by 45% (Figure 5c).
Figure 4.

Antioxidant protein 1 (ATOX1) knockdown and cellular Cu uptake. Z310 cells were cultured with 50 nmol/L siRNA for 24 h. (a) ATOX1 protein expression after siRNA treatment. (b) ATOX1 mRNA expression after siRNA treatment. (c) Cellular 64Cu uptake after ATOX1 knockdown. After recovery from the transfection of ATOX1 siRNA, cells were incubated with 5 μmol/L of 64CuCl2 for one hour. Data represent mean ± standard deviation, n = 4–6; *P < 0.05 as compared with controls. GAPDH, glyceraldehyde-3-phosphate dehydrogenase; NC, negative control
Figure 5.

ATP7A knockdown and cellular Cu uptake. Z310 cells were cultured with 50 nmol/L of siRNA for 24 h. (a) ATP7A protein expression after siRNA treatment. (b) ATP7A1 mRNA expression after siRNA treatment. (c) Cellular 64Cu uptake after ATP7A knockdown. After recovery from the transfection of ATP7A siRNA, cells were incubated with 5 μmol/L of 64CuCl2 for one hour. Data represent mean ±standard deviation, n = 4–6; *P < 0.05 as compared with controls. GAPDH, glyceraldehyde-3-phosphate dehydrogenase; NC, negative control
Principal role of DMT1 in Cu accumulation during FeD
As FeD resulted in the greatest increase of mRNA expression of DMT1 (>2-fold) and no changes in Ctr1 mRNA (Table 1), we sought to test the hypothesis that DMT1 knockdown by siRNA would overcome the FeD-induced cellular Cu overload. After the optimization of DMT1 siRNA, the Z310 cells were divided into three treatment groups: control cells with no treatment, scrambled siRNA control without Fe treatment; or DMT1 knockdown with deferoxamine for 10 h to induce FeD. 64Cu retention data showed that no significant difference in Cu accumulation was observed between any of the three groups (Figure 6). These results suggest that knocking down DMT1 effectively abolished the cellular Cu uptake, and thus support the view that the increase in DMT1 expression found during FeD appears to play a major role in Cu accumulation at the BCB.
Figure 6.
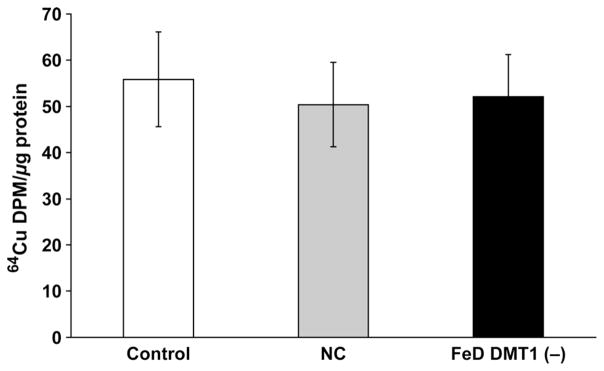
Divalent metal transporter 1 (DMT1) knockdown prevents iron deficiency (FeD)-induced 64Cu accumulation in Z310 cells. After recovery from the transfection of DMT1 or scrambled siRNA, cells were treated with 50 μmol/L of deferoximine for 10 h, followed by incubation with 5 μmol/L of 64CuCl2 for one hour. Data represent mean ± SD, n = 6
Discussion
The results presented in this study indicated that (1) FeD resulted in an increased cellular retention of Cu in immortalized choroidal epithelial Z310 cells; (2) that cellular Cu uptake by the choroidal epithelial cells was mediated by Ctr1 and DMT1, and the cellular Cu release by these cells was mediated by ATOX1 and ATP7A; and (3) that DMT1 upregulation during FeD seemed likely to be responsible for the increased cellular Cu retention found at the BCB. Interestingly, we found that FeD-induced cellular Cu overload was mediated by DMT1 rather than Cu transporter Ctr1.
Previous work from this laboratory has demonstrated that FeD enhances both Cu transport and retention at the brain barriers, brain parenchyma and CSF, suggesting that the transport and deposition of Cu in the CNS is greatly affected by systemic Fe status.7 Previous studies have also demonstrated that treatment with deferoximine results in increased cellular retention of Cu in Caco-2 cells, which models the intestinal mucosa.23 Our current data based on the in vitro BCB Z310 model showed a similar phenomenon, with FeD treatment resulting in a 40% increase in cellular Cu retention.
Several critical Cu transporters, including Ctr1, DMT1, ATOX1 and ATP7A, have been shown to be expressed in the brain capillaries and choroid plexus tissue.15 These transporters likely mediate Cu transport by the BCB as demonstrated by our siRNA results; diminishing the expression of cellular surface transporters Ctr1 and DMT1 decreased Cu uptake, whereas a reduction in Cu exporters ATP7A and ATOX1 increased the cellular retention of Cu.
How, then, did FeD increase Cu levels in choroidal Z310 cells? Using realtime reverse transcriptase PCR, we found that the expression of DMT1, ATOX1 and ATP7A was upregulated in the FeD condition. Noticeably, Ctr1 expression was not changed. In other words, whereas Ctr1 is critical to cellular Cu uptake, it is insensitive to changes in extra-cellular Fe levels. Previous studies by Collins et al.,16 Collins24 and Han and Wessling-Resnick25 have shown that DMT1-mediated Cu transport may play a significant role in Cu accumulation during FeD in the intestine, and possibly in the brain. In addition, the study conducted by Erikson et al.26 has demonstrated that DMT1 levels are increased almost two-fold in the basal ganglia due to FeD when compared with control levels. It has previously been demonstrated that the mRNA-encoding DMT1 contains a unique stem–loop structure called iron response element (IRE), which is subject to the binding of iron regulatory protein 1 (IRP1). Under Fe sufficient conditions, the IRP1 possesses a [4Fe–4S] cluster in its active center and functions as aconitase to convert isocitrate in the tricarboxylic acid cycle.27,28 When cells are iron deficient or in need of Fe for cellular processes, the [4Fe–4S] configuration in IRP1 becomes a [3Fe–4S] configuration, and this causes the protein to bind to the IRE-containing mRNA, encoding transferrin receptor and DMT1.19,22,27,29– 31 Conceivably, an increase in DMT1 expression may result in an elevated uptake of Cu by the choroidal epithelial cells, leading to increased cellular accumulation of Cu.
To further confirm this point, we conducted DMT1 knockdown experiments using a siRNA technique. The results revealed that knocking down DMT1 in conjunction with FeD prevented the increased cellular Cu retention seen during FeD alone. Hence, it became evident that FeD-induced cellular Cu overload was mediated by DMT1 induction in response to FeD. It should be pointed out that Cu chaperone ATOX1 and efflux transporter were also upregulated; the upregulation of these two transporters may be the result of cellular Cu overload and therefore counteract DMT1 induction. Clearly, our data suggest that during FeD, it is DMT1 but not Ctr1, that is primarily responsible for increased cellular Cu levels in the choroidal epithelial cells at the BCB. Toxicologically, increased Cu uptake by the BCB during FeD makes sense, because there is a need for the BCB to remove the excessive Cu in the CSF and brain parenchyma. The data previously published by this laboratory have shown that DMT1 is enriched on the apical surface of the choroid plexus cells,22 and in vivo FeD results in an increase in CSF and brain Cu concentrations.7 Thus, it is logical to postulate that the BCB may play a protective role in removing excessive Cu in the CNS under FeD conduction.
In summary, our results suggest that DMT1, but much less likely Ctr1, plays a significant role in the increased Cu accumulation in the BCB during FeD. These results provide mechanistic evidence for the relationship between Fe and Cu transport in the CNS. In addition, it appears that both ATOX1 and ATP7A, which constitute the cellular Cu efflux pathway, are upregulated during FeD; this could be the consequences of cellular Cu overload, although the exact regulatory mechanism is still unclear. These results offer new insight into the mechanism of normal brain Cu regulations.
Acknowledgments
This study was supported in part by a Ross Fellowship from the Purdue Research Foundation (ADM) and by NIH/ National Institute of Environmental Health Sciences grants RO1-ES008146 (WZ) and R21-ES017055 (WZ).
Footnotes
Author contributions: All authors participated in the design, interpretation of the studies and analysis of the data and review of the manuscript. ADM and GZ conducted the experiments, and ADM and WZ wrote the manuscript.
References
- 1.World Health Organization. [last checked 21 September 2011];Micronutrient Deficiencies. 2008 See http://www.who.int/nutrition/topics/ida/en/index.html.
- 2.Beard JL, Connor JR. Iron status and neural functioning. Ann Rev Nut. 2003;23:41–58. doi: 10.1146/annurev.nutr.23.020102.075739. [DOI] [PubMed] [Google Scholar]
- 3.Carlson ES, Magid R, Petryk A, Georgieff MK. Iron deficiency alters expression of genes implicated in Alzheimer disease pathogenesis. Brain Res. 2008;1237:75–83. doi: 10.1016/j.brainres.2008.07.109. [DOI] [PMC free article] [PubMed] [Google Scholar]
- 4.Fairweather-Tait SJ. Iron nutrition in the UK: getting the balance right. Proc Nutr Soc. 2004;63:519–28. doi: 10.1079/pns2004394. [DOI] [PubMed] [Google Scholar]
- 5.Kwong WT, Friello P, Semba RD. Interactions between iron deficiency and lead poisoning: epidemiology and pathogenesis. Sci Total Environ. 2004;330:21–37. doi: 10.1016/j.scitotenv.2004.03.017. [DOI] [PubMed] [Google Scholar]
- 6.Garcia SJ, Gellein K, Syversen T, Aschner M. Iron deficient and manganese supplemented diets alter metals and transporter in the developing rat brain. Toxicol Sci. 2007;95:205–14. doi: 10.1093/toxsci/kfl139. [DOI] [PubMed] [Google Scholar]
- 7.Monnot AD, Behl M, Ho S, Zheng W. Regulation of brain copper homeostasis by the brain barrier system: effects of Fe-overload and Fe-deficiency. Toxicol Appl Pharmacol. 2011;256:249–57. doi: 10.1016/j.taap.2011.02.003. [DOI] [PMC free article] [PubMed] [Google Scholar]
- 8.Gambling L, McArdle HJ. Iron, copper, and fetal development. Proc Nutr Soc. 2004;63:553–62. doi: 10.1079/pns2004385. [DOI] [PubMed] [Google Scholar]
- 9.Sharp P. The molecular basis of copper and iron interactions. Proc Nutr Soc. 2004;63:563–9. doi: 10.1079/pns2004386. [DOI] [PubMed] [Google Scholar]
- 10.Desai V, Kaler SG. Role of copper in human neurological disorders. Am J Clin Nutr. 2008;88:855S–88S. doi: 10.1093/ajcn/88.3.855S. [DOI] [PubMed] [Google Scholar]
- 11.Gaggelli E, Kozlowski H, Valensin D, Valensin G. Copper homeostasis and neurodegenerative disorders (Alzheimer’s, prion, and Parkinson’s diseases and amyotrophic lateral sclerosis) Chem Rev. 2006;106:1995–2044. doi: 10.1021/cr040410w. [DOI] [PubMed] [Google Scholar]
- 12.Jimenez-Jimenez FJ, Molina JA, Aguilar MV, Meseguer I, Mateos-Vega CJ, Gonzalez-Munoz MJ, de Bustos F, Martinez-Salio A, Orti-Pareja M, Zurdo M, Martinez-Para MC. Cerebrospinal fluid levels of transition metals in patients with Parkinson’s disease. J Neural Trans. 1998;105:497–505. doi: 10.1007/s007020050073. [DOI] [PubMed] [Google Scholar]
- 13.Blake DR, Lunec J, Gutteridge JM, Hall M, Taylor A. Raised cerebrospinal-fluid copper concentration in Parkinson’s disease. Lancet. 1987;2:238–41. doi: 10.1016/s0140-6736(87)90827-0. [DOI] [PubMed] [Google Scholar]
- 14.Kim BB, Nevitt T, Thiele DJ. Mechanisms for copper aquistion, distribution and regulation. Nat Chem Biol. 2008;4:176–85. doi: 10.1038/nchembio.72. [DOI] [PubMed] [Google Scholar]
- 15.Choi BS, Zheng W. Copper transport to the brain by the blood-brain barrier and blood-CSF barrier. Brain Res. 2009;1258:14–21. doi: 10.1016/j.brainres.2008.10.056. [DOI] [PMC free article] [PubMed] [Google Scholar]
- 16.Collins JF, Prohaska JR, Knutson MD. Metabolic crossroads of iron and copper. Nutr Rev. 2010;68:133–47. doi: 10.1111/j.1753-4887.2010.00271.x. [DOI] [PMC free article] [PubMed] [Google Scholar]
- 17.Zheng W, Chodobski A. The Blood-Cerebrospinal Fluid Barrier. New York: CRC Press; 2005. [Google Scholar]
- 18.Zheng W, Zhao Q. Establishment and characterization of an immortalized Z310 choroidal epithelial cell line from murine choroid plexus. Brain Res. 2002;958:371–80. doi: 10.1016/s0006-8993(02)03683-1. [DOI] [PMC free article] [PubMed] [Google Scholar]
- 19.Wang X, Li GJ, Zheng W. Up regulation of DMT1 expression in choroidal epithelia of the blood-CSF barrier following manganese exposure in vivo. Brain Res. 2006;1097:1–10. doi: 10.1016/j.brainres.2006.04.046. [DOI] [PMC free article] [PubMed] [Google Scholar]
- 20.Walker NJ. Real-time and quantitative PCR: applications to mechanism-based toxicology. J Biochem Mol Toxicol. 2001;15:21–7. doi: 10.1002/jbt.8. [DOI] [PubMed] [Google Scholar]
- 21.Behl M, Zhang Y, Monnot AD, Jiang W, Zheng W. Increased β-amyloid levels in the choroid plexus following lead exposure and the involvement of low density lipoprotein receptor protein-1. Toxicol Appl Pharmacol. 2009;240:245–54. doi: 10.1016/j.taap.2009.05.024. [DOI] [PMC free article] [PubMed] [Google Scholar]
- 22.Wang X, Li GJ, Zheng W. Efflux of iron from the cerebrospinal fluid to the blood at the blood–CSF barrier: effect of manganese exposure. Exp Biol Med. 2008;233:1561–71. doi: 10.3181/0803-RM-104. [DOI] [PMC free article] [PubMed] [Google Scholar]
- 23.Linder MC, Zerounian NR, Moriya M, Malpe R. Iron and copper homeostasis and intestinal absorption using the Caco2 cell model. BioMetals. 2003;16:145–60. doi: 10.1023/a:1020729831696. [DOI] [PubMed] [Google Scholar]
- 24.Collins J. Gene chip analyses reveal differential genetic responses to iron deficiency in rat duodenum and jejunum. Biol Res. 2006;39:25–37. [PMC free article] [PubMed] [Google Scholar]
- 25.Han O, Wessling-Resnick M. Copper repletion enhances apical iron uptake and transepithelial iron transport by Caco-2 cells. Am J Physiol Gastrointest Liver Physiol. 2002;283:G527–G533. doi: 10.1152/ajpgi.00414.2001. [DOI] [PubMed] [Google Scholar]
- 26.Erikson KM, Syversen T, Steinnes E, Aschner M. Globus pallidus: a target brain region for divalent metal accumulation associated with dietary iron deficiency. J Nutr Biol. 2004;15:335–41. doi: 10.1016/j.jnutbio.2003.12.006. [DOI] [PubMed] [Google Scholar]
- 27.Zheng W, Ren S, Graziano JH. Manganese inhibits mitochondrial aconitase: a mechanism of manganese neurotoxicity. Brain Res. 1998;799:334–42. doi: 10.1016/s0006-8993(98)00481-8. [DOI] [PMC free article] [PubMed] [Google Scholar]
- 28.Zheng W, Aschner M, Ghersi-Egea JF. Brain barrier systems: a new frontier in metal neurotoxicological research. Toxicol Appl Pharmacol. 2003;192:1–11. doi: 10.1016/s0041-008x(03)00251-5. [DOI] [PMC free article] [PubMed] [Google Scholar]
- 29.Siddappa AJ, Rao RB, Wobken JD, Leibold EA, Connor JR, Georgieff MK. Developmental changes in the expression of iron regulatory proteins and iron transport proteins in the perinatal rat brain. J Neurosci Res. 2002;68:761–75. doi: 10.1002/jnr.10246. [DOI] [PubMed] [Google Scholar]
- 30.Rouault TA, Klausner RD. Iron-sulfur clusters as biosensors of oxidants and iron. Trends Biochem Sci. 1996;21:174–81. [PubMed] [Google Scholar]
- 31.Li GJ, Zhao Q, Zheng W. Alteration at translational but not transcriptional level of transferrin receptor expression following manganese exposure at the blood-CSF barrier in vitro. Toxicol Appl Pharmacol. 2005;205:188–200. doi: 10.1016/j.taap.2004.10.003. [DOI] [PMC free article] [PubMed] [Google Scholar]