

Abstract
Pentavalent vanadium compounds induce intracellular changes in vitro that are consistent with those of other carcinogenic substances. While there is no clear evidence that vanadium compounds cause cancer in humans, vanadium pentoxide causes lung cancer in rodents after long-term inhalation exposures and in turn IARC has categorized it as a group 2B possible human carcinogen. The goal of this study was to investigate the carcinogenicity of NaVO3 in the human immortalized bronchial epithelial cell line, Beas-2B. Cells were treated with 10 μM NaVO3 for 5 weeks, with or without recovery time, followed by gene expression microarray analysis. In a separate experiment, cells were exposed to 1–10 μM NaVO3 for 4 weeks and then grown in soft agar to test for anchorage-independent growth. A dose-dependent increase in the number of colonies was observed. In scratch tests, NaVO3-transformed clones could repair a wound faster than controls. In a gene expression microarray analysis of soft agar clones there were 2010 differentially expressed genes (DEG) (adjusted p-value ≤ 0.05) in NaVO3-transformed clones relative to control clones. DEG from this experiment were compared with the DEG of 5 week NaVO3 exposure with or without recovery, all with adjusted p-values < 0.05, and 469 genes were altered in the same direction for transformed clones, 5 week NaVO3-treated cells, and the recovered cells. The data from this study imply that chronic exposure to NaVO3 causes changes that are consistent with cellular transformation including anchorage-independent growth, enhanced migration ability, and gene expression changes that were likely epigenetically inherited.
Introduction
Exposure to the metal vanadium (V) occurs via inhalation and oral routes, and in the general population, food constitutes the major source of vanadium exposure. Vanadium compounds, such as vanadyl sulfate, are intentionally ingested as dietary supplements by athletes and diabetics.1 Vanadium is released into the atmosphere during the combustion of fossil fuels. Ambient vanadium concentrations elevate as a result of excess automobile exhaust, and are especially high during winter months in cities that burn coal and fuel oil.2 Large European cities experience ambient air concentrations of vanadium as high as 2 μg m−3 in the winter,3 while the mean concentrations in New York City are consistently lower ranging from 7.1–14.0 ng m−3 in the winter, and 4.8–8.9 ng m−3 during the summer.4 Exposure to vanadium also occurs in occupational settings such as sulfuric acid production, steel manufacturing, mining, and maintenance of oil-burning furnaces5 where levels range from 0.01–60 mg m−3.3
Though not yet established as a human carcinogen, acceptable levels of vanadium exposure have been established in certain contexts. The Occupational Health and Safety Administration has established 0.5 mg m−3 to be the permissible exposure limit for respirable V2O5 dust, and 0.1 mg m−3 for V2O5 fumes.6 Vanadium is included in the United States Environmental Protection Agency’s drinking water contaminant candidate list.7 An official drinking water standard or a recommended water quality criterion for vanadium currently does not exist in the United States. Based on human and animal data, the Agency for Toxic Substances and Disease Registry in the United States has determined 0.01 mg kg−1 per day to be the subchronic oral dose of vanadium at which there is minimal risk to human health.6
The physiologically relevant forms of vanadium include meta-and ortho-vanadates, vanadium pentoxide (V2O5), and vanadyl sulfate.1,2 All of these pentavalent forms of vanadium (V+5) are strong oxidants, with the exception of vanadyl sulfate because it is tetravalent. Insoluble vanadium enters cells via phago-/pinocytosis while soluble vanadium ions enter via phosphate anion transporters.8 Once vanadium is in the cell or body, it can be converted between V+4 and V+5, depending on factors such as pH and the presence of reducing agents such as glutathione.5 V+4 and V+5 species can be transported throughout the body by transferrin and albumin in the blood, and can then accumulate in tissues including muscles, bones, brain, kidneys, liver, and the heart.1
Research on V+5 compounds has demonstrated that they can induce changes in vitro and in vivo that are characteristic of carcinogenic substances including alteration of transcription factor levels, promotion of oxidative stress, inflammation, DNA damage, inhibition of DNA repair, stimulation of mitogenic signals, and suppression of apoptosis.5,9 V+5 inhibits tyrosine phosphatase and produces oxidative stress in cells.9a The shuttling of vanadium between V+5 and V+4 states generates reactive oxygen species8 and induces oxidative stress that can damage important macromolecules. At the same time, vanadate has been reported to have multiple health benefits that include lowering cholesterol, blood pressure, serum glucose levels, and cancer prevention.1
V+5 induces genotoxic effects including DNA strand breaks, aneuploidy, chromosomal aberrations, and micronuclei. V+5 causes aneuploidy by interfering with spindle formation/microtubule assembly, and by inhibiting phosphatases that are critical to spindle checkpoint regulation during meiosis.9a DNA structural studies have shown that V+5 ions directly bind to the phosphate backbone of DNA near guanine residues, and such binding can destabilize the helix.10 Analysis of lymphocytes from workers exposed to vanadium indicated that V+5 impacts genetic stability through increased amounts of DNA base oxidation, micronuclei formation, and DNA damage.11 The 2.5-fold increase of micronuclei observed in these workers relative to controls suggests that there may be an increased risk of developing cancer.11 V+5 has been observed to interfere with DNA repair as well.5,9a,12 An in vitro study where fibroblasts were exposed to 1 μM vanadate and UV irradiation showed that the cells were less able to repair DNA damage induced by the radiation.9a V+5 inhibits enzymes with ATPase activity by binding to the Walker A motif, including DNA repair proteins such as mismatch repair protein MutS.12
Other effects of V+5 that could enhance the potential risk for development of cancer include its ability to interfere with the cell cycle, increase glycogenesis, inflammation, and morphological changes in cells.9,13 V+5 can stabilize the phosphorylation of cell signaling proteins, and thereby affect cell proliferation, cell cycle progression, and inhibit apoptosis by enhancing mitogenic signaling through the MAP kinase cascade and the phosphoinositide 3-kinase (PI3K) pathway.5,9a,14 To support greater cell proliferation rates, in the face of non-functional mitochondria, cancer cells have more glycolytic activity than normal cells and store more glycogen for nutrient support.15 A study on rat adipocytes showed that V+5 could activate glycogen synthase and glycogenesis.13b In a study where mice were injected with a carcinogen and then chronically instilled with V2O5, the metal stimulated inflammation by direct irritation of the exposed tissues.9b The V2O5-induced inflammation was associated with (and promoted) the development of lung tumors.9b Overnight treatment of MC3T3E1 osteoblast-like cells with V+5 resulted in the morphological change from a long fibroblast-like appearance into a more spindle-like shape. This morphological change coupled with an observed increase in the growth rate suggests that V+5 may have potential for transforming normal cells into cancer cells.13a
Despite all of the suggestive outcomes noted above, there is still no conclusive evidence that V+5 compounds cause cancer in humans. Although V2O5 was categorized by the International Agency for Research on Cancer (IARC) as a group 2B possible human carcinogen, and the study of Ehrlich et al. suggested a cancer risk after genotoxic markers were seen in lymphocytes of vanadium factory workers,11 there is a lack of epidemiological evidence of an association between vanadium exposure and cancer in humans. In 2002, the National Toxicology Program published the findings of their study on “Carcinogenicity of Inhaled Vanadium Pentoxide in F344/N Rats and B6C3F1 mice”. Though the design of that study received much criticism,16 it was evident that long-term vanadate exposure via inhalation caused lung tumors in mice, along with evidence of chromosomal aberrations and DNA damage.5
While it is clear that V+5 causes cancer in animal models, it remains unknown if this is the case in humans. Thus, the objective of this study was to investigate the potential for sodium metavanadate (NaVO3) to transform the human immortalized normal bronchial epithelial cell line, Beas-2B. The results described in this paper expand upon those reported previously in a comparison of gene expression changes in human lung cells exposed to a variety of metals, including vanadium.17 Our results indicate that NaVO3 can induce anchorage independent growth in Beas-2B cells, and this observation adds to the mounting experimental data regarding its potential carcinogenicity in humans.
Experimental
Cell culture
Immortalized human bronchial epithelial cells (Beas-2B; #CRL-9609, ATCC, Manassas, VA) were cultured in 1× Dulbecco’s Modified Eagle Medium (DMEM; Invitrogen, Grand Island, NY) supplemented with 10% fetal bovine serum (FBS; Atlanta Biologicals, Lawrenceville, GA) and 100 ug mL−1 Pen Strep (GIBCO, Grand Island, NY) (“complete culture media”). The cells were maintained in 25 cm2 polystyrene tissue culture flasks in an incubator at 37°C with 5% CO2 and 100% humidity. The media were changed every 2 days, and the cells were passaged every 4 days using 0.05% trypsin-EDTA (GIBCO).
Colony formation assay for cell viability
Beas-2B cells were seeded into 6-well polystyrene tissue culture plates at 1 × 10⁵ per well. After 24 hours, the cells were treated with 5, 10, 25, 50, or 100 μM of sodium metavanadate (NaVO3; Sigma, St. Louis, MO) that was dissolved in water and then added directly into the media. Control cells received distilled water without the metal. After 24 hours of exposure, the cells were trypsinized and counted using a hemocytometer to determine viability after the acute NaVO3 exposure. Thereafter, 500 live cells from each treatment were seeded into triplicate 10 cm polystyrene cell culture dishes. The cells were allowed to grow at 37 °C for 16 days into discrete colonies and were then stained with Giemsa and counted.
Chronic NaVO3 exposure
Beas-2B cells were seeded at 3 × 10⁵ into 25 cm2 polystyrene tissue culture flasks. The cells were treated with 1, 2.5, 5, 10, or 30 μM NaVO3 that was dissolved in distilled water and then added directly into the media. Control cells received distilled water without the metal. The cells were cultured for 4 weeks. Every 3–4 days, the cells were trypsinized, counted, and re-seeded into fresh 25 cm2 flasks at a density of 3 × 10⁵ live cells per flask, and given fresh media with the appropriate concentration of NaVO3. This exposure regiment was repeated in a separate experiment using only 10 μM NaVO3 or distilled water. A subset of these cells was cultured in media with 10 μM NaVO3 for 5 weeks (Fig. 1, experiment A), and the second set was cultured in the presence of NaVO3 for 4 weeks and then recovered in the absence of NaVO3 for 1 week (Fig. 1, experiment B).
Fig. 1.
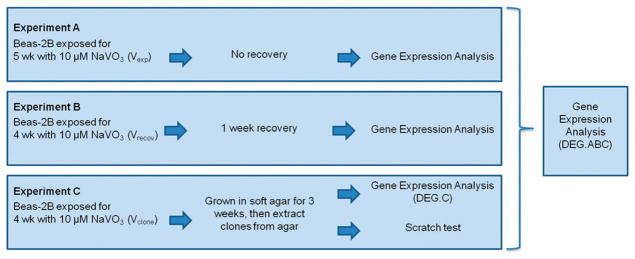
Flowchart of chronic NaVO3 exposure experiments. The DEG list generated from gene expression analysis of all three experiments is referred to as DEG.ABC. The DEG list from only experiment C is referred to as DEG.C. NaVO3 exposed cells from experiment A are identified as Vexp. NaVO3 exposed cells from experiment B that recovered for one week are identified as Vrecov. NaVO3 exposed cells from experiment C that grew into colonies in soft agar are identified as Vclones.
Soft agar assay
Warm (37 °C, 2 mL per well) base agar solution (0.5% [w/v] agar [#214530, BD Biosciences, San Diego, CA] in 1× DMEM complete culture media) was poured into each well of 6-well untreated polystyrene plates. The base layer was allowed to solidify at 4 °C for 2 hours. Then 2 mL of a warm (37 °C) top agar solution consisting of 5000 cells in 0.35% agar + 1× DMEM complete tissue culture media was added over the base layer. Duplicate wells were used for each treatment and control cells. The 6-well plates were then incubated at 37 °C in the tissue culture incubator for 3 weeks; 0.5 mL of fresh media was added once per week without disturbing the cells. After 3 weeks, the colonies were either stained overnight with INT–BCIP solution (#11-681-460-001, Roche, New York, NY) in 0.1 M Tris/0.05 M MgCl2/0.1 M NaCl to visualize (and subsequently permit a count of) all colonies, or colonies were instead extracted from the agar. Each extracted colony was trypsinized in a 96-well plate in order to break up the colony, and then transferred into a 24-well plate to begin expansion of the individual transformed and control clones (Fig. 1, experiment C).
Scratch test
Cells (2 × 10⁵) from each clone extracted from soft agar and parental cells were plated into 35 mm culture dishes with a grid etched into the bottom. The cells were cultured in 1× DMEM complete media until 100% confluent (4 days). The media were then replaced with 1× PBS, and a single scratch was made across the monolayer using a 1 mL pipette tip held perpendicular to the plate bottom. The plate was then washed with 1× PBS twice to remove any floating cells released during the scratching process. 1× DMEM was placed back into the plates to nourish the cells and photographs were taken at 0, 6, 24, and 30 hours after the scratch using an Olympus DP71 camera on an Olympus CKX41 microscope. The exact same field of view was captured at each time point with location guidance from the grid on the culture plate.
RNA isolation and quantification
RNA was isolated from the cells using the standard protocol enclosed with the TRIzol Reagent (Invitrogen, Carlsbad, CA). The isolated RNA was then quantified using the Nano Drop ND-1000 fluorospectrometer (Thermo).
RT-PCR
The SuperScript III First-Strand Synthesis System for RT-PCR (Invitrogen) was used to generate cDNA from the isolated RNA. PCR tubes containing solutions of 1 μg sample RNA in DEPC-treated water with random hexamers/primers and dNTP mix were incubated at 65 °C for 5 minutes in a PTC-100 Programmable Thermal Controller (MJ Research, Inc. Watertown, MA.). The tubes were then placed on ice for 1 minute before adding the cDNA Synthesis Mix. The tubes were centrifuged softly to gently mix the solutions and collect the liquid at the bottom. After returning the tubes to the PTC-100, the following incubation program was initiated: 25 °C for 10 minutes, 50 °C for 50 minutes, and 85 °C for 5 minutes. The tubes were placed on ice for 1 min; 0.5 μL RNaseH was then added and the tubes were centrifuged softly to mix. The tubes were returned to the PTC-100 for 20 minutes at 37 °C in order to remove remaining RNA. The resulting cDNA was stored at −20 °C.
Gene expression
Gene expression differences between transformed and control clones were determined by loading the clones’ cDNA onto an Affymetrix GeneChip Human Exon 1.0 ST array (#901147, Santa Clara, CA). A total of five transformed clones, three control clones, one sample of 24 hour NaVO3-exposed Beas-2B cells, and one sample of parental cells were each analyzed on separate GeneChip arrays. The cDNA from cells treated with NaVO3 for 5 weeks, cells that recovered for 1 week after 4 weeks of NaVO3 treatment, and unexposed control cells were also hybridized onto the same kind of Affymetrix GeneChip array, but in a separate batch.
Quantitative RT-PCR
Quantitative RT-PCR was carried out with the following primers in order to validate the gene expression data: DSC-2 (5′-AACAGCCCATTCATACCTAAAAAGA-3′ and 5′-AAAGGGTGGGC-CATGGATAG-3′); DSC-3 (5′-AACATCAGAAGAAGGTATCG-3′ and 5′-GCATAGAGCAAGGAATAGG-3′); RPS4Y1 (5′-ACTGGCAAGA-TAATCAACTT-3′ and 5′-CATTGGCATCCTTCACAT-3′); BRCA1 (5′-TTGCGGGAGGAAAATGGGTAGTTA-3′ and 5′-TGTGCCAAGGGT-GAATGATGAAA-3′); and GAPDH (5′-cactcagacccccaccacac-3′ and 5′-gatacatgacaaggtgcggct-3′). Each reaction contained 3 μL of 1 : 10 diluted cDNA, 5 μL of Power SYBR Green PCR Master Mix (Applied Biosystems, Warrington UK), and 2 μL of 1 μM forward and reverse primers. The reactions took place in a 384-well plate in triplicate wells. The following program was run on a 7900HT Fast Real-Time PCR System (Applied Biosystems): 50 °C for 2 minutes, 95 °C for 10 minutes, then 40 repetitions of 95 °C for 15 seconds and 60 °C for 1 minute, and finally 95 °C for 15 seconds. Delta CT (ΔCT) was calculated by subtracting the mean CT value of GAPDH from the mean CT value of the gene of interest. A 2−ΔCT formula was used to calculate the relative amount of mRNA.
Protein isolation
Beas-2B cells were scraped in cold PBS with protease inhibitors (Roche Diagnostics, Indianapolis, IN). The cells were transferred into microcentrifuge tubes, and centrifuged at 7500 rpm for 1 minute. The cell pellet was resuspended in 100 μL RIPA buffer, and then incubated on ice for 30 minutes before centrifugation for 1 minute at 7500 rpm. The total protein contained in the supernatant was quantified with the DC Protein Assay (Bio-Rad Laboratories, Hercules, CA).
Western blot
Mini-PROTEAN TGX Any kD precast gels (Bio-Rad) were loaded with 50 μg of protein in Laemmli sample buffer (Bio-Rad) containing 5% (v/v) 2-mercaptoethanol (Sigma). The Precision Plus Protein Kaleidoscope standard (Bio-Rad) was used to determine protein size. Electrophoresis took place in 1× Tris/glycine/SDS buffer (Bio-Rad) at 100 volts at room temperature. The protein was transferred from the gels onto Immobilon-FL Transfer membranes (Millipore, Billerica, MA) in 1× Tris/glycine buffer (Bio-Rad) at 25 volts overnight at 4 °C. The membranes were blocked for 30 minutes with 5% (w/v) Blotting-Grade Blocker (Bio-Rad) in TBS-T at room temperature. The membranes were incubated with primary antibodies (monoclonal rabbit anti-alpha tubulin [ab52866, Abcam, Cambridge, MA], monoclonal mouse-anti BRCA1 [ab16781, Abcam], or monoclonal rabbit anti-desmocollin 3 [ab126768, Abcam]) for 1 hour at room temperature. Incubation with secondary antibodies (goat anti-mouse IgG-HRP [sc-2005, Santa Cruz Biotechnology, Dallas, TX] or goat anti-rabbit IgG-HRP [sc-2004, Santa Cruz Biotechnology]) was conducted for 1 hour at room temperature. The protein was detected using the Pierce ECL Western Blotting Substrate (Thermo).
Statistics
The significance of the dose-response in the colony formation assay and soft agar assay was calculated using a two-tailed Student’s t-test in Microsoft Excel (p-value ≤ 0.05).
Gene expression changes for control clones versus transformed clones were analyzed using GeneSpring GX software (Agilent Technologies, Santa Clara, CA). Significant genes were determined by a moderated T-test with p-values ≤ 0.05. The p-values were subjected to False Discovery Rate (FDR) correction for multiple hypothesis testing. These differentially expressed genes (DEG.C) can be found in Table S2 (ESI†), and a subset of these DEG is found in Table 1.
Table 1.
Genes related to transformation and carcinogenesis that were altered in NaVO3-transformed clones relative to control clones
| Gene | Full gene name | Fold change |
|---|---|---|
| bcar1 | Breast cancer anti-estrogen resistance 1 | 1.355 |
| brca1 | Breast cancer 1, early onset | −2.082 |
| ccna1 | Cyclin A1 | −2.235 |
| cdh6 | Cadherin 6, type 2, K-cadherin (fetal kidney) | −2.886 |
| cdk7 | Cyclin-dependent kinase 7 | 1.604 |
| cyp1b1 | Cytochrome P450, family 1, subfamily B, polypeptide 1 | 9.194 |
| dner | Delta/notch-like EGF repeat containing | 7.067 |
| dsc2 | Desmocollin 2 | −5.410 |
| dsc3 | Desmocollin 3 | −20.811 |
| e2f5 | E2F transcription factor 5, p130-binding | −2.266 |
| eya4 | Eyes absent homolog 4 (Drosophila) | 18.298 |
| fanca | Fanconi anemia, complementation group A | −1.603 |
| fn1 | Fibronectin 1 | 2.083 |
| gpx7 | Glutathione peroxidase 7 | −3.605 |
| gsta2 | Glutathione S-transferase α 2 | 1.557 |
| hlf | Hepatic leukemia factor | 5.837 |
| itgb3 | Integrin, β 3 (platelet glycoprotein IIIa, antigen CD61) | 1.996 |
| jag1 | Jagged 1 (Alagille syndrome) | 2.197 |
| jarid2 | Jumonji, AT rich interactive domain 2 | 1.619 |
| jun | Jun oncogene | 1.290 |
| kat2a | K (lysine) acetyltransferase 2A | −2.090 |
| kdm5d | Lysine (K)-specific demethylase 5D | 3.108 |
| kiss1 | KiSS-1 metastasis-suppressor | −1.135 |
| lamb1 | Laminin, β 1 | 2.111 |
| nrp1 | Neuropilin 1 | 3.990 |
| pde1c | Phosphodiesterase 1C, calmodulin-dependent 70 kDa | 4.495 |
| plcb4 | Phospholipase C, β 4 | −3.121 |
| prickle1 | Prickle homolog 1 (Drosophila) | 4.390 |
| prkca | Protein kinase C, α | 1.766 |
| rarb | Retinoic acid receptor, β | 7.168 |
| rbp7 | Retinol binding protein 7, cellular | −6.388 |
| rras | Related RAS viral (r-ras) oncogene homolog | 1.379 |
| rxrb | Retinoid X receptor, β | 1.195 |
| satb2 | SATB homeobox 2 | 2.548 |
| serpinb10 | Serpin peptidase inhibitor, clade B (ovalbumin), member 10 | 6.863 |
| set | SET nuclear oncogene | −1.225 |
| skap2 | src kinase associated phosphoprotein 2 | −5.133 |
| snai2 | Snail homolog 2 (Drosophila) | 3.733 |
| srpx2 | Sushi-repeat-containing protein, X-linked 2 | 4.590 |
| stat3 | Signal transducer and activator of transcription 3 | −1.652 |
| stc2 | Stanniocalcin 2 | 2.168 |
| tgfa | Transforming growth factor, α | 3.607 |
| tgfbr2 | Transforming growth factor, β receptor II (70/80 kDa) | 2.331 |
| tsc1 | Tuberous sclerosis 1 | −1.583 |
| txn | Thioredoxin | −1.374 |
| uty | Ubiquitously transcribed tetratricopeptide repeat gene, Y-linked | 10.134 |
| wnt3 | Wingless-type MMTV integration site family, member 3 | −1.369 |
| wnt5a | Wingless-type MMTV integration site family, member 5A | 4.967 |
| wt1 | Wilms tumor 1 | −2.578 |
| xrcc4 | X-ray repair complementing defective repair in Chinese hamster cells 4 | 1.737 |
A subset of 50 genes from DEG.C that was differentially expressed (p-value ≤0.01) in NaVO3-transformed clones relative to control clones from soft agar. These genes may play a role in the early stages of transformation and cancer development, and some of the listed genes are cancer biomarkers. The fold changes reported in this table were generated with GeneSpring GX software.
Fig. 5 was generated via additional analysis of gene expression data that was performed using the program R in order to normalize samples in a way that made lists comparable across experiments. Gene expression data were imported and normalized using a single-sample method, Single Channel Array Normalization, (SCAN)18 in R 2.15.0 GUI 1.53 64-bit. Data were further processed to expression sets using the Affymetrix package version 1.30.0. in R 2.13.2 GUI 1.42 Leopard build 64-bit. Expression values were then filtered to remove negative expression values and hierarchical clustering was used to evaluate the impact of batch effects (Fig. 6). Significance of gene expression changes between vanadium treated cells for all three experiments and their respective controls were assessed separately using a gene-wise linear model approach with LIMMA 3.8.3 using array weights. LIMMA utilizes an empirical Bayes approach to generate moderated t-statistics by taking into account the standard errors and estimated log-fold changes19 and the array weights component adjusts the analysis to take into account varying array qualities.20 The p-values were subjected to FDR correction for multiple hypothesis testing and adjusted p-values with p < 0.05 were considered significant.21 In order to generate the list found in Fig. 6, DEG from all three datasets (DEG.ABC), the cells that were treated for 5 weeks without a recovery period (experiment A), those that were treated for 4 weeks with a one week recovery period (experiment B), and the treated cells that were subjected to selection via soft agar (experiment C), were queried for genes which appeared on all three lists and which demonstrated expression levels occurring in the same direction (positive or negative). The query was performed using a custom script in R.
Fig. 5.
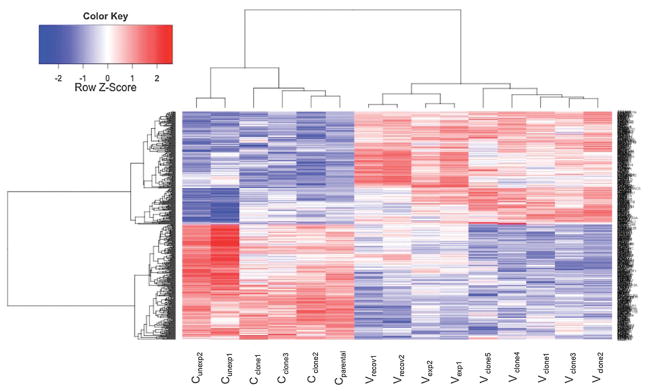
Heatmap. Heatmap depicting 469 differentially expressed genes (adjusted p-value ≤ 0.05) found in all three experiments (DEG.ABC). 232 genes were significantly up regulated (red) and 237 genes were significantly down regulated (blue) relative to appropriate controls. From left to right: control cells that remained unexposed (Cunexp), control clones that spontaneously grew in soft agar (Cclone), parental cells (Cparental), cells that recovered for 1 week from chronic NaVO3 exposure (Vrecov), cells exposed to NaVO3 for 5 weeks (Vexp), and transformed clones from soft agar (Vclone).
Fig. 6.
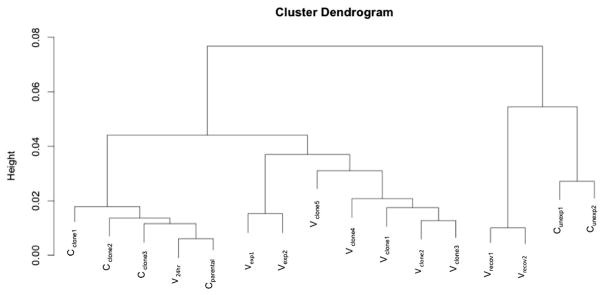
Cluster dendrogram. Cluster dendrogram based on hierarchical clustering of gene expression patterns. Control clones that spontaneously grew in soft agar (Cclone), acute NaVO3-treated cells (V24h) and parental Beas-2B cells (Cparental) form the first cluster. The second cluster consists of cells treated with NaVO3 for 5 weeks (Vexp) and transformed clones from soft agar (Vclone). The third cluster is composed of cells that recovered for 1 week from chronic exposure to NaVO3 (Vrecov), and control cells that remained untreated (Cunexp).
All raw data have been deposited in the National Center for Biotechnology Information Gene Expression Omnibus under accession number GSE43607.
Results
A cytotoxicity assay using colony formation was used to determine an appropriate dose of NaVO3 to treat the Beas-2B cells. This assay was performed with three biological replicates, and the total number of colonies in each replicate was within two standard deviations of each other. The dose–response curve (Fig. 2) shows that acute exposure to low doses up to 10 μM of NaVO3 promoted cell survival, and the survival of the cells decreased in a dose-dependent manner when treated with ≥25 μM NaVO3. From these data, the LC50 was calculated to be ~28 μM. Based on these results, dosages of 1, 2.5, 5, 10, 20, and 30 μM NaVO3 were selected to determine cytotoxicity during chronic treatment. After one week, the cells treated with 20 or 30 μM NaVO3 did not survive to allow colony formation. All of the other treatments survived, and therefore those cells were chronically exposed to NaVO3 for 4 weeks. These treated cells were then tested for anchorage independent growth in the soft agar assay (Fig. 1, experiment C). The soft agar assay was performed with two biological replicates, and the total number of colonies in each replicate was within two standard deviations of each other. A dose-dependent increase in the number of colonies growing in soft agar was observed, with the greatest number of colonies arising from the cells chronically treated with 10 μM NaVO3 (Fig. 3). There were some control cells that spontaneously formed colonies in agar; however there were significantly fewer of these clones compared to clones that grew from treated cells.
Fig. 2.

Colony formation assay. The dose–response curve for Beas-2B survival when exposed to various concentrations of NaVO3 for 24 hours. These cells were cultured for 16 days and then the colonies were counted. The 50% cell survival was approximately equal to 28 μM.
Fig. 3.

Average number of colonies growing in soft agar from control and chronic NaVO3-treated Beas-2B. A dose-dependent increase of colony growth in soft agar was observed when comparing transformed colonies to the spontaneous growth of control colonies (colonies that formed from untreated cells). The statistical significance was calculated with an unpaired Student’s t-test (*p < 0.05, **p < 0.01).
The 10 μM NaVO3 dose was selected to transform the cells as this dose generated the greatest number of NaVO3 transformed clones (Vclones: cells derived from NaVO3-treated Beas-2B that grew in soft agar) without being cytotoxic (Fig. 3). The cells were treated with 10 μM NaVO3 for 4 weeks, and then were grown in soft agar in the absence of the metal for 3 weeks. Several of the resulting clones were extracted from the agar along with spontaneously-growing control clones (Cclones) from the untreated cells. The clones were expanded under normal culture conditions; surviving clones were used in a scratch test and gene expression analysis.
The scratch test was used to test migration ability. The scratch test results showed that all of the Vclones, except for Vclone3, were able to heal the wound by 30 hours after the scratch was made (Fig. 4). Parental Beas-2B cells and Cclones were unable to heal the wound within 30 hours.
Fig. 4.

Scratch test. Migration of cells in response to the creation of a gap in the monolayer. NaVO3-tranformed clones healed the wound faster than the control clones and the parental Beas-2B. All images were captured at 100× magnification, and the same field of view was captured at each time point with guidance from the grid on the cell culture plates.
Further investigation into differences between the Cclones and Vclones revealed great variations in gene expression profiles. Significant gene expression alterations (p ≤ 0.05) were detected using GeneSpring GX software with a moderated T-test, which identified 2010 DEG in the Vclones relative to Cclones (Table S1, ESI† DEG.C). Expression changes were observed in genes related to: epithelial-mesenchymal transition (EMT), the Ras signaling pathway, the PI3K signaling pathway, retinoic acid signaling, DNA repair, epigenetic regulation, angiogenesis, endogenous antioxidants, the NOTCH1 pathway, the Wnt signaling pathway, and cell proliferation. Table 1 contains an abbreviated list of some genes from DEG.C that are related to the processes listed above. Altered gene expressions of several tumor biomarkers were found, including brca1, skap2, wt1, tsc1, jun, and hlf.
In the assessment of gene expression changes that were common to all three experiments (DEG.ABC) that were performed using R, 469 DEG were found (Fig. 5) that were significantly (p < 0.05) altered in the same directions in 5 week NaVO3-treated cells (Vexp), the recovered cells (Vrecov), and Vclones. Hierarchical cluster analysis showed that the gene expression patterns of Vclones were more similar to each other than to the Cclones (Fig. 6). Additionally, Vexp cells and Vclones clustered together and separately from controls, demonstrating that their gene expression profiles are more similar to each other than to the controls. Parental Beas-2B cells (Cparental), cells exposed to 10 μM NaVO3 for 24 hours (V24h), and Cclone share similar gene expression profiles. The unexposed control cells (Cunexp) and Vrecov cells clustered together (Fig. 6). Many of the gene expression changes present in Vexp cells were retained in Vrecov cells and Vclones (Table S2, ESI†), suggesting that these changes could be heritable over many cell divisions by an epigenetic mechanism.
QRT-PCR was performed to confirm the gene expression changes from each experiment. In DEG.C, rps4y1 was the third most up-regulated gene (29-fold), and increased mRNA from this gene was detected in all Vclones (Fig. S1, ESI†). Dsc2 and dsc3 cell adhesion proteins mRNA were confirmed to be down-regulated in Vexp, Vrecov, and Vclones (Fig. 7A–D). Down-regulation of tumor suppressor brca1 in Vclones and Vrecov cells was confirmed by QRT-PCR (Fig. 7E and F). BRCA1 and DSC3 proteins were found to be underexpressed in Vclones when compared to Cclones (Fig. 8). This confirmed that the decreased expression of these genes resulted in a reduction of the proteins.
Fig. 7.

Relative mRNA levels of DSC2, DSC3, and BRCA1 measured by QRT-PCR. Control clones (Cclone); vanadate transformed clones (Vclone); control unexposed cells (Cunexp); cells exposed to vanadate (Vexp); cells recovered from vanadate treatment (Vrecov).
Fig. 8.

Western blots for DSC3 and BRCA1. α-tubulin was identified at approximately 50 kDa. (A) DSC3 was identified at approximately 100 kDa, There was a clear reduction of DSC3 in the Vclones compared to the Cclones. (B) BRCA1 was identified at approximately 207 kDa (upper band). BRCA1 was underexpressed in Vclones compared to Cclones.
Vclones were judged as transformed because they had altered gene expression patterns, and there were significantly more of these colonies arising in the agar from treated cells compared to the numbers of Cclones that grew spontaneously in agar from untreated cells (Fig. 3). Hierarchical cluster analysis of gene expression profiles classified Vclones separate from Cclones (Fig. 6). Genes known to induce anchorage-independent cell proliferation that were found to be up regulated in Vexp, Vrecov, and Vclones were tgfa23 and rala.24
Discussion
The objective of this study was to investigate the potential for NaVO3 to transform normal immortalized Beas-2B cells. It was previously reported that a variety of metals could induce cell transformation, including chromium, nickel, arsenic, and vanadium.17,22 This study expands upon that information by showing that chronic exposure to NaVO3 at a non-cytotoxic dose induced anchorage independent growth of Beas-2B cells that also exhibited enhanced migration capacity as shown by the scratch test. Acute exposure of the cells to 10 μM NaVO3 stimulated cell growth, possibly by affecting growth-promoting signaling pathways. Gene expression changes indicated that some cellular pathways responsible for the regulation of cell proliferation, differentiation, and survival were altered by the chronic NaVO3 exposure. After the chronic NaVO3 exposure, these changes remained heritable for 11 weeks while the cells were cultured. Deregulation of mechanisms that govern critical processes such as the cell cycle, DNA repair, cell signaling, and gene transcription were also observed. Abnormalities in these processes are hallmarks of cancer cells.
Cancer cells often have decreased expression of cell adhesion proteins; this leads to a loss of contact inhibition and an increase in cell mobility. In this study, a number of genes related to cell adhesion were significantly affected (p <0.05) by NaVO3 (Table 1 and Table S1, ESI†). Expression of srpx2 was up regulated by 4.6-fold in Vclones. Over-expression of this gene product has been found to promote cell migration in gastric cancer cells through the focal adhesion kinase signaling pathway.25 Cdh6 was found to be down regulated by 2.9-fold in Vclones; this gene is under expressed in patients with multiple myeloma.26 Bcar1, a gene believed to support cell migration,27 was up regulated by 1.4-fold in Vclones. A down-regulation of desmocollins, which are central components of the desmosome cell–cell junction complex in epithelial cells, is associated with a gain in cell mobility and invasiveness.28 In the current study, a suppression of dsc2 and dsc3 was observed in Vclones, and dsc3 was the most down regulated gene (20.8-fold decrease) in all of the Vclones. The down regulation of DSC3 was confirmed at the protein level in Vclones (Fig. 8). Levels of desmocollin mRNA were consistently down regulated in the Vexp, Vrecov, and Vclones (Fig. 7A–D).
Cell and focal adhesion genes whose expression was found to be down regulated in Vexp, Vrecov, and Vclones were dsc2, dsc3, neo1, and parvb (Table S2, ESI†). Fn1, lamb1, lamb3, and lamc2 are other genes that play a role in cell and focal adhesion and cell migration. The expression of these genes was up regulated in all three groups. The expression of genes encoding subunits of fibronectin receptors (itgb3, itgb5, and itga5) and subunits of laminin receptors (itgb3 and itga3) was up regulated as well (Table S2, ESI†). The changes in expression of genes related to cell and focal adhesion complement the scratch test results that showed Vclones had enhanced migratory ability.
Gene changes related to epithelial-to-mesenchymal transition (EMT) support the finding that Vclones have enhanced migratory capability. The gene expression data (DEG.C) suggest that Vclones may have undergone partial EMT, as evidenced by the suppression of the desmocollins, and increased expression of snai2. Decreased expression of dsc2 and dsc3 could be indicative of desmosome dissociation, which occurs during EMT and promotes cell mobility.28,29 The down regulation of E-cadherin promotes tumor metastasis and is a hallmark of EMT.29,30 A significant decrease in E-cadherin gene expression levels was not observed in this study. However, transcriptional repressor of E-cadherin snai2 was over-expressed by 3.7-fold in Vclones (Table 1). Snai2 functions to regulate EMT associated gene expression changes, including the down regulation of dsc2 and E-cadherin, increase cell motility, and it has also been indicated to play a role in wound closure.29,31 During EMT, cells may obtain the ability to remodel the extracellular matrix.31 Increased expression of the matrix metalloproteinases (MMP) mmp13 (1.1-fold), mmp14 (2.2-fold), and mmp16 (3.6-fold) was observed in the Vclones. Several genes reported to be up regulated in a study where E-cadherin was knocked down by RNAi in immortalized non-transformed mammary epithelium cells30 were also upregulated in Vexp, Vrecov, and Vclones. These genes include cyp1b1, fn1, grm1, lox, nrp1, prkca, satb2, stc2, and wnt5a.
Changes in the expression of oncogenes, tumor suppressors, genes related to cell cycle and survival that could contribute to a cancer phenotype were observed in both sets of DEG. In Vexp, Vrecov, and Vclones, the proto-oncogene jun was up regulated, and the tumor suppressor genes ptch1, fanca, fancc, tsc1, and brca1 were down regulated. Metastasis suppressor gene kiss1 was down regulated by 1.14-fold in Vclones. Several members of the Ras oncogene family were affected in Vclones, including rras (1.4-fold), rab3a (1.2-fold), rab3d (−1.3-fold), rab5c (−1.4-fold), rab9b (1.2-fold), rab13 (1.3-fold), rab14 (−1.3-fold), and rab40c (1.2-fold). Cell cycle and proliferation regulating genes rbp7 (−6.4-fold), rarb (7.2-fold), tgfbr2 (2.3-fold), e2f5 (−2.3-fold), ccna1 (−2.2-fold), ccnb1 (1.3-fold), ccnd3 (1.4-fold), ccng2 (1.6-fold), ccnh (1.2-fold), ccnj (−1.3-fold), cdk7 (1.6-fold), cdk10 (−1.3-fold), cdkn1b (1.3-fold), and a variety of rho proteins were deregulated in Vclones. Genes related to apoptosis and cell survival that were affected by the treatment include serpinb10 (6.9-fold), wt1 (−2.6-fold), syde2 (−2.1-fold), and skap2 (−5.1-fold).
Significant changes in the expression of DNA repair genes and oxidative stress response genes were observed (p < 0.05). Inability to defend against or repair DNA damage increases cancer susceptibility. In Vexp, Vrecov, and Vclones, a 9.2-fold increase of cyp1b1 and 4-fold decrease of gpx7 were found. In Vclones, an 18.3-fold increase of eya4, 2.1-fold decrease of brca1, 1.7-fold increase of xrcc4, 1.4-fold decrease of txn, 1.6-fold increase of gsta2 and gsto1, 1.3-fold increase of mgst3, and approximately 4-fold decrease of gstm1 were found. BRCA1 mRNA levels were only observed to decrease after removal of NaVO3 from the growth conditions (during recovery and during growth in soft agar) (Fig. 7E and F). The reduction of BRCA1 protein was confirmed in Vclones (Fig. 8).
V+5 affects many different cell processes and signaling pathways because of its ability to act as a phosphatase inhibitor.9a In this study, it became apparent that V+5 could affect cell signaling via other mechanisms. There is evidence in the gene expression data that NaVO3 affected calcium uptake. Calcium is an important second messenger in the eukaryotic cell. A 2-fold increase in expression of the calcium channel subunit CACNG4 that stabilizes calcium channels in an inactive state was observed in Vclones (Table S1, ESI†). Closed calcium channels could impair Ca2+ flux in the cell that would impact numerous calcium-dependent processes and signaling pathways, such as the nuclear factor of the activated T-cells pathway. Several calcium-dependent genes were significantly altered (p < 0.05) in this study. These included up regulation of cdh10 (3.7-fold), stc1 (4.3-fold), prkca (1.4-fold), kcnma1 (3.8-fold), and the down regulation of dsc3 (20.8-fold), cdh6 (2.9-fold), nfatc4 (1.1-fold), and gca (6.4-fold) in Vexp, Vrecov, and Vclones; down regulation of camk4 (1.4-fold) and cant1 (1.1-fold) in Vclones. The potential lack of intracellular calcium was also supported by the observed 2-fold increased expression of vdr in Vclones, which plays a central role in systemic calcium mobilization and absorption.
NaVO3 could interfere with the cycling of other second messengers, such as cyclic adenosine monophosphate (cAMP), cyclic guanosine monophosphate (cGMP), diacylglycerol (DAG), and inositol 1,4,5-triphosphate (IP3). NaVO3 increased the expression of a phosphodiesterase, pde1c (4.5-fold), which is responsible for the hydrolysis of cAMP and cGMP. PDE1C is also regulated by calmodulin, another messenger protein dependent on calcium ions for activity. The altered expression of several rho GTPase activating proteins in Vclones suggested that NaVO3 treatment could affect G-protein signaling. Suppressors of G-protein signaling rgs3 and rgs7 were significantly down regulated (p < 0.05) in Vexp, Vrecov, and Vclones. In Vclones, G-protein-coupled receptors gpr1, 34, 39, and 56 were up regulated, and gpr21, 107, 124, 156, and 160 were down regulated. Genes involved in the PI3K signaling pathway, that have a role in the hydrolysis of phosphatidylinositol 4,5-bisphosphate into the second messengers DAG and IP3, that were affected include plcb4 (−3.1-fold), plcd3 (−1.4-fold), plce1 (2.1-fold), and plcg2 (−1.6-fold). Of these, plcb4 and plcd3 require calcium as a cofactor for activation.
The gene expression data suggest that exposure to NaVO3 may suppress signaling through the JAK-STAT signaling pathway. Stat1, stat3, and stat5b were down regulated, and cytokine receptor genes ifnar2, il10rb, and il7r that trigger the JAK-STAT pathway were also down regulated in Vexp, Vrecov, and Vclones. In Vclones, NaVO3 exposure increased rarb by 7.2-fold, rxrb by 1.2-fold, and caused a 6.4-fold decrease of rbp7, indicating potential for NaVO3 to affect retinoic acid homeostasis. Retinol is important for mediating cell signaling and gene transcription through retinoic acid response elements. Genes regulated by retinoic acid response elements are often related to embryonic development and are activated in cancer.32
Several genes related to embryonic signaling pathways and cell differentiation were affected in this study. Aberrations in the retinoic acid signaling pathway could impact Wnt signaling via cross-talk.33 The Wnt signaling pathway has a role in embryogenesis and carcinogenesis. The data here revealed an over expression of the Wnt pathway regulators wnt5A (5-fold) and prickle1 (4.4-fold), and under expression of wnt3 (1.4-fold) in Vclones. Dner, a gene that activates the NOTCH1 signaling pathway (involved in cell differentiation) was up regulated 7.1-fold in Vclones. The JAG1 gene encoding a notch 1 receptor ligand was up regulated in Vexp, Vrecov, and Vclones. Other genes noted to be affected in Vclones that are related to development are homeobox genes, including ddx3y, meis1, pbx1, satb2, pax6, mkx.
NaVO3 may also have had epigenetic effects on the Beas-2B cells. Epigenetic reprogramming would have been necessary for fixing the observed gene expression changes into the genome of the Vclones. The gene expression pattern differences between Vclones and Cclones persisted for 11 weeks after the chronic exposure, and were likely due to an epigenetic mechanism. Vrecov was cultured in the absence of the metal for one week, so it is not possible to determine the long-term persistence of the gene expression changes in this cells population. Hundreds of genes were found to be up or down regulated in the same direction in Vexp, Vrecov, and Vclones (Table S2, ESI†). The persistence of these alterations in treated cells after many generations of growth in the absence of NaVO3 suggests that an epigenetic mechanism of inheritance is at work. The present study found 2.1-fold decreased expression of the histone acetyl transferase kat2a, and 1.2-fold decrease in nucleosome and histone acetylation inhibitor set in Vclones. Increased expression of epigenetic-regulating genes uty, kdm5D, kdm4c, jarid2, setdb2, and satb2 were observed in Vclones. uty, kdm4c, and kdm5d code for enzymes that demethylate histones, and were, respectively, up regulated by 10, 1.5, and 3.1-fold. jarid2, an important histone methyltransferase complex regulator, was up regulated by 1.6-fold. Histone 3 methyltransferase setdb2 was up regulated by 1.3-fold. Satb2 was up regulated by 2.6-fold, and it plays a role in chromatin remodeling through recruitment of histone deacetylases and acetyl transferases. Satb2 remained up regulated in Vrecov as well.
Conclusion
In conclusion, this study demonstrated that chronic exposure of human lung Beas-2B cells to NaVO3 resulted in the acquisition of cancer-related properties including anchorage-independent growth and enhanced migratory ability. Gene expression pattern changes indicated that Vclones were more similar to each other than to Cclones or parental cells. Many of these gene expression changes persisted for one week in Vrecov and 11 weeks in Vclones. Gene expression analysis revealed changes in genes that were typically deregulated during carcinogenesis, including cell cycle regulators and genes controlling proliferation and apoptosis, development, DNA repair, oxidative stress, epigenetics, EMT, and gene transcription. The suggested mechanisms through which NaVO3 may have induced these gene expression changes in human cells include sustained signaling through pathways controlled by phosphorylation, disruption of calcium homeostasis and second messenger activity, altered retinoic acid homeostasis, impairment of DNA repair, and epigenetic reprogramming.
Acknowledgments
We would like to thank Thomas Kluz for his assistance in isolating and preparing the RNA samples for hybridization onto the Affymetrix GeneChip. This work was supported by grant numbers ES000260, ES010344, ES014454, ES005512, ES007324-12 from the NIEHS, and CA16087 from NCI.
Footnotes
Electronic supplementary information (ESI) available. See DOI: 10.1039/c3mt00149k
References
- 1.Mukherjee B, Patra B, Mahapatra S, Banerjee P, Tiwari A, Chatterjee M. Vanadium–an element of atypical biological significance. Toxicol Lett. 2004;150:135–143. doi: 10.1016/j.toxlet.2004.01.009. [DOI] [PubMed] [Google Scholar]
- 2.Zhang Z, Chau PY, Lai HK, Wong CM. A review of effects of particulate matter-associated nickel and vanadium species on cardiovascular and respiratory systems. Int J Environ Health Res. 2009;19:175–185. doi: 10.1080/09603120802460392. [DOI] [PubMed] [Google Scholar]
- 3.W. H. Organization. Air Quality Guidelines for Europe. 2. WHO Regional Publications; Copenhagen, Denmark: 2000. p. 170. [PubMed] [Google Scholar]
- 4.Peltier RE, Hsu SI, Lall R, Lippmann M. Residual oil combustion: a major source of airborne nickel in New York City. J Exposure Sci Environ Epidemiol. 2009;19:603–612. doi: 10.1038/jes.2008.60. [DOI] [PubMed] [Google Scholar]
- 5.Assem FL, Levy LS. A review of current toxicological concerns on vanadium pentoxide and other vanadium compounds: gaps in knowledge and directions for future research. J Toxicol Environ Health, Part B. 2009;12:289–306. doi: 10.1080/10937400903094166. [DOI] [PubMed] [Google Scholar]
- 6.Agency for Toxic Substances and Disease Registry. Draft Toxicological Profile for Vanadium. 2009:159–163. [PubMed] [Google Scholar]
- 7.Hooth M. NTP research concept: tetravalent and pentavalent forms of vanadium. presented in part at NTP Board of Scientific Counselors meeting; 2008. [Google Scholar]
- 8.Cohen MD, Sisco M, Prophete C, Chen LC, Zelikoff JT, Ghio AJ, Stonehuerner JD, Smee JJ, Holder AA, Crans DC. Pulmonary immunotoxic potentials of metals are governed by select physicochemical properties: vanadium agents. J Immunotoxicol. 2007;4:49–60. doi: 10.1080/15476910601119350. [DOI] [PubMed] [Google Scholar]
- 9.(a) Beyersmann D, Hartwig A. Carcinogenic metal compounds: recent insight into molecular and cellular mechanisms. Arch Toxicol. 2008;82:493–512. doi: 10.1007/s00204-008-0313-y. [DOI] [PubMed] [Google Scholar]; (b) Rondini EA, Walters DM, Bauer AK. Vanadium pentoxide induces pulmonary inflammation and tumor promotion in a strain-dependent manner. Part Fibre Toxicol. 2010;7:9. doi: 10.1186/1743-8977-7-9. [DOI] [PMC free article] [PubMed] [Google Scholar]
- 10.Ahmed Ouameur A, Arakawa H, Tajmir-Riahi HA. Binding of oxovanadium ions to the major and minor grooves of DNA duplex: stability and structural models. Biochem Cell Biol. 2006;84:677–683. doi: 10.1139/o06-043. [DOI] [PubMed] [Google Scholar]
- 11.Ehrlich VA, Nersesyan AK, Atefie K, Hoelzl C, Ferk F, Bichler J, Valic E, Schaffer A, Schulte-Hermann R, Fenech M, Wagner KH, Knasmuller S. Inhalative exposure to vanadium pentoxide causes DNA damage in workers: results of a multiple end point study. Environ Health Perspect. 2008;116:1689–1693. doi: 10.1289/ehp.11438. [DOI] [PMC free article] [PubMed] [Google Scholar]
- 12.Pezza RJ, Villarreal MA, Montich GG, Argarana CE. Vanadate inhibits the ATPase activity and DNA binding capability of bacterial MutS. A structural model for the vanadate-MutS interaction at the Walker A motif. Nucleic Acids Res. 2002;30:4700–4708. doi: 10.1093/nar/gkf606. [DOI] [PMC free article] [PubMed] [Google Scholar]
- 13.(a) Salice VC, Cortizo AM, Gomez Dumm CL, Etcheverry SB. Tyrosine phosphorylation and morphological transformation induced by four vanadium compounds on MC3T3E1 cells. Mol Cell Biochem. 1999;198:119–128. doi: 10.1023/a:1006997830346. [DOI] [PubMed] [Google Scholar]; (b) Sekar N, Li J, He Z, Gefel D, Shechter Y. Independent signal-transduction pathways for vanadate and for insulin in the activation of glycogen synthase and glycogenesis in rat adipocytes. Endocrinology. 1999;140:1125–1131. doi: 10.1210/endo.140.3.6560. [DOI] [PubMed] [Google Scholar]
- 14.Bhuiyan MS, Fukunaga K. Cardioprotection by vanadium compounds targeting Akt-mediated signaling. J Pharmacol Sci. 2009;110:1–13. doi: 10.1254/jphs.09r01cr. [DOI] [PubMed] [Google Scholar]
- 15.Dang CV. Links between metabolism and cancer. Genes Dev. 2012;26:877–890. doi: 10.1101/gad.189365.112. [DOI] [PMC free article] [PubMed] [Google Scholar]
- 16.Duffus JH. Carcinogenicity classification of vanadium pentoxide and inorganic vanadium compounds, the NTP study of carcinogenicity of inhaled vanadium pentoxide, and vanadium chemistry. Regul Toxicol Pharmacol. 2007;47:110–114. doi: 10.1016/j.yrtph.2006.08.006. [DOI] [PubMed] [Google Scholar]
- 17.Clancy HA, Sun H, Passantino L, Kluz T, Munoz A, Zavadil J, Costa M. Gene expression changes in human lung cells exposed to arsenic, chromium, nickel or vanadium indicate the first steps in cancer. Metallomics. 2012;4:784–793. doi: 10.1039/c2mt20074k. [DOI] [PMC free article] [PubMed] [Google Scholar]
- 18.Piccolo SR, Sun Y, Campbell JD, Lenburg ME, Bild AH, Johnson WE. A single-sample microarray normalization method to facilitate personalized-medicine workflows. Genomics. 2012;100:337–344. doi: 10.1016/j.ygeno.2012.08.003. [DOI] [PMC free article] [PubMed] [Google Scholar]
- 19.Smyth GK. In: Bioinformatics and Computational Biology Solutions using R and Bioconductor. Gentleman VCR, Dudoit S, Irizarry R, Huber W, editors. Springer; New York: 2005. pp. 397–420. [Google Scholar]
- 20.Ritchie ME, Diyagama D, Neilson J, van Laar R, Dobrovic A, Holloway A, Smyth GK. Empirical array quality weights in the analysis of microarray data. BMC Bioinf. 2006;7:261. doi: 10.1186/1471-2105-7-261. [DOI] [PMC free article] [PubMed] [Google Scholar]
- 21.Benjamini Y, Hochberg Y. Controlling the false discovery rate: a practical and powerful approach to multiple testing. J R Stat Soc Ser B. 1995;57:289–300. [Google Scholar]
- 22.Sun H, Clancy HA, Kluz T, Zavadil J, Costa M. Comparison of gene expression profiles in chromate transformed BEAS-2B cells. PLoS One. 2011;6:e17982. doi: 10.1371/journal.pone.0017982. [DOI] [PMC free article] [PubMed] [Google Scholar]
- 23.Nickell KA, Halper J, Moses HL. Transforming growth factors in solid human malignant neoplasms. Cancer Res. 1983;43:1966–1971. [PubMed] [Google Scholar]
- 24.Balasubramanian N, Meier JA, Scott DW, Norambuena A, White MA, Schwartz MA. RalA-exocyst complex regulates integrin-dependent membrane raft exocytosis and growth signaling. Curr Biol. 2010;20:75–79. doi: 10.1016/j.cub.2009.11.016. [DOI] [PMC free article] [PubMed] [Google Scholar]
- 25.Tanaka K, Arao T, Maegawa M, Matsumoto K, Kaneda H, Kudo K, Fujita Y, Yokote H, Yanagihara K, Yamada Y, Okamoto I, Nakagawa K, Nishio K. SRPX2 is over-expressed in gastric cancer and promotes cellular migration and adhesion. Int J Cancer. 2009;124:1072–1080. doi: 10.1002/ijc.24065. [DOI] [PubMed] [Google Scholar]
- 26.Kalushkova A, Fryknas M, Lemaire M, Fristedt C, Agarwal P, Eriksson M, Deleu S, Atadja P, Osterborg A, Nilsson K, Vanderkerken K, Oberg F, Jernberg-Wiklund H. Polycomb target genes are silenced in multiple myeloma. PLoS One. 2010;5:e11483. doi: 10.1371/journal.pone.0011483. [DOI] [PMC free article] [PubMed] [Google Scholar]
- 27.Huang W, Deng B, Wang RW, Tan QY, He Y, Jiang YG, Zhou JH. BCAR1 protein plays important roles in carcinogenesis and predicts poor prognosis in non-small-cell lung cancer. PLoS One. 2012;7:e36124. doi: 10.1371/journal.pone.0036124. [DOI] [PMC free article] [PubMed] [Google Scholar]
- 28.(a) Oshiro MM, Kim CJ, Wozniak RJ, Junk DJ, Munoz-Rodriguez JL, Burr JA, Fitzgerald M, Pawar SC, Cress AE, Domann FE, Futscher BW. Epigenetic silencing of DSC3 is a common event in human breast cancer. Breast Cancer Res. 2005;7:R669–R680. doi: 10.1186/bcr1273. [DOI] [PMC free article] [PubMed] [Google Scholar]; (b) Tselepis C, Chidgey M, North A, Garrod D. Desmosomal adhesion inhibits invasive behavior. Proc Natl Acad Sci U S A. 1998;95:8064–8069. doi: 10.1073/pnas.95.14.8064. [DOI] [PMC free article] [PubMed] [Google Scholar]
- 29.Thiery JP, Sleeman JP. Complex networks orchestrate epithelial-mesenchymal transitions. Nat Rev Mol Cell Biol. 2006;7:131–142. doi: 10.1038/nrm1835. [DOI] [PubMed] [Google Scholar]
- 30.Onder TT, Gupta PB, Mani SA, Yang J, Lander ES, Weinberg RA. Loss of E-cadherin promotes metastasis via multiple downstream transcriptional pathways. Cancer Res. 2008;68:3645–3654. doi: 10.1158/0008-5472.can-07-2938. [DOI] [PubMed] [Google Scholar]
- 31.Katafiasz D, Smith LM, Wahl JK., 3rd Slug (SNAI2) expression in oral SCC cells results in altered cell–cell adhesion and increased motility. Cell Adhes. 2011;5:315–322. doi: 10.4161/cam.5.4.17040. [DOI] [PMC free article] [PubMed] [Google Scholar]
- 32.Rhinn M, Dolle P. Retinoic acid signalling during development. Development. 2012;139:843–858. doi: 10.1242/dev.065938. [DOI] [PubMed] [Google Scholar]
- 33.Gage PJ, Zacharias AL. Signaling “cross-talk” is integrated by transcription factors in the development of the anterior segment in the eye. Dev Dyn. 2009;238:2149–2162. doi: 10.1002/dvdy.22033. [DOI] [PMC free article] [PubMed] [Google Scholar]