
Fig. 5.
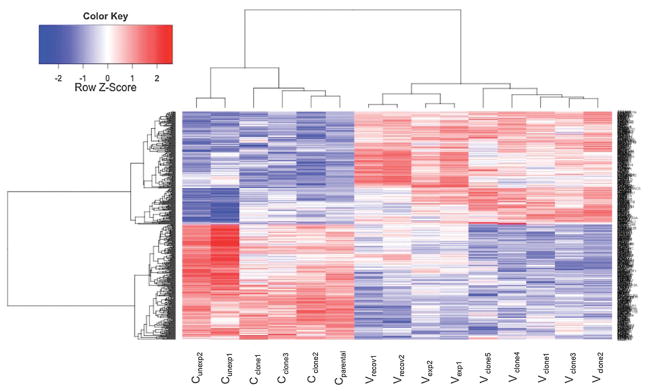
Heatmap. Heatmap depicting 469 differentially expressed genes (adjusted p-value ≤ 0.05) found in all three experiments (DEG.ABC). 232 genes were significantly up regulated (red) and 237 genes were significantly down regulated (blue) relative to appropriate controls. From left to right: control cells that remained unexposed (Cunexp), control clones that spontaneously grew in soft agar (Cclone), parental cells (Cparental), cells that recovered for 1 week from chronic NaVO3 exposure (Vrecov), cells exposed to NaVO3 for 5 weeks (Vexp), and transformed clones from soft agar (Vclone).