

Abstract
Transcranial magnetic stimulation (TMS) can be delivered during fMRI scans to evoke BOLD responses in distributed brain networks. While concurrent TMS-fMRI offers a potentially powerful tool for non-invasively investigating functional human neuroanatomy, the technique is currently limited by the lack of methods to rapidly and precisely localize targeted brain regions – a reliable procedure is necessary for validly relating stimulation targets to BOLD activation patterns, especially for cortical targets outside of motor and visual regions. Here we describe a convenient and practical method for visualizing coil position (in the scanner) and identifying the cortical location of TMS targets without requiring any calibration or any particular coil-mounting device. We quantified the precision and reliability of the target position estimates by testing the marker processing procedure on data from 9 scan sessions: Rigorous testing of the localization procedure revealed minimal variability in coil and target position estimates. We validated the marker processing procedure in concurrent TMS-fMRI experiments characterizing motor network connectivity. Together, these results indicate that our efficient method accurately and reliably identifies TMS targets in the MR scanner, which can be useful during scan sessions for optimizing coil placement and also for post-scan outlier identification. Notably, this method can be used generally to identify the position and orientation of MR-compatible hardware placed near the head in the MR scanner.
Keywords: concurrent TMS-fMRI, interleaved TMS-fMRI, stereotaxy, connectivity
Introduction
With transcranial magnetic stimulation (TMS), a pulsed magnetic field creates current flow non-invasively in the brain. This powerful tool is now routinely used to manipulate human brain activity safely and non-invasively in research and clinical interventions (Hallett, 2007). Recent technical advancements enable the use of TMS within the MR scanner environment: Functional neuroimaging can detect brain response changes in stimulated cortical targets and remote but connected brain regions (Bestmann et al., 2008; Driver et al., 2009; Ruff et al., 2009). Thus, concurrent TMS-fMRI can causally reveal functional brain networks in humans, and this multimodal approach has been used to characterize human motor (Baudewig et al., 2001; Bestmann et al., 2004; Hanakawa et al., 2009), sensory (Blankenburg et al., 2008; Leitao et al., 2012; Ruff et al., 2008; Ruff et al., 2006; Sack et al., 2007), and attention (Blankenburg et al., 2010a, b) network connectivity.
Precise and stable positioning of the TMS coil, with respect to the participant's head, is critical in all TMS experiments. Although there are many strategies for determining the initial positioning of the TMS coil (Herwig et al., 2001; Sparing et al., 2010), here we focus instead on the need to locate, monitor, and track the position of the fixed TMS coil relative to the subject's brain (i.e., stereotaxy) in an MR environment. In traditional TMS experiments, frameless stereotaxic methods using 3D camera systems are used to track simultaneously the position of markers labeling the TMS coil and the participant's head (Schonfeldt-Lecuona et al., 2005) (e.g., Brainsight Frameless, Rogue Research, Inc.). Use of these conventional stereotaxic approaches is limited in concurrent TMS-fMRI experiments because of the additional hardware requirements imposed by the strong magnetic fields, namely, being able to operate effectively and safely in a magnetic environment without introducing noise into the fMRI data acquisition process. The scanner's strong magnetic field (3T vs 25-65μT for Earth) can also affect the operation of the circuits and batteries in these electronic devises. An additional consideration is that the limited space in the scanner bore and the imaging head coil severely restricts the line-of-sight between tracking markers and their cameras. Because of these constraints, stereotaxy in the scanner environment has either been performed using camera-based systems outside the bore (Andoh and Zatorre, 2012) or using custom systems comprising specialized coil holders and analysis software (Bohning et al., 2003a; de Vries et al., 2009; Moisa et al., 2009). Critically, while these methods are robust for fixing the coil relative to the participant's head, they require specialized hardware and can depend on extensive calibration and setup. Alternatively, the TMS coil has been labeled with vitamin capsules (Bestmann et al., 2006; Sack et al., 2007) or water-filled hoses (Bestmann et al., 2003a; Bestmann et al., 2003b; Kemna and Gembris, 2003; Leitao et al., 2012), which are visible in the acquired images; however, the specific methods used to relate these labels to the targeted brain region and rigorous validation of these methods have not been reported. Furthermore, many of these previously reported methods tend to be used for post hoc target validation, rather than online coil position optimization, leaving open an increased likelihood of data acquisition with undesired TMS coil positioning. Although the validity of TMS targeting motor cortex can be confirmed by monitoring motor evoked potentials (Bestmann et al., 2004, 2005; Hanakawa et al., 2009) or motor responses (Pridmore et al., 1998), such direct and observable measurements of TMS-induced activity are unavailable for cortical targets outside motor cortex. Therefore, there is a critical need for a simple, general, and reliable procedure for localizing the TMS coil in the MR scanner and identifying the cortical area targeted by TMS.
Here we describe a general and efficient method for labeling and visualizing a TMS coil that is used in the MR scanner – This procedure can be used with any coil-mounting device and requires no setup- or scanner-specific calibration. We develop the rationale behind a semi-automated procedure for processing the marker information to determine unambiguously the TMS coil's position and orientation with respect to the participant's brain. This marker processing procedure enables rapid estimation of a TMS trajectory, passing between the coil and the brain, which can be used to characterize the location and identity of the cortical surface immediately beneath the coil (which is most likely to be stimulated). Based on data from 9 experimental sessions, we characterize the marker processing procedure's reliability and robustness and validate the performance of the marker processing procedure using concurrent TMS-fMRI targeting motor cortex.
Material and methods
Participants
Eight healthy, right-handed volunteers participated in concurrent TMS-fMRI experiments. One subject participated in two sessions. Volunteers provided informed consent and were paid for their participation. All procedures were approved by the Institutional Review Board for human subject research at the Johns Hopkins University School of Medicine.
Interleaved TMS-fMRI
Bi-phasic stimuli were delivered using a Magstim Expert System (Magstim Co., Dyfed, UK) and a MR-compatible figure-of-eight coil (70 mm wing diameter). Radio-frequency noise was filtered using a custom filter box (Magstim Co.) and ferrite sleeves. The TMS coil was secured to the scanner table using a custom-built plastic holder that enabled precise and stable coil placement.
For each participant, prior to scanning, we identified the optimal coil position over the left motor cortex for eliciting movements of the fingers of the right hand with TMS. We first located the stimulation site by applying TMS outside of the scanner environment and we verified the identified scalp site when the subject was positioned on the scanner bed. We defined each participant's resting motor threshold (RMT) by establishing the lowest TMS intensity that evoked a visible finger twitch in 5 out of 10 trials (Bestmann et al., 2005; Pridmore et al., 1998). Thresholds (% of stimulator output) across the participants ranged from 61 to 90 (mean RMT ± SEM = 82.2 ± 2.8).
TMS coil marker
A plastic, V-shaped chamber was fixed to the stimulating surface of the TMS coil such that the vertex of the marker fell directly over the center of the coil (Fig. 2A). The chamber was filled with diluted Gadolinium solution (1:300), a standard MRI contrast agent (Gracco Diagnostics Inc., Princeton, NJ), so that we could visualize the marker to estimate the TMS coil's position and orientation. Using a V-shaped marker, rather than separate discrete labels like vitamin capsules or fiducial markers, facilitates detection of the label in the image (see below). The width of the marker introduced a 5-mm gap between the TMS coil and the participant's scalp, but the additional stimulation power requirements related to the added distance (Bohning et al., 1997) fell within the operational range of the Magstim stimulator unit. We visualized the contrast marker using a 3D fast gradient echo pulse sequence (TR = 7 ms, TE = 3 ms, FA = 11°, inplane resolution = 0.89 mm, 100 slices, slice thickness = 2 mm, scan duration = 42.1 s). Two marker scans were conducted on each participant, at the beginning and end of each scan session (Fig. 1A), so that we could directly assess movement between the participant's head and the TMS coil.
Fig. 2.
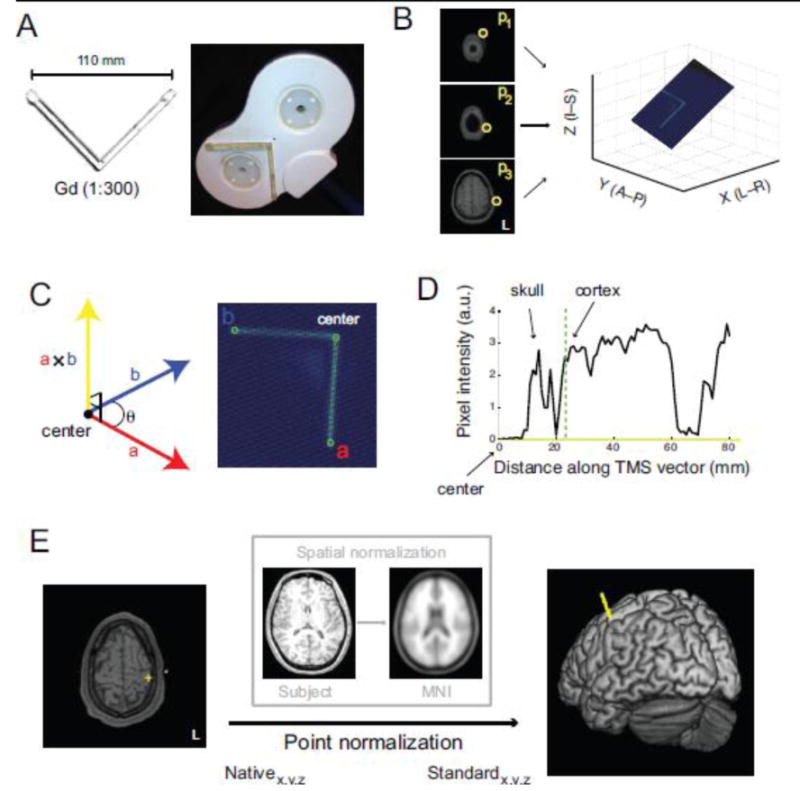
Marker processing procedure. A) MR-compatible TMS coil is labeled by a chamber loaded with diluted Gadolinium. B) Any three points (yellow circles) along the marker define the unique plane containing the entire marker. C) Determination of the center of the TMS coil (i.e., vertex of the marker) and a point along each of the marker arms (points a and b) define co-planar vectors whose cross-product yields a vector approximating the TMS trajectory (yellow ray). D) The intersection between the TMS vector and the cortex indicates the location of the targeted cortical surface beneath the coil's center. E) TMS target positions can be projected from native space to standard space to be identified from a brain atlas.
Fig. 1.
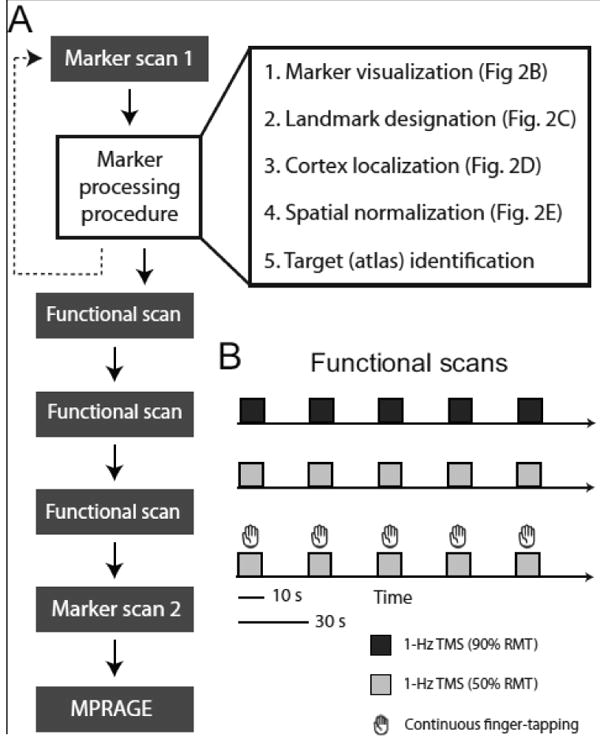
Experimental design. A) Flowchart of scan sequence and marker processing procedure steps. Graphical depictions of each processing step are provided in Fig. 2. B) Schematic of functional scans. In a block-design, subjects received 10-s trains of high-intensity (90% resting motor threshold (RMT)) or low-intensity (50% RMT) sub-threshold rTMS (1-Hz). In a separate scan, subjects performed 10-s blocks of continuous finger-tapping cued by low-intensity TMS (Materials and methods).
Marker processing procedure
We developed a semi-automated software package that performed the following steps (Fig. 1A): 1) localize and visualize the V-shaped contrast marker, 2) designate landmarks along the V-marker to estimate the trajectory of TMS (a vector originating from the V-marker's vertex and projecting orthogonal to the plane of the coil's surface and through the scalp), 3) localize the position of the stimulated cortical surface, 4) normalize marker scan and stimulation target coordinate into standard space, and 5) identify the stimulated cortical region using a brain atlas (MNI). The software package comprises custom shell scripts, IDL code, and Matlab routines.
To localize and visualize the position of the contrast marker, users identify 3 slices containing visible segments of the marker (Fig. 2B). Users select from a montage of axial slices spanning the position of the TMS coil (montage not shown), and the specific designation of a point in each of the 3 selected slices (p1, p2, p3; yellow circles) defines a unique plane that contains the entire marker (Fig. 2B).
To estimate the TMS trajectory into the brain, users rotate the plane to visualize fully the marker (Fig. 2C) and designate 3 landmarks along the marker (green circles): the center of the coil (indicated by the vertex along the V-shaped marker) and a point on each “arm” of the marker. These points define 2 vectors (a⃑ and b⃑) that radiate from the center of the TMS coil along the plane of the coil's stimulating surface. The cross product of these vectors (a⃑ × b⃑) yields a vector that is orthogonal to the coil's surface. We took this vector (Fig. 2C; yellow ray) to be an approximation of the trajectory of TMS into the brain, corresponding to the intersection of the fields generated by the two coils in the figure-of-eight arrangement (Hallett, 2007).
The process of determining the initial point of contact of the TMS trajectory vector with the brain surface (i.e., locating the cortex) is illustrated in Fig. 2D. A profile of pixel intensity values encountered along the TMS vector, extending from the center of the TMS coil, reveals multiple peaks. The first peak corresponds to the participant's skull and subsequent peaks reflect pixels in cortical and subcortical regions. Users designate a position along the pixel intensity profile corresponding to the leading edge of cortex (dashed green line) and the specific axial slice through which the TMS vector first passes into cortex can be confirmed visually (Fig. 2E, left panel). This provides the estimated position (yellow cross) of the stimulated brain region in native (subject) coordinates.
To identify the stimulated cortical site, each participant's brain volume is normalized to the MNI T1-template using the “Normalise” function in SPM8 (Fig. 2E, inset box). Estimated normalization parameters are then used to point-normalize the position of the stimulated brain region, projecting this point from native space into standard (e.g., MNI) space (Fig. 2E, right panel). The identity of the TMS point in standard coordinates (e.g., Brodmann nomenclature) is then queried from a standard brain atlas (Talairach and Tournoux, 1988).
Magnetic Resonance Imaging
MRI scanning was conducted on a Philips Intera 3.0 Tesla (3T) scanner (Philips Healthcare, Best, The Netherlands) in the F. M. Kirby Research Center for Functional Brain Imaging at the Kennedy Krieger Institute. A body coil was used for RF transmit and a 6-channel phased array surface coil (Philips) for reception. Anatomical images were acquired using a T1-weighted MP-RAGE sequence (TR = 8.2 ms, TE = 3.8 ms, FA = 8°, inplane resolution = 1 mm, slice thickness = 1 mm). Functional images were acquired with a T2*-weighted gradient echo (GRE) echo planar imaging (EPI) pulse sequence (TR = 1000 ms, TE = 30 ms, FA = 61°, 80×80 matrix, FOV = 220 mm, slice thickness = 6 mm, no gap, parallel imaging (SENSE) = 2.0) yielding a 2.75×2.75×6 mm3 nominal voxel size. The time interval between successive slices was minimal such that the entire volume was acquired in 816 ms, leaving a sufficiently large interval between image volumes during which a single TMS pulse could be delivered without inducing artifacts (Bestmann et al., 2003a; Shastri et al., 1999). We confirmed image integrity by visual inspection. Because we were interested in characterizing BOLD signal changes in cortical and subcortical motor regions, we acquired 15 oblique axial slices (parallel to the brainstem) that spanned sensorimotor cortex to cerebellum. The first 7 volumes were discarded to allow for T1 equilibrium effects.
We characterized TMS and motor (finger-tapping) responses with a block-design procedure. During functional scans (Fig. 1B) that comprised only TMS, participants remained at rest while receiving 10 s of 1-Hz rTMS followed by 20 s with no stimulation. This cycle repeated 5 times during each scan. Separate scans were run with 2 subthreshold TMS intensities (90% RMT and 50% RMT). Participants also performed a cued motor task (finger-tapping) while undergoing fMRI (Fig. 1B): Subjects were asked to touch their right thumb to each finger of their right hand in sequence repetitively in 10-s blocks followed by 20 s of quiet rest. For each 10-s interval during which participants performed continuous finger-tapping movements, the onset and offset of 10-s trains of 1-Hz rTMS (low intensity; 50% RMT) provided participants with auditory cues to start and stop performance (Bestmann et al., 2004, 2005; Denslow et al., 2005; Moisa et al., 2009). Scans were separated by a 2–3 min inter-scan-interval and scan order was counterbalanced across participants. Although prolonged application of 1-Hz rTMS can result in changes in cortical excitability (Maeda et al., 2000a), TMS was unlikely to induce excitability changes during our sessions given the timing of the scans and TMS trains, the number of TMS pulses, and the TMS intensity (see Discussion).
Data analysis
Our analyses focused on two primary goals: 1) Quantifying the robustness and reliability of the marker processing procedure, and 2) validating the performance of the marker processing procedure in a concurrent TMS-fMRI experiment. We were especially interested in assessing the marker processing procedure's performance, given its semi-automated nature, as user input (e.g., manual designation of marker landmarks) may have introduced variability in coil localization and target identification. Because motor network connectivity has been extensively characterized with concurrent TMS-fMRI (Baudewig et al., 2001; Bestmann et al., 2003b, 2004b, 2005; Bohning et al., 1999; Denslow et al., 2005; Hanakawa et al., 2009; Kemna and Gembris, 2003; Moisa et al., 2009) and resting-state fMRI (Buckner et al., 2011; Krienen and Buckner, 2009; Lu et al., 2011; O'Reilly et al., 2010), we focused on cortical and subcortical motor regions in our validation experiment and compared cued motor and TMS-evoked responses in this network.
Performance analysis of marker processing procedure
Two users (JMY and DAL) separately processed the marker scans and we characterized the robustness and reliability of the marker processing procedure. To test performance, we processed each marker scan 20 times: The variability in the position and orientation estimates generated by the marker processing procedure then provide a measure of the robustness and reliability of the method.
We computed separate error metrics for position estimations for the TMS coil (i.e., coil's center as indicated by the marker) and the stimulated location on each participant's cortical surface. For position estimates derived from the scans conducted on the ith subject, we computed a measure of error (εi):
where xij, yij, and zij indicate the estimated position on the jth iteration, and , , and indicates the average estimated positions over the 20 iterations. The error metric thus expresses the average deviation in Euclidean distance of position estimates for a given scan from the mean position estimate computed over all repeated processing for that scan. Error metrics were averaged over all scans to assess the general reliability of position estimates. In a related analysis, we calculated the variability in position estimates in each dimension separately across repeated processing of each scan. Variance values were averaged across scans for a general assessment of variability in position estimates.
The orientation of the TMS coil, relative to the brain, can profoundly impact the nature of TMS effects on cortical processing (Sakai et al., 1997; Werhahn et al., 1994). The marker processing procedure provides estimates of the handle orientation of the TMS coil, which is defined as a vector (h) that extends from the center of the TMS coil that: 1) is co-planar to a⃑ and b⃑ (the vectors corresponding to the arms of the ‘V’-marker) and 2) is orthogonal to the bisector of the angle formed by a⃑ and b⃑. To establish the variability in handle orientation estimates, for the ith subject's scan, we computed angular separation measures:
where hij is the estimated handle vector on the jth iteration and is the average handle vector over 20 iterations of the processing procedure performed on the same scan. This angular error measure captures the total deviation in coil orientation about the roll, pitch, and yaw axes. We combined angular error estimates across subjects for a population distribution. We similarly characterized variability in estimates of TMS trajectory by generating a population distribution of angular error measured.
Comparison of marker scans acquired at the outset and conclusion of scan sessions provides helpful information regarding the movement of the coil (relative to the subject's head) over the course of the experiment. For each subject, we computed the difference in stimulated sites (total Euclidean distance and displacement in separate dimensions) established from marker scans acquired at the beginning of scan sessions (prior to experimental scans) and at the end of the session (following experimental scans). We also calculated the distance between the TMS coil and the stimulated cortical surface and compared this length established for the beginning and end of each session.
Because the TMS coil was fixed firmly to the scanner table, observed deviations in the stimulated sites were presumably due to the participants' head movements over the scan sessions. We tested this by computing the correlation between the deviations in stimulated sites (total Euclidean distance) and measures of participant head movement. For each participant, we computed movement indices based on root mean square (RMS) of the 6 rigid body parameters estimated with spatial realignment during data preprocessing (Oakes et al., 2005):
where rp are the 6 realignment parameters estimated for time t. For each subject, we computed the average and maximum RMS values for separate movement indices.
fMRI Data Analysis
Imaging data were processed and analyzed with Matlab (Mathworks) using SPM8 (http://www.fil.ion.ucl.ac.uk/spm). In data preprocessing, images were corrected for slice timing differences and each participant's scans were realigned using the average volumes as references. Scans were spatially normalized into MNI space (using normalization parameters estimated during segmentation) and the resampled images (2 × 2 × 2 mm3 voxels) were spatially smoothed with an isotropic 5-mm FWHM Gaussian kernel.
General Linear Model
For each subject, we estimated BOLD response variation related to TMS and motor performance (finger-tapping) using multiple regression of voxelwise time series. Separate covariates were included for low intensity (50% RMT) and high intensity (90% RMT) TMS blocks (onsets defined by the first TMS pulse in each 10-s train). Covariates were convolved with the canonical hemodynamic response function. Voxelwise parameter estimates were derived for each participant using full general linear models that also included estimated motion parameters as nuisance regressors. Time series data were high-pass filtered using a 70-s cutoff. Statistical parametric maps (t-and Z-statistics) were generated for linear contrasts of each covariate.
To isolate activations related to motor responses, we contrasted parameter maps for finger-tapping (cued by low-intensity TMS) and maps for low-intensity TMS alone. We directly compared the activation patterns relating to motor responses and TMS-evoked responses by deriving individual subject conjunction maps summarizing the intersection of voxels exhibiting significant (p < 0.01) response variation related to finger-tapping and 90%RMT-TMS (both contrasted with low-intensity TMS alone). Thus, significant conjunction voxels survive a statistical threshold of α < 0.0001 (uncorrected). We computed a population map by counting the number of subjects exhibiting significant conjunctions at each voxel. To characterize motor and TMS-evoked responses in the cerebellum, we performed a separate conjunction analysis on the data isolated for the cerebellum and spatially-normalized into SUIT-space (Diedrichsen, 2006).
Outlier analysis
The marker processing procedure provided estimates of stimulation sites that we used to identify outlier (i.e., “off-target”) participants. We performed additional analyses to verify that TMS-evoked BOLD activation patterns in participants identified as outliers by the marker processing procedure were distinct from activations in “on-target” participants.
We performed a within-subjects analysis comparing the TMS-related response pattern to activation patterns related to cued motor performance. Based on our motor cortex TMS target, we reasoned that “on-target” TMS response patterns should be highly overlapping with response patterns related to finger-tapping. For each participant, we derived separate binary maps summarizing voxels exhibiting significant (p < 0.001) response variation related to finger-tapping and TMS (90% RMT). We then computed difference maps that designated voxels as significant for TMS but not finger-tapping. Given the hypothesis that motor cortex TMS would reveal connectivity in a distributed motor network, we predicted that difference maps for “on-target” participants would reveal few deviant voxels while difference maps for “off-target” participants would reveal many deviant voxels.
We also performed a between-subjects analysis that directly compared TMS-related responses patterns. We reasoned that TMS-evoked activation patterns would be similar across “on-target” participants and dissimilar compared to “off-target” participants. Using binary maps summarizing voxels significant (p < 0.001) for TMS, we computed difference maps, for each pair of participants, which displayed voxels significant for TMS in one subject (reference) and not the other subject (comparison). For each participant, a summary map was generated by aggregating all difference maps in which that participant was the reference: The number of comparison participants that did not also exhibit significant TMS responses at each voxel was summarized by a single value ranging from 0–8. We predicted that summary maps for “off-target” participants would contain many more voxels revealing differences with the other participants compared to maps for “on-target” participants. We also predicted that the magnitude of differences (i.e., number of differing participants at each voxel) would be larger for “off-target” participants.
Results
TMS coil visualization
TMS coils labeled with the Gadolinium-loaded marker were highly visible in 3D fast gradient echo scans (Fig. 3). For each participant, the TMS coil was positioned over left motor cortex (M1) at a location based on our ability to induce visible muscle movements in the contralateral (right) hand. In all experiments, the TMS coil was oriented such that the “handle” was tilted 45° to the midline in the posterolateral direction, to produce posterior-anterior directed current that has been shown to preferentially elicit early I-waves (Werhahn et al., 1994). In one participant (Fig. 3; S1*), this was achieved with the TMS coil cable (Fig. 2A) protruding along the conventional “handle” orientation. In all other participants, the coil wiring was reversed so that the posterior-anterior direction of the current was preserved, but the cable protruded 45° to the midline in the anteromedial direction. One subject participated in 2 sessions, separated by 1 week (Fig. 3; S6+ and S9+).
Fig. 3.
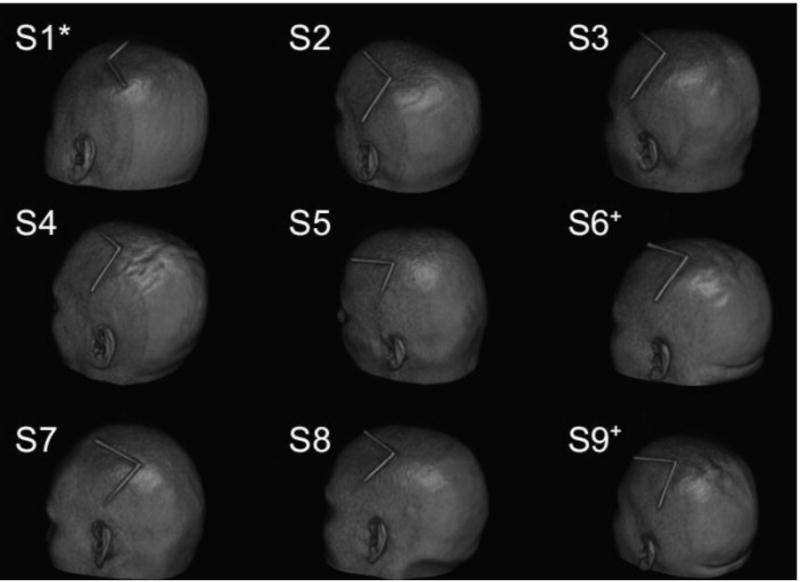
Volume renderings displaying marker-indicated coil positions. (*) indicates TMS coil wiring reversed. (+) indicates separate test sessions for the same participant.
Marker processing procedure performance
TMS coil and target position estimates were highly reliable (Fig. 4A): Position errors over repeated processing of the same scan (Materials and methods) were typically small (Coil position: 1.03 ± 0.06mm; Cortex position: 1.07 ± 0.06mm). This variability is relatively small compared to the spatial focality of TMS (Cohen et al., 1990) (i.e., analysis variability is 10% of TMS focality estimates). Variability in the estimated positions may be partially attributable to the spatial resolution of the 3D fast gradient echo scans (0.9 × 0.9 × 1mm) as there was greater variance in position estimates along the inferior-superior axis (Fig. 4B; F(2,93) = 10.58, p < 10-5). Inter-user agreement was high for position estimates: Across all scans, cortex position estimates differed between users, for the same scan, by an average distance of 0.76 ± 0.07mm and position estimates in each dimension were highly correlated between users (Pearson's r; x-axis: 0.9979; y-axis: 0.9998; z-axis: 0.9995).
Fig. 4.
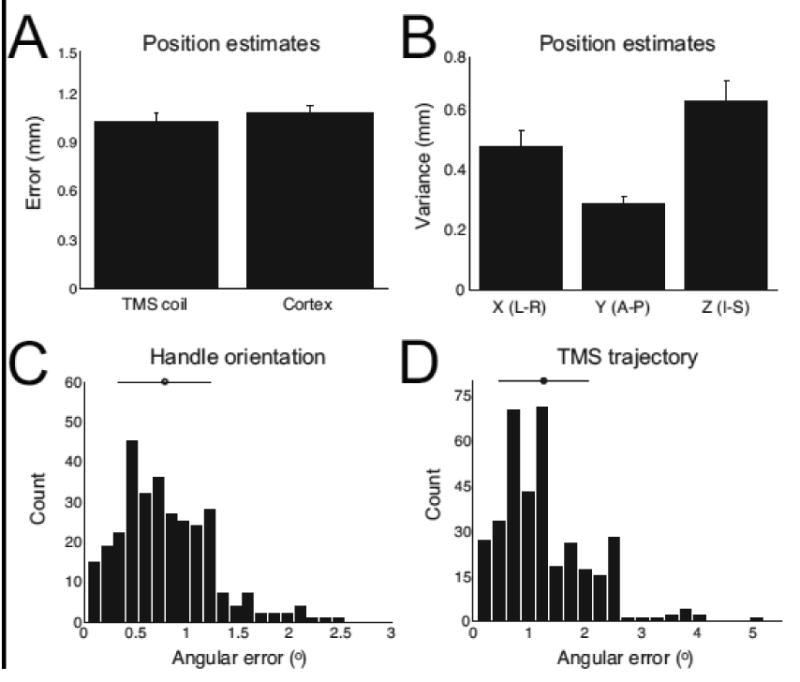
Performance assessments for marker processing procedure. A) Average error in coil and cortical target position estimates (Materials and methods). Error bars indicate s.e.m. B) Average variability in position estimates in x-, y-, and z-dimension. Error bars indicate s.e.m. C) Distribution and average of angular errors in handle orientation estimates over repeated processing of all scans. Error bar indicate s.d. D) Distribution and average of angular errors in TMS trajectory estimates over repeated processing of all scans. Error bar indicate s.d.
Handle orientation estimates were highly reliable (Fig. 4C). Across repeated processing of scans, angular errors (Materials and methods) were small (average angular error: 0.79 ± 0.04°). Variability in TMS trajectory estimates (Fig. 4D) was also minimal (average angular error: 1.26 ± 0.04°). The greater angular errors in TMS trajectory estimates compared to handle orientation values is likely due to: 1) the dependence of trajectory definitions on both the coil position and the stimulated cortical site position (in MNI space) and 2) small rounding errors resulting from the projection of these position estimates from native space into MNI space. If TMS trajectory values were instead based only on TMS coil positions (and a⃑ and b⃑) in native space, as handle values are defined (Materials and methods), angular errors in TMS trajectory estimates would necessarily match angular errors in handle orientation values. Therefore, spatial normalization does appear to influence trajectory orientation estimates, although variability is minimal regardless of the coordinate space.
Assessment of coil movement: Before and after experiment comparisons
In each experiment, we conducted a marker scan before and after performing concurrent TMS-fMRI scans. For each participant, we processed the two marker scans and compared the estimated positions of the stimulated cortical site (Fig. 5A). Across participants, the stimulation site estimated from the marker scan acquired at the end of the session deviated slightly from the site estimated at the start of the session (average deviation: 8.44 ± 1.92mm). Deviation magnitude over the experimental session was similar in the left-right (4.06 ± 0.88mm), anterior-posterior (4.28 ± 1.04mm), and inferior-superior (4.19 ± 2.04mm) dimensions. We also confirmed that the position of the TMS coil relative to the participant's head shifted slightly during the experimental session by comparing distance estimates between the coil and each participant's brain (Fig. 5B). Prior to the experiment, the stimulated brain surface was on average 21.45 ± 0.96mm removed from the TMS coil. At the end of the session, this distance increased to 26.17 ± 2.42mm. Although this difference did not reach statistical significance (p = 0.09), these data highlight the potential risk for substantial movement between the coil and the participant's head during scanning (see Discussion). Because the TMS coil was secured firmly to the scanner bed, the observed deviations in stimulation sites must have resulted from the participants' slight head movements, despite instructions to remain still throughout the scans. Indeed, we found that deviations in stimulation sites over the sessions were significantly correlated with participants' average head movement (Fig. 5C; Pearson's r = 0.77, p < 0.05) and maximum head movement (Pearson's r = 0.89, p < 0.005).
Fig. 5.
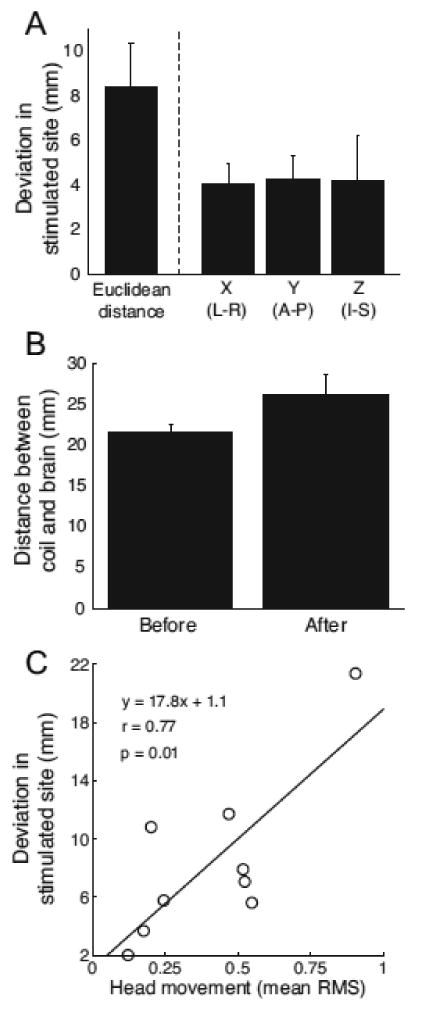
Assessment of TMS coil movement within sessions. A) Average difference in estimated stimulation site from marker scans acquired before and after concurrent TMS-fMRI scans in each experimental session. Error bars indicate s.e.m. B) Average distance between the TMS coil and cortical surface estimated for scans acquired before and after concurrent TMS-fMRI scans. C) Relationship between estimates of coil movement and head movement (Materials and method). Across subjects, coil displacement was significantly correlated with average head movement.
Target validation: Motor network connectivity
Prior to scanning, we positioned the TMS coil over each participant's left motor cortex and elicited visible muscle activity in the participant's right hand. We chose this target for our validation experiment because multiple studies have reported BOLD activation patterns related to motor cortex TMS and the anatomical connectivity of motor cortex is well-characterized in invasive tracer studies (Kelly and Strick, 2003; Schmahmann, 1996). Marker scan processing confirmed that the TMS coil remained over left motor cortex after initial positioning in 8 of 9 sessions (Fig. 6A; green markers indicate on-target position over left sensorimotor cortex; red marker indicates off-target position over posterior parietal cortex, which was confirmed by a distinct TMS activation pattern; see below). In individual participants (Fig. 6B–D), high-intensity TMS (90% RMT) over left motor cortex evoked correlated changes in BOLD signals in a distributed cortical and subcortical network comprising bilateral premotor cortex, bilateral primary somatosensory cortex, bilateral second somatosensory cortex, left medial pontine nuclei, bilateral cerebellum, deep cerebellar nuclei, thalamic nuclei, and the basal ganglia (caudate and putamen). Auditory regions (BA 21/22/41), reflecting responses to TMS coil discharge sounds, also exhibited significant BOLD responses. TMS discharge also evoked responses in the occipital lobe, likely reflecting eye movements and blinking responses related to startle (Bodis-Wollner et al., 1999; Xu-Wilson et al., 2011). This distributed activation pattern corroborates networks previously shown to be responsive to motor cortex TMS in concurrent TMS-fMRI experiments (Baudewig et al., 2001; Bestmann et al., 2003b, 2004b, 2005; Bohning et al., 2003b; Bohning et al., 1999; Bohning et al., 2000a; Bohning et al., 2000b; Denslow et al., 2005; Hanakawa et al., 2009; Kemna and Gembris, 2003; Moisa et al., 2009; Shitara et al., 2011). Cued motor responses and motor cortex TMS consistently activated overlapping networks across the participants (Fig. 6C,D; see also, Fig. 7). In the cerebellum (Fig. 6D), conjunction voxels were prominent in superior lobules (HV and HVI). These responses, combined with the activations in ventromedial pons, are consistent with prominent models of cerebro-ponto-cerebellar circuitry derived from anatomical tracing (Schmahmann, 1996) and functional neuroimaging (Desmond et al., 1997). Overlapping motor and TMS responses were also present in inferior cerebellar lobules (HVIII), in agreement with previous reports of the cerebellum's multiple somatomotor representations (Buckner et al., 2011; O'Reilly et al., 2010).
Fig. 6.
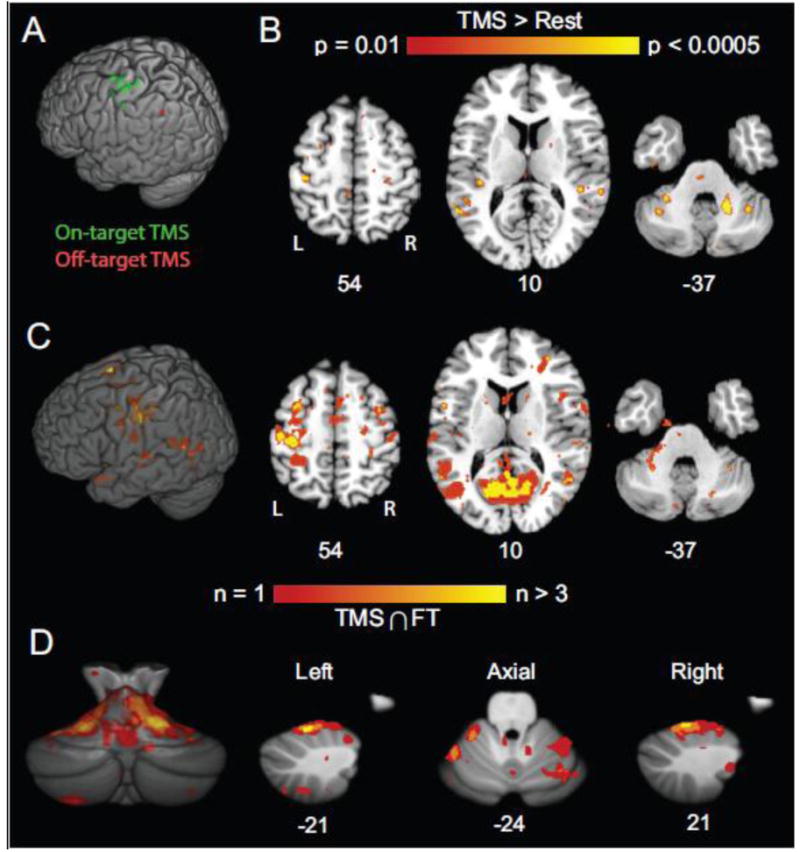
Validation results from concurrent TMS-fMRI experiments. A) Estimates of stimulated sites (Green marks indicate on-target stimulation; Red mark indicates off-target stimulation). B) Activation pattern (high-intensity TMS > Rest) for example subject. Coordinates indicate plane in MNI atlas space. C) Population map showing conjunction of significant activations related to TMS and cued motor responses (Materials and methods). Color scale indicates number of subjects with significant conjunctions (p < 0.0001) at each voxel. TMS and cued motor performance yielded overlapping activations in distributed cortical and subcortical networks. D) Population map of the cerebellum showing conjunction of activations related to TMS and cued motor responses. Conventions as in C.
Fig. 7.
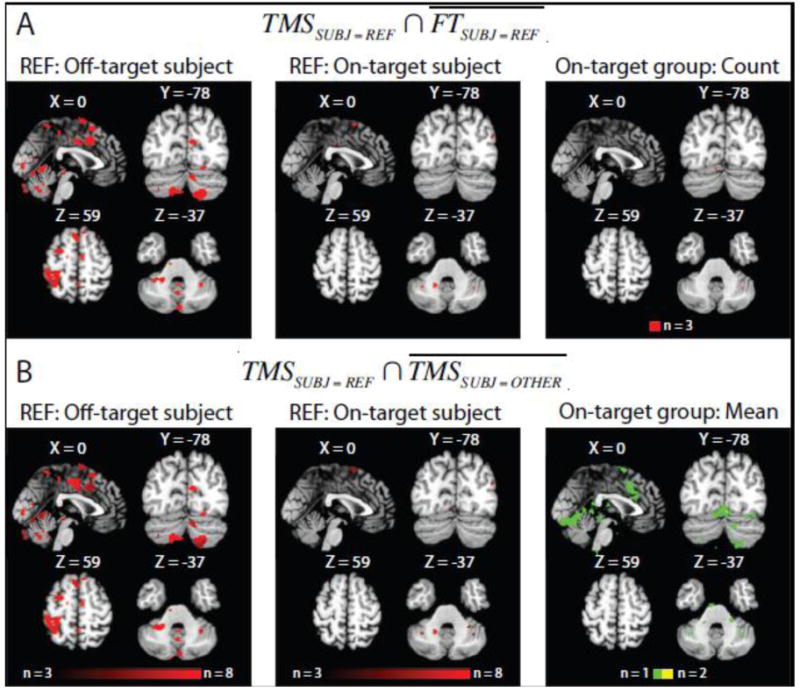
Outlier analysis. A) Within-subjects comparison of response patterns related to high-intensity TMS and cued motor performance. Colored voxels indicate regions significantly responsive to TMS (p < 0.001) but not finger-tapping (i.e., where denotes “not finger-tapping”) for a subject receiving “off-target” TMS (left; see red marker in Fig. 6A) and an example subject receiving “on-target” TMS (middle). In group map (right) summarizing responses collapsed across all participants receiving “on-target” TMS, red voxels indicate regions responsive to TMS but not finger-tapping in 3 participants: Few voxels reveal discrepant response patterns to TMS and finger-tapping that were consistent over the participant group. B) Between-subjects comparison of response patterns related to high-intensity TMS (p < 0.001). In the individual participant summary difference maps (left and middle) the color scale indicates the difference magnitude for each voxel (i.e., number of subjects who did not exhibit significant TMS responses at a voxel significant for the reference subject, or ; Materials and methods). Significant voxels in the subject receiving “off-target” TMS differed from nearly all of the “on-target” sample. In contrast, deviant voxels in “on-target” participants differed from one (green) to two (yellow) other participants on average (right).
Outlier analysis: Response map comparisons
The marker processing procedure identified a single participant as receiving “off-target” TMS which localized over posterior parietal cortex (MNI; -54 -62 46). To verify that the outlier designation was effective and meaningful, we compared the responses of the “off-target” participant with the responses of the “on-target” participants (Fig. 7).
Within-subjects comparisons of TMS-related activations and activations related to finger-tapping revealed robust differences between the “off-target” participant and the “on-target” sample. In the “off-target” participant, TMS, but not finger-tapping, was associated with significant BOLD response changes in cortical and subcortical regions including left posterior parietal cortex, anterior cingulate cortex, ventrolateral pons, and the bilateral lobules HVII in the cerebellum (Fig. 7A, left). In contrast, there were minimal activation differences between TMS and finger-tapping in individual “on-target” subjects (Fig. 7A, middle) and few voxels showed consistent map differences across the group (Fig. 7A, right). The results with the “on-target” group confirm that TMS targeting motor cortex evokes highly similar response patterns as cued motor performance. Critically, these response patterns related to TMS and motor performance differed substantially for the outlier subject.
To more directly assess the similarity between the TMS-evoked responses for the outlier subject and the other participants, we generated summary difference maps (Fig. 7B) based on comparisons of TMS-related activation maps between all pairs of participants (Materials and methods). The pattern of TMS-evoked responses in the “off-target” participant differed from “on-target” response patterns (Fig. 7B, left) with the greatest deviations located in the left posterior parietal cortex, anterior cingulate cortex, ventrolateral pons, and lobule HVIIb/HVIII in the cerebellum. In many voxels, the outlier response pattern differed from all “on-target” patterns (i.e., difference magnitude equals 8). Summary maps for individual “on-target” participants contained fewer voxels indicating differential TMS responses (Fig. 7B, middle). Even for summary map voxels revealing response distinctions across the “on-target” sample (Fig. 7B, right), the average difference magnitude never exceed 2 (i.e., response in a voxel, on average, differed from 2 subjects), implying that “on-target” TMS responses were generally similar. Together, these results indicate that the TMS response pattern in the outlier subject differed substantially from the other response patterns.
Discussion
We have developed a novel method for visualizing a TMS coil in the scanner environment for use in concurrent TMS-fMRI experiments. We describe a semi-automated marker processing procedure for locating the coil's position with respect to the subject's head, characterizing the trajectory of TMS influence passing into the head, and identifying the cortical surface intersecting this trajectory. Rigorous testing of the marker processing procedure revealed minimal variability in coil and target position estimates. Handle orientation and TMS trajectory estimates were also highly reliable. The limited variability in position estimates and trajectory estimates was likely attributable to both the manual steps (i.e., user input) in the semi-automated processing procedure and to slight errors introduced by the image coregistration and spatial normalization processes. Critically, separate users achieved highly consistent results using the procedure, which indicates its general tractability. Lastly, in a validation study, TMS targets identified with the marker processing procedure were confirmed by concurrent TMS-fMRI scans.
Sub-threshold TMS trains targeting motor cortex evoked BOLD signal changes in a distributed motor network spanning cortical and subcortical regions. TMS-evoked activation patterns displayed a high degree of overlap with the response patterns related to cued motor performance. Although prolonged application of 1-Hz rTMS can induce persistent changes in cortical excitability (Chen et al., 1997; Maeda et al., 2000a, b), several aspects of our experimental design limit the potential for such neuroplasticity during our experiment. First, significant neuromodulation with 1-Hz rTMS requires train durations (or pulse numbers) far exceeding 10-s (10 pulses). For instance, Maeda and colleagues (2000a) reported that 240 pulses (presented at 90% RMT) applied continuously over 4 min was insufficient for inducing physiologic excitability changes. Even allowing for potential carry-over effects that may have accumulated over trains the number of pulses in each of our scans did not exceed 50 and totaled just 150 pulses over the 3 scans. Lastly, the fact that each scan was separated by 2-3 minute intervals (allowing for the decay of possible accumulating effects) and that the intensity of 2/3 of the TMS pulses was 50% RMT (far below the stimulation intensity typically used to induce neuroplasticity) suggest that our TMS procedure was unlikely to have affected participants' cortical excitability in the scanner. Instead, the brief TMS trains likely exerted only an acute influence on the neural activity within the motor network, which was detectable as distributed BOLD signal changes.
In the scanner, TMS coils have previously been visualized using high-contrast markers (e.g., vitamin capsules), but the specific methods for inferring the stimulated brain region from these markers are often unstated or unclear (e.g., Sack et al., 2007). More elaborate methods have been employed to navigate and position the TMS coil in concurrent TMS-fMRI experiments, but these have relied on custom coil positioning systems and software programs that require calibration (Bohning et al., 2003a; Moisa et al., 2009). Thus, our primary goal was to develop a general and efficient strategy, which did not require specialized hardware, for visualizing the TMS coil in the MR scanner and for characterizing the location and identity of the targeted cortical area residing beneath the coil. In 8 of 9 experimental sessions, the marker processing procedure indicated coil positioning consistent with TMS targeting left sensorimotor cortex (Fig. 6A). For these scans, analyses confirmed that TMS targeting motor cortex evoked BOLD activation patterns in a distributed network that overlapped with responses to cued motor performance (Bestmann et al., 2004, 2005; Denslow et al., 2005; Moisa et al., 2009; Shitara et al., 2011). Notably, TMS responses in left ventromedial pons and in cerebellar lobules HV and HVI are consistent with the motor pathway in the cerebrocerebellar system (Schmahmann, 1996), providing further evidence for “on-target” TMS of motor cortex. In comparison, a separate and distinct activation pattern was observed for the scan session in which the marker processing procedure indicated “off-target” positioning. Coil position shifted prior to scanning, while the participant was moved into the bore after initial positioning, causing TMS to target an area over posterior parietal cortex. (For this scan, had we performed the marker processing procedure prior to conducting the concurrent TMS-fMRI scan, the TMS coil could have been repositioned to stimulate the desired motor target more accurately.) Critically, the pattern of TMS-evoked responses in this outlier subject is consistent with a parietal cortex TMS target: Cerebrocerebellar circuitry derived from anatomical tracing (Schmahmann, 1996) and human fMRI (Desmond et al., 1997) is consistent with ventrolateral pontine and cerebellar lobular HVIIb/HVIII activations in response to parietal TMS. Thus, the BOLD response patterns validate the performance of the marker processing procedure and highlight its utility in objectively and quantitatively identifying outlier data to exclude from group analysis in the event of off-target stimulation. However, given the brevity of the marker scan and the marker processing procedure, we stress that the primary strength of our proposed strategy is its ability to confirm and optimize coil positioning while the participant is in the scanner.
The marker scans and marker processing procedure can be additionally helpful in tracking movement between the TMS coil and the participant's head over scans or the entire session. On average, the TMS coil moved approximately 8 mm, with respect to the head, over the course of our entire scan session that comprised multiple concurrent TMS-fMRI scans and short rest intervals. While such movement likely contributes to data variability across participants, one could potentially use the data from the marker processing procedure to account for this variance, by including estimated coil movement as regressors in the group level analysis. This analysis can be implemented in standard fMRI analysis programs. For instance, although we acquired marker scans only at the beginning and end of each experiment session comprising 3 consecutive TMS-fMRI, marker scans can instead be acquired before and after each TMS-fMRI scan. In this scenario, a single measure of movement (i.e., deviation in stimulated site) describes each scan and each scan can be analyzed with these movement estimates included as nuisance regressors: A full 2nd level model could then characterize how BOLD responses in each voxel relate to TMS delivery while taking into account (i.e., covarying for) coil movement across the participant group. Such a model could have improved sensitivity as the inclusion of coil movement could potentially explain response variance that would otherwise end up in the error term. Alternatively, the magnitude of coil displacement could covary with TMS intensity resulting in a reduction in analysis sensitivity. Accordingly, the collinearity between response strength and coil movement measures should be assessed when considering the form of the model to be tested. Regardless, the information provided by the marker processing procedure can be helpful for data analysis, either for use in identifying data outliers or for enhancing analysis sensitivity.
While we focused on the importance of monitoring and verifying TMS coil position in concurrent TMS-fMRI experiments, coil positioning, per se, is critical to TMS effectiveness and there are many strategies for determining how to position and orient the coil for stimulation experiments (Sparing et al., 2010). In our validation experiments, we based coil position on each participant's scalp location over which we could directly elicit a visible muscle twitch. This strategy, based on observable TMS-evoked responses, can be effective for motor cortex, but has limited use for non-motor targets. Phosphene production can be similarly used to establish coil positions over visual cortex. For other non-motor targets, scalp surface based approaches can be used (e.g., the 10-20 International EEG system) and the marker processing procedure provides a method for subsequent target identity verification. For more specific, subject-dependent targets (e.g., based on fMRI activations), scalp positions could be determined and marked initially using conventional image-guided frameless stereotaxic neuronavigation systems outside of the scanner environment (Sack et al., 2007) – The marker processing procedure can then both verify the accuracy of TMS coil positioning over the predetermined scalp locations and confirm the locations' identities. In this manner, estimated TMS sites can be directly compared to the MNI coordinates of desired targets, during scan sessions, to determine how close one is to any arbitrary target (e.g., targets derived from functional localizer scans). Critically, the marker processing procedure can be used to locate the TMS coil and identify the targeted brain area regardless of the method used for determining TMS targets and independent of specialized hardware.
In summary, we have described an efficient and general method for tracking the position of the TMS coil with respect to the participant's brain. This method unambiguously defines the position and orientation of the TMS coil, and additionally enables the estimation of the TMS trajectory passing between the coil and the brain. The identity of the targeted cortical area can be queried from brain atlases, based on the coordinates of the cortical surface intersecting the TMS trajectory. This fast procedure can be used during experimental sessions to confirm or optimize coil positioning. Additionally, the marker processing procedure provides a method for offline, post-scan outlier identification. Critically, the described method is independent of any mounting device or positioning system and requires no calibration. Lastly, this efficient method can be used generally to identify the position and orientation of MR-compatible hardware (e.g., tDCS electrodes) placed near the head in the MR scanner.
Highlights.
We developed a general strategy for labeling a TMS coil used in the MR scanner
We described a procedure for identifying TMS targets during fMRI sessions
TMS coil and cortical target position estimates were highly reliable
We validated the marker processing procedure with a concurrent TMS-fMRI experiment
This method can be used with any TMS coil and coil-holding system
Acknowledgments
We especially thank R. Jalinous, T. Brawner, K. Kahl, I. Kusevic, and J. Gillen for technical support and assistance with data collection. We also thank D. Cheng for helpful comments and discussions. This work was supported by NIH grant NS073371 (JMY), the Johns Hopkins University Brain Science Institute (JED), and the Imaging Core of the Johns Hopkins “Intellectual & Developmental Disabilites Research Center” supported by NIH/NICHD P30HD024061.
Footnotes
Publisher's Disclaimer: This is a PDF file of an unedited manuscript that has been accepted for publication. As a service to our customers we are providing this early version of the manuscript. The manuscript will undergo copyediting, typesetting, and review of the resulting proof before it is published in its final citable form. Please note that during the production process errors may be discovered which could affect the content, and all legal disclaimers that apply to the journal pertain.
References
- Andoh J, Zatorre RJ. Mapping the After-effects of Theta Burst Stimulation on the Human Auditory Cortex with Functional Imaging. J Vis Exp. 2012 doi: 10.3791/3985. [DOI] [PMC free article] [PubMed] [Google Scholar]
- Baudewig J, Siebner HR, Bestmann S, Tergau F, Tings T, Paulus W, Frahm J. Functional MRI of cortical activations induced by transcranial magnetic stimulation (TMS) Neuroreport. 2001;12:3543–3548. doi: 10.1097/00001756-200111160-00034. [DOI] [PubMed] [Google Scholar]
- Bestmann S, Baudewig J, Frahm J. On the synchronization of transcranial magnetic stimulation and functional echo-planar imaging. J Magn Reson Imaging. 2003a;17:309–316. doi: 10.1002/jmri.10260. [DOI] [PubMed] [Google Scholar]
- Bestmann S, Baudewig J, Siebner HR, Rothwell JC, Frahm J. Subthreshold high-frequency TMS of human primary motor cortex modulates interconnected frontal motor areas as detected by interleaved fMRI-TMS. Neuroimage. 2003b;20:1685–1696. doi: 10.1016/j.neuroimage.2003.07.028. [DOI] [PubMed] [Google Scholar]
- Bestmann S, Baudewig J, Siebner HR, Rothwell JC, Frahm J. Functional MRI of the immediate impact of transcranial magnetic stimulation on cortical and subcortical motor circuits. Eur J Neurosci. 2004;19:1950–1962. doi: 10.1111/j.1460-9568.2004.03277.x. [DOI] [PubMed] [Google Scholar]
- Bestmann S, Baudewig J, Siebner HR, Rothwell JC, Frahm J. BOLD MRI responses to repetitive TMS over human dorsal premotor cortex. Neuroimage. 2005;28:22–29. doi: 10.1016/j.neuroimage.2005.05.027. [DOI] [PubMed] [Google Scholar]
- Bestmann S, Oliviero A, Voss M, Dechent P, Lopez-Dolado E, Driver J, Baudewig J. Cortical correlates of TMS-induced phantom hand movements revealed with concurrent TMS-fMRI. Neuropsychologia. 2006;44:2959–2971. doi: 10.1016/j.neuropsychologia.2006.06.023. [DOI] [PubMed] [Google Scholar]
- Bestmann S, Ruff CC, Blankenburg F, Weiskopf N, Driver J, Rothwell JC. Mapping causal interregional influences with concurrent TMS-fMRI. Exp Brain Res. 2008;191:383–402. doi: 10.1007/s00221-008-1601-8. [DOI] [PubMed] [Google Scholar]
- Blankenburg F, Ruff CC, Bestmann S, Bjoertomt O, Eshel N, Josephs O, Weiskopf N, Driver J. Interhemispheric effect of parietal TMS on somatosensory response confirmed directly with concurrent TMS-fMRI. J Neurosci. 2008;28:13202–13208. doi: 10.1523/JNEUROSCI.3043-08.2008. [DOI] [PMC free article] [PubMed] [Google Scholar]
- Blankenburg F, Ruff CC, Bestmann S, Bjoertomt O, Josephs O, Deichmann R, Driver J. Studying the role of human parietal cortex in visuospatial attention with concurrent TMS-fMRI. Cereb Cortex. 2010a;20:2702–2711. doi: 10.1093/cercor/bhq015. [DOI] [PMC free article] [PubMed] [Google Scholar]
- Blankenburg F, Ruff CC, Bestmann S, Bjoertomt O, Josephs O, Deichmann R, Driver J. Studying the Role of Human Parietal Cortex in Visuospatial Attention with Concurrent TMS-fMRI. Cereb Cortex. 2010b doi: 10.1093/cercor/bhq015. [DOI] [PMC free article] [PubMed] [Google Scholar]
- Bodis-Wollner I, Bucher SF, Seelos KC. Cortical activation patterns during voluntary blinks and voluntary saccades. Neurology. 1999;53:1800–1805. doi: 10.1212/wnl.53.8.1800. [DOI] [PubMed] [Google Scholar]
- Bohning DE, Denslow S, Bohning PA, Walker JA, George MS. A TMS coil positioning/holding system for MR image-guided TMS interleaved with fMRI. Clin Neurophysiol. 2003a;114:2210–2219. doi: 10.1016/s1388-2457(03)00232-3. [DOI] [PubMed] [Google Scholar]
- Bohning DE, Pecheny AP, Epstein CM, Speer AM, Vincent DJ, Dannels W, George MS. Mapping transcranial magnetic stimulation (TMS) fields in vivo with MRI. Neuroreport. 1997;8:2535–2538. doi: 10.1097/00001756-199707280-00023. [DOI] [PubMed] [Google Scholar]
- Bohning DE, Shastri A, Lomarev MP, Lorberbaum JP, Nahas Z, George MS. BOLD-fMRI response vs. transcranial magnetic stimulation (TMS) pulse-train length: testing for linearity. J Magn Reson Imaging. 2003b;17:279–290. doi: 10.1002/jmri.10271. [DOI] [PubMed] [Google Scholar]
- Bohning DE, Shastri A, McConnell KA, Nahas Z, Lorberbaum JP, Roberts DR, Teneback C, Vincent DJ, George MS. A combined TMS/fMRI study of intensity-dependent TMS over motor cortex. Biol Psychiatry. 1999;45:385–394. doi: 10.1016/s0006-3223(98)00368-0. [DOI] [PubMed] [Google Scholar]
- Bohning DE, Shastri A, McGavin L, McConnell KA, Nahas Z, Lorberbaum JP, Roberts DR, George MS. Motor cortex brain activity induced by 1-Hz transcranial magnetic stimulation is similar in location and level to that for volitional movement. Invest Radiol. 2000a;35:676–683. doi: 10.1097/00004424-200011000-00005. [DOI] [PubMed] [Google Scholar]
- Bohning DE, Shastri A, Wassermann EM, Ziemann U, Lorberbaum JP, Nahas Z, Lomarev MP, George MS. BOLD-f MRI response to single-pulse transcranial magnetic stimulation (TMS) J Magn Reson Imaging. 2000b;11:569–574. doi: 10.1002/1522-2586(200006)11:6<569::aid-jmri1>3.0.co;2-3. [DOI] [PubMed] [Google Scholar]
- Buckner RL, Krienen FM, Castellanos A, Diaz JC, Yeo BT. The organization of the human cerebellum estimated by intrinsic functional connectivity. J Neurophysiol. 2011;106:2322–2345. doi: 10.1152/jn.00339.2011. [DOI] [PMC free article] [PubMed] [Google Scholar]
- Chen R, Classen J, Gerloff C, Celnik P, Wassermann EM, Hallett M, Cohen LG. Depression of motor cortex excitability by low-frequency transcranial magnetic stimulation. Neurology. 1997;48:1398–1403. doi: 10.1212/wnl.48.5.1398. [DOI] [PubMed] [Google Scholar]
- Cohen LG, Roth BJ, Nilsson J, Dang N, Panizza M, Bandinelli S, Friauf W, Hallett M. Effects of coil design on delivery of focal magnetic stimulation. Technical considerations. Electroencephalogr Clin Neurophysiol. 1990;75:350–357. doi: 10.1016/0013-4694(90)90113-x. [DOI] [PubMed] [Google Scholar]
- de Vries PM, de Jong BM, Bohning DE, Walker JA, George MS, Leenders KL. Changes in cerebral activations during movement execution and imagery after parietal cortex TMS interleaved with 3T MRI. Brain Res. 2009;1285:58–68. doi: 10.1016/j.brainres.2009.06.006. [DOI] [PubMed] [Google Scholar]
- Denslow S, Lomarev M, George MS, Bohning DE. Cortical and subcortical brain effects of transcranial magnetic stimulation (TMS)-induced movement: an interleaved TMS/functional magnetic resonance imaging study. Biol Psychiatry. 2005;57:752–760. doi: 10.1016/j.biopsych.2004.12.017. [DOI] [PubMed] [Google Scholar]
- Desmond JE, Gabrieli JD, Wagner AD, Ginier BL, Glover GH. Lobular patterns of cerebellar activation in verbal working-memory and finger-tapping tasks as revealed by functional MRI. J Neurosci. 1997;17:9675–9685. doi: 10.1523/JNEUROSCI.17-24-09675.1997. [DOI] [PMC free article] [PubMed] [Google Scholar]
- Diedrichsen J. A spatially unbiased atlas template of the human cerebellum. Neuroimage. 2006;33:127–138. doi: 10.1016/j.neuroimage.2006.05.056. [DOI] [PubMed] [Google Scholar]
- Driver J, Blankenburg F, Bestmann S, Vanduffel W, Ruff CC. Concurrent brain-stimulation and neuroimaging for studies of cognition. Trends Cogn Sci. 2009;13:319–327. doi: 10.1016/j.tics.2009.04.007. [DOI] [PubMed] [Google Scholar]
- Hallett M. Transcranial magnetic stimulation: a primer. Neuron. 2007;55:187–199. doi: 10.1016/j.neuron.2007.06.026. [DOI] [PubMed] [Google Scholar]
- Hanakawa T, Mima T, Matsumoto R, Abe M, Inouchi M, Urayama S, Anami K, Honda M, Fukuyama H. Stimulus-response profile during single-pulse transcranial magnetic stimulation to the primary motor cortex. Cereb Cortex. 2009;19:2605–2615. doi: 10.1093/cercor/bhp013. [DOI] [PubMed] [Google Scholar]
- Herwig U, Schonfeldt-Lecuona C, Wunderlich AP, von Tiesenhausen C, Thielscher A, Walter H, Spitzer M. The navigation of transcranial magnetic stimulation. Psychiatry Res. 2001;108:123–131. doi: 10.1016/s0925-4927(01)00121-4. [DOI] [PubMed] [Google Scholar]
- Kelly RM, Strick PL. Cerebellar loops with motor cortex and prefrontal cortex of a nonhuman primate. J Neurosci. 2003;23:8432–8444. doi: 10.1523/JNEUROSCI.23-23-08432.2003. [DOI] [PMC free article] [PubMed] [Google Scholar]
- Kemna LJ, Gembris D. Repetitive transcranial magnetic stimulation induces different responses in different cortical areas: a functional magnetic resonance study in humans. Neurosci Lett. 2003;336:85–88. doi: 10.1016/s0304-3940(02)01195-3. [DOI] [PubMed] [Google Scholar]
- Krienen FM, Buckner RL. Segregated fronto-cerebellar circuits revealed by intrinsic functional connectivity. Cereb Cortex. 2009;19:2485–2497. doi: 10.1093/cercor/bhp135. [DOI] [PMC free article] [PubMed] [Google Scholar]
- Leitao J, Thielscher A, Werner S, Pohmann R, Noppeney U. Effects of Parietal TMS on Visual and Auditory Processing at the Primary Cortical - A Concurrent TMS-fMRI Study. Cereb Cortex. 2012 doi: 10.1093/cercor/bhs078. [DOI] [PubMed] [Google Scholar]
- Lu J, Liu H, Zhang M, Wang D, Cao Y, Ma Q, Rong D, Wang X, Buckner RL, Li K. Focal pontine lesions provide evidence that intrinsic functional connectivity reflects polysynaptic anatomical pathways. J Neurosci. 2011;31:15065–15071. doi: 10.1523/JNEUROSCI.2364-11.2011. [DOI] [PMC free article] [PubMed] [Google Scholar]
- Maeda F, Keenan JP, Tormos JM, Topka H, Pascual-Leone A. Interindividual variability of the modulatory effects of repetitive transcranial magnetic stimulation on cortical excitability. Experimental Brain Research. 2000a;133:425–430. doi: 10.1007/s002210000432. [DOI] [PubMed] [Google Scholar]
- Maeda F, Keenan JP, Tormos JM, Topka H, Pascual-Leone A. Modulation of corticospinal excitability by repetitive transcranial magnetic stimulation. Clinical Neurophysiology. 2000b;111:800–805. doi: 10.1016/s1388-2457(99)00323-5. [DOI] [PubMed] [Google Scholar]
- Moisa M, Pohmann R, Ewald L, Thielscher A. New coil positioning method for interleaved transcranial magnetic stimulation (TMS)/functional MRI (fMRI) and its validation in a motor cortex study. J Magn Reson Imaging. 2009;29:189–197. doi: 10.1002/jmri.21611. [DOI] [PubMed] [Google Scholar]
- O'Reilly JX, Beckmann CF, Tomassini V, Ramnani N, Johansen-Berg H. Distinct and overlapping functional zones in the cerebellum defined by resting state functional connectivity. Cereb Cortex. 2010;20:953–965. doi: 10.1093/cercor/bhp157. [DOI] [PMC free article] [PubMed] [Google Scholar]
- Oakes TR, Johnstone T, Ores Walsh KS, Greischar LL, Alexander AL, Fox AS, Davidson RJ. Comparison of fMRI motion correction software tools. Neuroimage. 2005;28:529–543. doi: 10.1016/j.neuroimage.2005.05.058. [DOI] [PubMed] [Google Scholar]
- Pridmore S, Fernandes Filho JA, Nahas Z, Liberatos C, George MS. Motor threshold in transcranial magnetic stimulation: a comparison of a neurophysiological method and a visualization of movement method. J ECT. 1998;14:25–27. [PubMed] [Google Scholar]
- Ruff CC, Bestmann S, Blankenburg F, Bjoertomt O, Josephs O, Weiskopf N, Deichmann R, Driver J. Distinct causal influences of parietal versus frontal areas on human visual cortex: evidence from concurrent TMS-fMRI. Cereb Cortex. 2008;18:817–827. doi: 10.1093/cercor/bhm128. [DOI] [PMC free article] [PubMed] [Google Scholar]
- Ruff CC, Blankenburg F, Bjoertomt O, Bestmann S, Freeman E, Haynes JD, Rees G, Josephs O, Deichmann R, Driver J. Concurrent TMS-fMRI and psychophysics reveal frontal influences on human retinotopic visual cortex. Curr Biol. 2006;16:1479–1488. doi: 10.1016/j.cub.2006.06.057. [DOI] [PubMed] [Google Scholar]
- Ruff CC, Driver J, Bestmann S. Combining TMS and fMRI: from ‘virtual lesions’ to functional-network accounts of cognition. Cortex. 2009;45:1043–1049. doi: 10.1016/j.cortex.2008.10.012. [DOI] [PMC free article] [PubMed] [Google Scholar]
- Sack AT, Kohler A, Bestmann S, Linden DE, Dechent P, Goebel R, Baudewig J. Imaging the brain activity changes underlying impaired visuospatial judgments: simultaneous FMRI, TMS, and behavioral studies. Cereb Cortex. 2007;17:2841–2852. doi: 10.1093/cercor/bhm013. [DOI] [PubMed] [Google Scholar]
- Sakai K, Ugawa Y, Terao Y, Hanajima R, Furubayashi T, Kanazawa I. Preferential activation of different I waves by transcranial magnetic stimulation with a figure-of-eight-shaped coil. Exp Brain Res. 1997;113:24–32. doi: 10.1007/BF02454139. [DOI] [PubMed] [Google Scholar]
- Schmahmann JD. From movement to thought: anatomic substrates of the cerebellar contribution to cognitive processing. Hum Brain Mapp. 1996;4:174–198. doi: 10.1002/(SICI)1097-0193(1996)4:3<174::AID-HBM3>3.0.CO;2-0. [DOI] [PubMed] [Google Scholar]
- Schonfeldt-Lecuona C, Thielscher A, Freudenmann RW, Kron M, Spitzer M, Herwig U. Accuracy of stereotaxic positioning of transcranial magnetic stimulation. Brain Topogr. 2005;17:253–259. doi: 10.1007/s10548-005-6033-1. [DOI] [PubMed] [Google Scholar]
- Shastri A, George MS, Bohning DE. Performance of a system for interleaving transcranial magnetic stimulation with steady-state magnetic resonance imaging. Electroencephalogr Clin Neurophysiol Suppl. 1999;51:55–64. [PubMed] [Google Scholar]
- Shitara H, Shinozaki T, Takagishi K, Honda M, Hanakawa T. Time course and spatial distribution of fMRI signal changes during single-pulse transcranial magnetic stimulation to the primary motor cortex. Neuroimage. 2011;56:1469–1479. doi: 10.1016/j.neuroimage.2011.03.011. [DOI] [PubMed] [Google Scholar]
- Sparing R, Hesse MD, Fink GR. Neuronavigation for transcranial magnetic stimulation (TMS): where we are and where we are going. Cortex. 2010;46:118–120. doi: 10.1016/j.cortex.2009.02.018. [DOI] [PubMed] [Google Scholar]
- Talairach J, Tournoux P. Coplanar Stereotaxic Atlas of the Human Brain. Thieme Medical; New York: 1988. [Google Scholar]
- Werhahn KJ, Fong JK, Meyer BU, Priori A, Rothwell JC, Day BL, Thompson PD. The effect of magnetic coil orientation on the latency of surface EMG and single motor unit responses in the first dorsal interosseous muscle. Electroencephalogr Clin Neurophysiol. 1994;93:138–146. doi: 10.1016/0168-5597(94)90077-9. [DOI] [PubMed] [Google Scholar]
- Xu-Wilson M, Tian J, Shadmehr R, Zee DS. TMS perturbs saccade trajectories and unmasks an internal feedback controller for saccades. J Neurosci. 2011;31:11537–11546. doi: 10.1523/JNEUROSCI.1584-11.2011. [DOI] [PMC free article] [PubMed] [Google Scholar]