

Abstract
Ewing sarcoma is characterized by multiple deregulated pathways that mediate cell survival and proliferation. Heat shock protein 90 (HSP90) is a critical component of the multi‐chaperone complexes that regulate the disposition and activity of a large number of proteins involved in cell‐signaling systems. We tested the efficacy of PU‐H71, a novel HSP90 inhibitor in Ewing sarcoma cell lines, primary samples, benign mesenchymal stromal cells and hematopoietic stem cells. We performed cell cycle analysis, clonogenic assay, immunoblot analysis and reverse phase protein array in Ewing cell lines and in vivo experiments in NSG and nude mice using the A673 cell line. We noted a significant therapeutic window in the activity of PU‐H71 against Ewing cell lines and benign cells. PU‐H71 treatment resulted in G2/M phase arrest. Exposure to PU‐H71 resulted in depletion of critical proteins including AKT, pERK, RAF‐1, c‐MYC, c‐KIT, IGF1R, hTERT and EWS‐FLI1 in Ewing cell lines. Our results indicated that Ewing sarcoma tumor growth and the metastatic burden were significantly reduced in the mice injected with PU‐H71 compared to the control mice. We also investigated the effects of bortezomib, a proteasome inhibitor, alone and in combination with PU‐H71 in Ewing sarcoma. Combination index (CI)‐Fa plots and normalized isobolograms indicated synergism between PU‐H71 and bortezomib. Ewing sarcoma xenografts were significantly inhibited when mice were treated with the combination compared to vehicle or either drug alone. This provides a strong rationale for clinical evaluation of PU‐H71 alone and in combination with bortezomib in Ewing sarcoma.
Keywords: PU‐H71, HSP90 inhibitor, Bortezomib, Ewing sarcoma
Highlights
PU‐H71, a novel HSP90 inhibitor shows activity in Ewing sarcoma models.
PU‐H71 treatment results in depletion of critical oncoproteins in Ewing sarcoma.
PU‐H71 and bortezomib combination leads to accumulation of ubiquitinated proteins.
Combination of PU‐H71 and bortezomib exhibits synergism in Ewing sarcoma models.
1. Introduction
Ewing sarcoma is an aggressive malignancy that affects children and young adults. Five‐year survival rates for Ewing sarcoma have remained static for more than two decades at 54% for adolescents 15–19 years of age and 74% for patients younger than 15 years (Smith et al., 2010). Patients presenting with metastatic disease have a 6‐year event‐free survival of 28% and overall survival of 30% (Miser et al., 2007). Patients who relapse have extremely poor survival rate (around 25%) with existing therapies (Grier et al., 2003). The critical barrier for lack of progress in outcomes was poor understanding of its biology and a lack of targeted therapies. Proteomic analysis and micro‐array data from other groups suggest that Ewing sarcoma is characterized by multiple deregulated pathways that mediate cell survival and proliferation (Erkizan et al., 2010; Ohali et al., 2004). Monoclonal antibodies to IGF1R have shown promise in a small group of patients with Ewing sarcoma (Pappo et al., 2011). However, tumor cells were able to switch from IGF1R dependency to insulin receptor A (IR‐A) mediated activation of AKT/ERK leading to sustained proliferation (Garofalo et al., 2011). In a recent study, proteomic analysis revealed that heat shock protein 90 (HSP90) was overexpressed in IGF1R and KIT inhibitor resistant Ewing sarcoma cell lines, and treatment with HSP90 inhibitor, 17‐AAG restored the sensitivity (Martins et al., 2008). Heat shock proteins serve as molecular chaperones responsible for the assembly and regulation of many cell‐signaling systems. Their ability to affect multiple oncogenic pathways simultaneously is a unique and therapeutically attractive feature of these compounds. Malignant cells are exposed to external stressors such as hypoxia, nutrient deprivation and chemotherapeutic agents and internal stresses such as the accumulation of mutated and incorrectly folded proteins, making them dependent on HSPs for survival. HSP90 in particular, is a critical component of the multi‐chaperone complexes that regulate the disposition and activity of a large number of cellular kinases, transcription factors, and other molecules (Whitesell and Lindquist, 2005). HSP90 also protects less stable proteins produced by DNA mutations such as mutated p53 (Blagosklonny et al., 1996) and fusion proteins like BCR‐ABL (Nimmanapalli et al., 2001).
First generation HSP90 inhibitors‐Geldanamycin, 17AAG and 17DMAG have shown cytotoxic and cytostatic anticancer effects in various tumor types in cell culture and animal models. We investigated the efficacy of PU‐H71, a novel purine scaffold HSP90 inhibitor developed at Memorial Sloan‐Kettering Cancer Center (MSKCC) in inducing growth inhibition of Ewing sarcoma cells in vitro and tumor formation in vivo. We also looked at the toxicity of PU‐H71 in benign mesenchymal stem cells. PU‐H71 was shown to be effective in triple‐negative breast cancer models (Caldas‐Lopes et al., 2009) and Bcl6 dependent B‐cell lymphomas (Cerchietti et al., 2009). A phase I clinical trial of PU‐H71 is currently underway at MSKCC in adult patients with advanced malignancies. Our work focuses on many of the deregulated pathway proteins in Ewing sarcoma, including IGF1R, AKT, ERK, MYC, hTERT and the master regulator EWS‐FLI1, when Ewing sarcoma cells are treated with varying concentrations of PU‐H71. Misfolded proteins resulting from HSP90 inhibition undergo degradation via the ubiquitin‐proteasome pathway. Bortezomib is a proteasome inhibitor currently undergoing clinical trails for several diseases as a single agent or in combination with other drugs. In a recent study (Roue et al., 2011), a combination of bortezomib and HSP90 inhibitor was able to overcome intrinsic and acquired resistance to the proteasome inhibitor in mantle cell lymphoma cultures and tumors. We hypothesized that a combination treatment of HSP90 and proteasome pathways might be synergistic and could prevent resistance to both agents in Ewing sarcoma. In this study, we looked at the effect of simultaneous inhibition of HSP90 and proteasome pathways on cell proliferation, tumor formation and metastatic burden in mice. We performed chemical precipitation using agarose beads with immobilized PU‐H71 to investigate novel client proteins of the HSP90 chaperone complex in Ewing sarcoma. We also discovered that the EWS‐FLI1 fusion protein is bound to the HSP90 chaperone complex and gets degraded in the setting of HSP90 inhibition.
2. Materials and methods
2.1. Cells lines and patient samples
Ewing sarcoma cell lines A673 and SK‐PN‐DW were purchased from American Type Culture Collection (ATCC, Manassas, VA). Dr. Marc Ladanyi (Department of Pathology, MSKCC) kindly provided other sarcoma cell lines, including TC71, CHP100, RD‐ES, CADO‐ES‐1, SK‐ES‐1 and SK‐N‐MC. STR testing done by Genetic Resources Core Facility at Johns Hopkins University, Baltimore, Maryland, authenticated all cell lines. These Ewing sarcoma cell lines were characterized and published previously (De Vito et al., 2012; Lin et al., 1999; Martínez‐Ramírez et al., 2003; Ottaviano et al., 2010; Sohn et al., 2010). The Monoclonal Antibody Core Facility at MSKCC tested all cell lines for mycoplasma contamination. Cells were maintained in a 37 °C, 5% CO2, fully humidified incubator. A673, SK‐PN‐DW, TC71, CHP100 and SK‐N‐MC were grown in Dulbecco's Modified Eagle's Medium and supplemented with 10% Fetal Bovine Serum (FBS) (Atlas Biologicals, Fort Collins, CO), l‐glutamate and antibiotics penicillin/streptomycin (Gibco, Grand Island, NY). SK‐ES‐1, CADO‐ES and RD‐ES were cultured in RPMI‐1640 supplemented with 15% FBS, l‐glutamate and antibiotics penicillin/streptomycin. In all experiments, cells were plated in 6, 12 or 96‐well plates 12 h (h) before treatment. Benign cells including human bone marrow mesenchymal stromal cells (HS‐5) (ATCC), sarcoma derived benign mesenchymal stem cells (SDBMSC) as described earlier (Morozov et al., 2010) and human brain vascular pericytes (HBVP) (ATCC) were used to study toxicity in stromal cells. All tissue culture media were prepared by the Media preparation core facility at MSKCC. De‐identified patient tumor tissues were obtained in accordance with and approval from the MSKCC Institutional Review Board (IRB). Written consent was obtained from the patients prior to sample collection. These patients had been treated with chemotherapy including cyclophosphamide, vincristine and doxorubicin prior to tumor resection. We obtained single cell suspensions by physical disruption and digestion of tissues using collagenase type IV (Gibco, Grand Island, NY). Cells were cultured in medium containing 90% DMEM and 10% FBS supplemented with antibiotics, l‐glutamine and HEPES for 72 h. Colonies derived from tumor cells were scraped and passaged again. PU‐H71 was synthesized at Dr. Gabriela Chiosis' laboratory at MSKCC as previously reported (He et al., 2006) for in vitro and in vivo experiments. Bortezomib was purchased from Millennium Pharmaceuticals, Cambridge, MA.
2.2. Assessment of cell proliferation
AlamarBlue® assay (Invitrogen, Carlsbad, CA, USA) was performed to evaluate anti‐proliferative activity of the drugs in cell lines and primary cells. Cells were plated in 96‐well plates (5 × 10⁵ cells/well in 200 μL of medium). After 12 h, drug (PU‐H71, bortezomib or combination) was added to each well at a particular concentration and incubated for 72 h. At the end of the incubation period, 20 μL of stock solution (0.312 mg/mL) of the Alamar Blue was added to each well. Absorbance was measured using the Synergy H1 hybrid multi‐mode microplate reader (BioTek, USA). The drug effect was quantified as the percentage of control absorbance at 540 nm and 585 nm. Optical density was determined for 3 replicates per treatment condition and cell proliferation in drug‐treated cells was normalized to their respective controls. All experiments were performed in triplicate.
2.3. Flow cytometry
Apoptosis and cell viability were determined using Annexin V‐APC (BD Pharmingen, San Diego, CA) staining and 7‐AAD (BD Pharmingen, San Diego, CA) staining according to the instructions by the manufacturer and as previously published (Schmid et al., 1992; van Engeland et al., 1996). Cell cycle fractions were determined by propidium iodide nuclear staining. Briefly, cells were harvested, washed in PBS, fixed with 70% ethanol, and incubated with propidium iodide/RNase buffer (BD Biosciences, San Diego, CA) for 15 min at room temperature. Data were collected on BD LSR Fortessa fluorescence‐activated cell analyzer using BD FACS Diva software and analyzed using FlowJo version 9.6 software (Tree Star, Inc. Ashland, OR). Cell cycle analysis was done by applying the Dean/Jett/Fox cell cycle model using FlowJo software.
2.4. Clonogenic assay
Clonogenicity of Ewing sarcoma cell lines was tested according to the protocol described by Franken et al. (2006). Plating efficiency (number of colonies/number of cells seeded ×100) for A673, SK‐PN‐DW, CHP100 and TC71 cell lines was established initially by plating 250–2000 cells per well in 12 well plates. Cells were treated with different concentrations of PU‐H71 ranging from 0.125–2 μM for 48 h. Viability was checked with trypan blue and 500 viable cells were plated in each well in triplicate. The plates were kept in the incubator for 5–7 days to allow time for at least 6 cell divisions. Colonies were fixed and stained with a mixture of 6% glutaraldehyde and 0.5% crystal violet for 1 h. The assay was repeated three times. Colonies that have at least 50 cells were counted under the microscope for each treatment condition.
2.5. Chemical precipitation
To investigate the interaction of small‐molecule Hsp90 inhibitors with tumor HSP90 complexes, we used agarose beads (80ul) that were covalently attached to PU‐H71 or an HSP90‐inactive chemical (ethanolamine) as previously described (Moulick et al., 2011). Bead conjugates were incubated overnight at 4 °C with cellular lysates dissolved in 20 mM Tris–HCl, pH 7.4, 25 mM NaCl, 20 mM Na2MoO4, 0.1% Nonidet P‐40, 10 μg/mL aprotinin, and 10 μg/mL leupeptin, then washed five times with the above lysis buffer. For Western blot analyses, proteins were eluted with SDS‐containing buffer, separated by gel electrophoresis and analyzed by immunoblotting.
2.6. Immunoblot analyses
Protein concentrations were determined using the BCA kit (Pierce Biotechnology, Rockford, IL) according to the manufacturer's instructions. Protein lysates (20–100 μg) were electrophoretically resolved by SDS/PAGE, transferred to nitrocellulose membrane, and probed with the indicated primary antibodies: Anti‐HSP90 from mouse (1:500, SPA‐830; Stressgen), anti‐HSP70 from mouse (1:500, SPA‐810; Stressgen Biotechnologies, Victoria, Canada), anti‐AKT from rabbit (1:500, 9272; Cell Signaling, Danvers, MA), anti‐phospho‐AKT (Ser473) from rabbit (1:500, 9271S; Cell Signaling), anti‐RAF‐1 from rabbit (1:300, sc‐133; Santa Cruz Biotechnology, Dallas, TX), anti‐PARP (p85 fragment) from rabbit (1:250, G7341; Promega), anti‐BcL‐xL from rabbit (1:1,000, 2762; Cell Signaling), anti‐IGF1R from rabbit (1:500, Cell Signaling), anti‐CD117 from rabbit (1:500, Cell Signaling), anti‐EWS‐FLI1 from rabbit (1:500, Santa Cruz Biotechnology), anti‐MAPK42/44 from rabbit (1:500, Cell Signaling), anti‐caspase 3 from rabbit (1:500, 9662; Cell Signaling), anti‐caspase 7 from rabbit (1:500, 9492; Cell Signaling), anti‐cleaved caspase 3 from rabbit (1:500, 9661; Cell Signaling), anti‐cleaved caspase 7 from rabbit (1:500, 9491; Cell Signaling), anti‐ubiquitin antibody from mouse (1:500, sc‐8017, Santa Cruz Biotechnology), anti‐Src from mouse (1:500, clone GD11, 05‐184, Millipore) and anti‐Gsk 3β [pY216] from rabbit (1:500, 2932, Invitrogen). Membranes were then incubated with a 1:5000 dilution of a peroxidase conjugated corresponding secondary antibody. Equal loading of the protein samples was confirmed by parallel western blots for β‐actin (1:5000, ab822750; Abcam). Detection was performed using the ECL‐Enhanced Chemiluminescence Detection System (GE Healthcare Biosciences, Pittsburgh, PA) according to the manufacturer's instructions. Blots were visualized by autoradiography.
2.7. Densitometry
Quantitative densitometric analysis of western blot bands in was done using Image J 1.47v software (NIH, USA). The adjusted relative densities were calculated relative to the expression of β‐actin.
2.8. Reverse phase protein array (RPPA)
Cell lysates from A673 and SK‐PN‐DW were prepared in the Moore lab at MSKCC and shipped to the RPPA core facility at MD Anderson Cancer Center, Houston, TX, where RPPA was performed as described in their earlier work (Hennessy et al., 2010). A list of the antibodies used for this technique is available at the following website: http://www.mdanderson.org/education‐and‐research/resources‐for‐professionals/scientific‐resources/core‐facilities‐and‐services/functional‐proteomics‐rppa‐core/index.html.
2.9. Proteasome activity assay
The Chemicon 20S proteasome activity assay kit (Millipore, MA) was optimized by serial dilution of positive control from 1:4 to 1:256 (supplementary Figure 2A). Fluorescence was recorded using 380/460 nm filter set in Synergy H1 hybrid multi‐mode microplate reader (BioTek, USA). Lactacystin, a potent and specific proteasome inhibitor was used to validate the assay (Supplementary Figure 2b). Cell lysates from A673 cells, untreated and treated with PU‐H71, bortezomib and their combination for 6 h and 24 h were tested for proteasome activity. Experiments were conducted in triplicate.
2.10. Pharmacokinetic studies
Four to five‐week‐old nude mice (Jackson lab, Bar Harbor, ME) were used following IACUC guidelines. Tumors were induced using 106 A673 cells injected subcutaneously (s.q) into the right flank. The tumors were measured every 2–3 d with a caliper, and the diameters were recorded. Tumor volume was calculated by the formula a 2 b/2 where ‘a’ is the smallest and ‘b’ is the largest diameter. When the tumors reached 100 mm3, we injected one dose of PU‐H71 s.q. Mice were sacrificed at 12, 24, 48, 72 and 96 h after injection and the tumors were collected to measure the accumulation of PU‐H71 at the respective time points. Tumor concentration of PU‐H71 was determined as previously reported (Marubayashi et al., 2010).
2.11. Assessment of tumor progression in A673 in vivo model
All mouse experiments were done following the IACUC guidelines at the animal core facility at MSKCC. We performed 2 separate mouse experiments; one in NOD/SCID IL2R gamma null (NSG) mice bred at the MSKCC animal core facility and another in nude mice (Jackson Lab, Bar Harbor, ME) using different cell doses and initiation of treatment. We established a mouse model in NSG mice to study tumor initiation in a minimal residual disease setting by doing limiting dilution of A673 cells transduced with GFP Luciferase. A minimum of 100 cells formed tumors that could be seen on imaging at 3wk and were palpable at 5wk after s.q. injection in a reliable fashion. Assessment of metastatic burden was made by imaging various organs including liver, spleen, lungs, kidneys, intestines and heart within 5–10 min after sacrificing the mice. Luminescence (flux) was measured using Xenogen IVIS Lumina II imaging system (Calipers Life Sciences, Hopkinton, MA) and analyzed with Living Image version 4.3.1 software (Calipers Life Sciences, Hopkinton, MA).
NSG mice: A673 cells transduced with GFP luciferase in mid‐log growth phase were injected s.q. in the flank in 4 to 5‐wk‐old NSG mice. A dose of 105 cells in 0.2 mL 1:1 cellular medium, Matrigel Matrix (BD Bioscience, Bedford, MA), was used to induce tumors. PU‐H71 was given as a 75 mg/kg/dose three times a week by intraperitoneal (i.p.) injection. Mice were randomized to 3 groups, control group (n = 3, treated with vehicle from day 1), early treatment group (n = 3, treated with PU‐H71 from day 1) and late treatment group (n = 3, treated with PU‐H71 from day 7 when they showed tumor on imaging). Luminescence of the tumors was measured weekly until week 5 when the control mice had tumors that exceeded 1000 mm3. At the end of the experiment, mice were sacrificed by anesthesia overdosing and tumors were collected for histopathology analysis. Size and weight of the tumors were measured. Tissues were sampled within 15 min after the mice were sacrificed, formalin fixed (12 h) and paraffin embedded. De‐paraffinized tissue sections were submitted to the pathology core facility at MSKCC for immunohistochemical stains according to established protocol on an automated Ventana XT platform. The primary antibodies used were IGF‐1R (Rabbit mAb, Ventana, Tucson, AZ). Ki‐67 (mAb clone Mib‐1, DAKO, Carpinteria, CA) used at dilution 1:100, CD31 (mAb clone JC/70A, DAKO, Carpinteria, CA) used at a dilution 1:700, and CD99 (mAb clone O13, Signet Laboratories, Dedham, MA) used at a dilution of 1:100. We tested in vivo efficacy of a combination of PU‐H71 and bortezomib, in 4 groups of NSG mice (n = 3 per group) to receive vehicle, PU‐H71, bortezomib or a combination of PU‐H71 and bortezomib. PU‐H71 was given at a dose of 75 mg/kg intraperitoneally (I.P) three times a week for 4 weeks and bortezomib was given at a dose of 0.8 mg/kg i.v. twice a week for 4 weeks.
Nude mice: We performed an extended in vivo study in nude mice (n = 12) using 106 cells in 0.2 ml 1:1 cellular medium, Matrigel Matrix, injected s.q. After the tumors reached 50–100 mm3 volume, they were randomized to receive vehicle or PU‐H71 treatment at a dose of 75 mg/kg i.p. three times a week for 4 weeks. Treatment was started when the tumors were between 50 and 100 mm3 since in our earlier studies we observed significant metastasis with 200 mm3 tumors (data not shown). The tumors were measured twice a week with a caliper, and the diameters were recorded. Luminescence of the tumors was measured weekly.
2.12. Statistical analysis
Data are presented as mean ± S.E.M. of at least three independent experiments done in triplicate. The comparison of means between treated and control mice was performed using two‐tailed T‐test or ANOVA (for more than two groups) as implemented in GraphPad Prism (version 4; GraphPad Software). Comparison of medians between the groups was done using the Mann–Whitney test. Graphpad Prism software was used to plot dose–effect curves and determine the drug concentration that inhibited the growth of cell lines by 50% compared to the control (IC50). The expression of proteins between untreated and treated samples was checked using the Fisher's exact test. RPPA raw data was analyzed and heat map was generated using RStudio software (Boston, MA) (RCoreTeam, n.d.). A p‐value of 0.05 or less was considered significant. Combination index (CI) values, as calculated by CompuSyn software (Chou and Martin, 2007), were used to evaluate the interaction between PU‐H71 and Bortezomib. The Chou‐Talalay method was used to quantify synergism (CI < 1), additive effect (CI = 1) and antagonism (CI > 1) of various drug combinations (Chou, 2010).
3. Results
3.1. PU‐H71 inhibits proliferation and induces cell death in Ewing sarcoma cell lines and cultures derived from patient samples
We used varying concentrations of PU‐H71 (from 2 μM to 0.015 μM) on 8 Ewing sarcoma cell lines and 6 patient samples grown in 96 well plates and tested proliferation using alamar blue assay. Based on the log dose–response curve we identified the dose of PU‐H71 that causes 50% growth inhibition compared to the control (IC50) as shown in Figure 1A. The mean IC50 of PU‐H71 in Ewing sarcoma cell lines is 0.237 μM. We also looked at the anti‐proliferative ability in benign cells (HS5, SDBMSC, HBVP) as a measure of toxicity (Figure 1A). Respective IC50 values in benign cells are shown in Figure 1A. Apoptosis and cell viability were checked using Annexin V FITC and PI in a dose dependent and time dependent manner using 0.1, 0.2, 1.0 and 2.0 μM of PU‐H71 at 24 and 48 h in the A673 cell line as shown in Figure 1C. Maximal cell death was noted at a concentration of 1.0 μM of PU‐H71 after 48 h exposure (Figure 1C). PU‐H71 also demonstrated significant growth inhibition in early cultures derived from patient samples (Figure 1A). We investigated the mechanisms of cell death in Ewing sarcoma cell lines with PU‐H71 exposure. We noted increased expression of caspase 3 and caspase 7 with escalating doses of PU‐H71 (Figure 1B).
Figure 1.
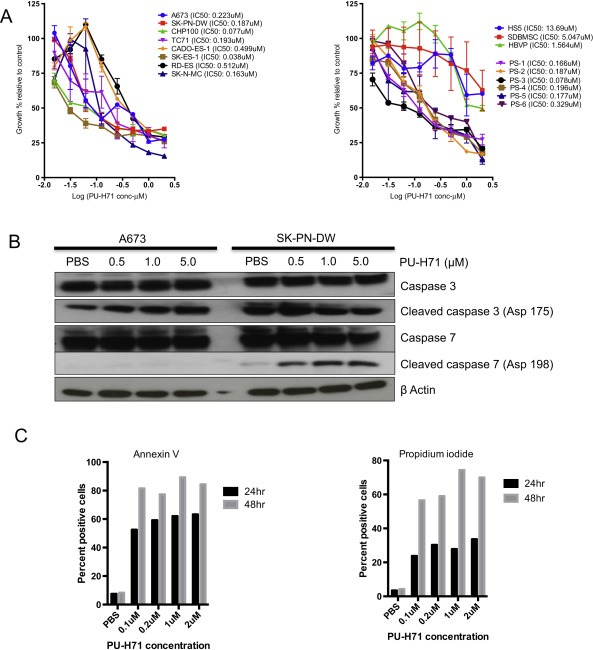
PU‐H71 induces cell death and inhibits proliferation of Ewing sarcoma cells in vitro. A, Alamar blue proliferation assay of cell lines‐A673, SK‐PN‐DW, SK‐N‐MC, SK‐ES‐1, RD‐ES, CADO‐ES‐1, CHP100 and TC71 treated with varying concentrations of PU‐H71 (from 2 μM to 0.015 μM) for 72 h (n = 3 experiments, each in triplicate). Alamar blue assay of early cultures derived from patient samples (PS‐1 to 6) and benign mesenchymal stem cells (HS5, SDBMSC and HBVP) treated with the indicated concentrations of PU‐H71. B, Western blot showing cleaved caspase 3 and caspase 7 in A673 and SK‐PN‐DW on treatment with increasing concentrations of PUH71. C, Percentage of apoptotic (Annexin V+) and necrotic (propidium iodide (PI)+) A673 cells treated with 0.1, 0.2, 1.0 and 2.0 μM concentrations of PU‐H71 at 24 and 48 h (experiment repeated twice). The kinetics of cellular metabolism as measured by alamar blue assay yields a different curve from the apoptosis and cell death assays because of the different time points when the results were obtained and the nature of the assay.
3.2. PU‐H71 induces cell cycle arrest in G2 phase
We studied the effects of PU‐H71 on the cell cycle of A673 cells and found a dose‐dependent accumulation of cells in the G2/M phase with a concomitant loss of S phase (Figure 2A). A similar effect was seen at 24 h and 48 h of exposure to PU‐H71.
Figure 2.
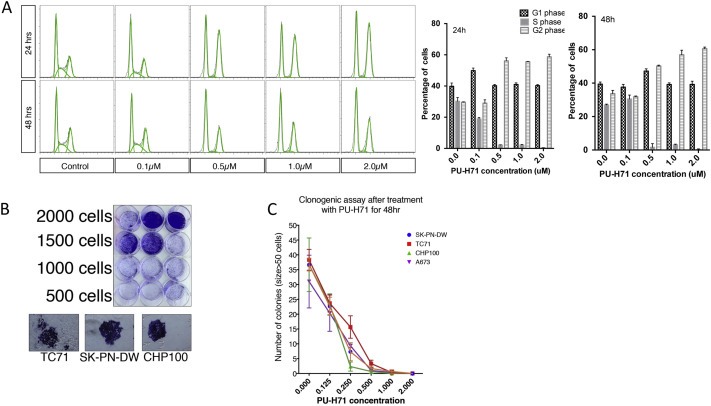
PU‐H71 induces cell cycle arrest in G2 phase in A673 cells and inhibits clonogenicity in multiple cell lines. A. Flow cytometric analysis of A673 cell line using PI staining at 24 and 48 h at indicated concentrations of PU‐H71. Also shown are the percentages of A673 cells in G1, S and G2 phases at different concentrations of PU‐H71 (experiment repeated twice). B, Colony formation was optimized using different concentration of cells in 12 well plates. Appearance of colonies (size >50 cells) that were fixed and stained with crystal violet is shown. D, Number of colonies formed for each of the cell lines‐A673, SK‐PN‐DW, CHP100 and TC71 after treatment with varying concentrations of PU‐H71 for 48 h (n = 3 experiments, each in triplicate).
3.3. PU‐H71 significantly decreases the clonogenicity of Ewing sarcoma cell lines
We optimized the clonogenic assay by testing the plating efficiency of A673, SK‐PN‐DW, CHP100 and TC71 cell lines by seeding a varying number of cells (from 250 to 2000 cells) in each 12 well plate (Figure 2B). Plating efficiency (number of colonies/number of cells seeded × 100) for the above cell lines is between 5 and 20%. We counted the number of colonies that are bigger than 50 cells. The colonies were dramatically reduced in number when cells were exposed to >0.5 μM of PU‐H71 for 48 h (Figure 2C).
3.4. PU‐H71 induces degradation of HSP90 client proteins that are essential for Ewing sarcoma cell survival and proliferation
As expected the expression of HSP90 had varied response after treatment with PU‐H71. There was a minimal change in HSP90 in SK‐PN‐DW cell line but a marked increase in A673 suggesting a stress response. However the expression of co‐chaperone protein, HSP70 was markedly increased in both cell lines. We also observed an increase in the pro‐apoptotic protein BAD and a decrease in anti‐apoptotic protein BCL‐XL as seen in Figure 3A. We looked at the expression of proteins involved in key signaling pathways in Ewing sarcoma and noted that with increasing concentration of PU‐H71, there was a decrease in expression of AKT, MYC, pERK, RAF‐1, IGF1R, PDGFRA and c‐KIT (Figure 3B). We extracted proteins in the HSP90 chaperone complex using chemical precipitation with agarose beads bound to PU‐H71. We noted that IGF1R, EWS‐FLI1 and hTERT are client proteins of HSP90 (Figure 3C) and can be targeted using PU‐H71. We saw a decrease in EWS‐FLI1 fusion protein in both A673 and SK‐PN‐DW cell lines (Figure 3B). We also noted a decrease in IGF1R and hTERT (Figure 3D) when A673 was treated with increasing concentration of PU‐H71. RPPA analysis showed that pSRC, pPDK1, GSK3, B‐RAF, C‐RAF, c‐KIT, AKT and pAKT are decreased after treatment with 1 μM PU‐H71 in both A673 and SK‐PN‐DW cell lines (Supplementary Figure 1). We also noted a decrease in the expression of SRC in A673 and SK‐PN‐DW cell lines and GSK‐3β in SK‐PN‐DW on immunoblot analyses (Figure 3B).
Figure 3.
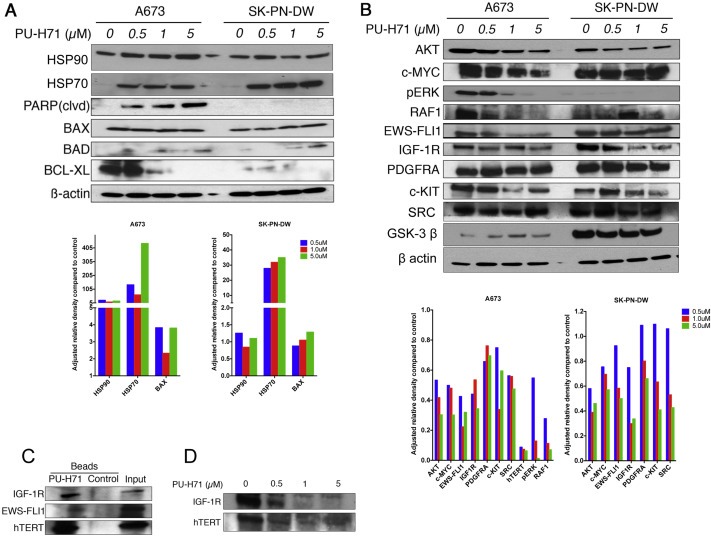
PU‐H71 induces production of co‐chaperone protein, HSP70. Pro‐apoptotic proteins are increased and anti apoptotic proteins are decreased in Ewing cell lines treated with PU‐H71. A, immunoblot analysis of the indicated proteins in A673 and SK‐PN‐DW cell lines treated with 0, 0.5, 1, 5 μM concentrations of PU‐H71 for 24 h. B, immunoblot analysis of AKT, MYC, pERK, RAF‐1, EWS‐FLI1, IGF1R, PDGFRA, c‐KIT, SRC, GSK‐3β and β actin proteins in A673 and SK‐PN‐DW cell lines treated with the indicated concentrations of PU‐H71 for 24 h. Adjusted relative densities of the above proteins are shown as bar graphs below the immunoblots. C, immunoblot analyses of A673 cell lysate that was pulled down by chemical precipitation using PU‐H71 beads and control beads. IGF1R, EWS‐FLI1 and hTERT antibodies were used to locate their presence in the HSP90 chaperone complex that was pulled down. D, IGF1R and hTERT were depleted with increasing concentrations of PU‐H71 in the A673 cell line.
3.5. Xenograft model using A673 cell line transduced with GFP luciferase
NSG mice were injected with 1, 10, 102, 103, 104 and 105 cells per site (1–4 sites per mouse‐right anterior, right posterior, left anterior and left posterior) and were monitored for tumor formation by luciferase imaging. We noted that a minimum of 100 cells could form tumors reliably and we observed that 105 cells form bioimageable tumors in 7 days and palpable tumors in 10–14 days. We used 105 cells for in vivo testing in NSG mice for tumor initiation with large tumors forming in 5–6 weeks at which point the mice were sacrificed as per our animal facility guidelines. In a separate experiment, we also tested tumor formation in nude mice using 105, 106 and 5 × 10⁶ cells and used 106 cells for in vivo experiments in this strain of mice to study inhibition of established tumors. We created a model to study metastatic burden by measuring the luminescence of organs – lungs, liver, spleen, kidneys, heart and intestines within 5–10 min of sacrificing the mice (Figure 5D). The cumulative fluorescence intensity of all organs was calculated as a measure of metastatic burden.
Figure 5.
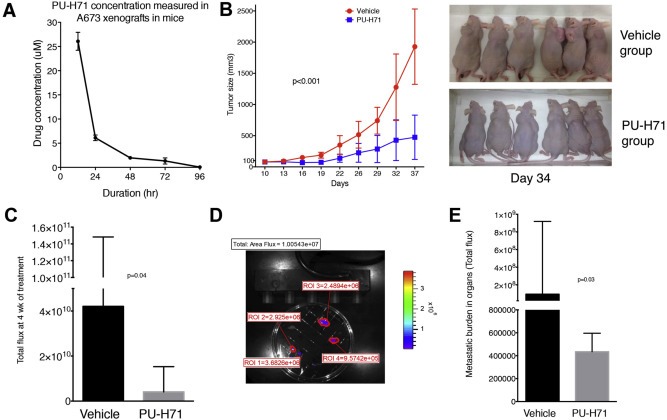
PU‐H71 inhibits tumor growth and decreases metastatic burden in nude mice. A, Nude mice (n = 10) bearing A673 xenografts of approximately 100 mm3 size were given one dose of PU‐H71 at 75 mg/kg i.p. The concentration of the drug in the tumor tissue was determined by analyzing the tumors at 12, 24, 48, 72 and 96 h. B, PU‐H71 or vehicle was administered i.p. (n = 6 per group) starting at day 10 when the tumors were 50–100 mm3 size and the size of the tumors was measured twice a week. Representative image at day 34 is shown. C, Median and interquartile range of the total flux of the luminescent tumors measured at 4 wk. D, Metastatic model showing the tumor burden in various organs calculated with Living Image software. E, Median and interquartile range of flux indicating metastatic burden in both groups.
3.6. PU‐H71 causes a significant delay in the progression of A673 tumors and leads to decreased vascularity in the xenografts in NSG mice
We injected 105 A673 cells expressing GFP luciferase subcutaneously in 9 NSG mice. Subsequently they were randomized into 3 groups – control group (n = 3), early treatment group (n = 3) and late treatment group (n = 3). The control group was treated with vehicle (PBS), the early treatment group received intraperitoneal (i.p.) injections of PU‐H71 starting from day 1 as described in the methods section, while the late treatment group received i.p. injections from day 7 at which time they showed tumor luminescence on imaging and had palpable tumors. The luminescence of the tumors and the weight of the tumors were lower in early and late treatment groups compared to control group and lower in the early treatment group compared to the late treatment group (Figure 4A–C). On IHC analysis of tumors, we found a significant decrease in the expression of CD31 in the late treatment group compared to control (P = 0.006, Figure 4D). We did not find a difference in the expression of Ki‐67, IGF1R and CD99 between the two groups (data not shown).
Figure 4.
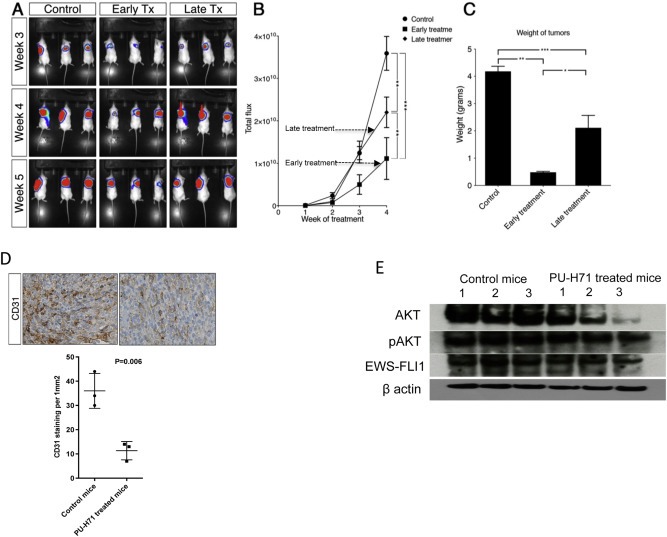
PU‐H71 delays initiation of tumors in the A673 xenograft model in NSG mice. A, mice injected s.q. with A673 cells expressing GFP luciferase were randomized to control, early treatment and late treatment groups and were imaged weekly. B, total flux of tumors was measured from week 2 to week 5 for control, early treatment and late treatment groups. C, The weights of tumors in the three groups at week 5. Significance is shown by p‐value <0.05 (*), <0.005 (**) and <0.0005 (***). D, Representative images of immunohistochemical staining of control and PU‐H71 treated mice tumors for CD31. Mean number of microvessels that stained positive for CD31 were counted at 200× in control and PU‐H71 treated mice tumors. E, immunoblot analysis of AKT, pAKT, EWS‐FLI1 and β actin proteins in cell lysates from tumors extracted from control mice and PU‐H71 treated mice.
3.7. PU‐H71 inhibits A673 tumor growth in vivo and decreases metastatic burden in nude mice
We tested the accumulation of PU‐H71 in established tumors in nude mice and noted that 48 h dosing will result in 5–10 times IC50 concentration at nadir (Figure 5A). We noted a significant decrease in the tumor size between control and PU‐H71 treated mice (n = 6 per group) (Figure 5B). There was a significant decrease in the medians of total flux of tumors (p = 0.04) and the metastatic burden (p = 0.03) in the control and treatment groups at week 4 (Figure 5C and E).
3.8. A combination of PU‐H71 and bortezomib is synergistic against Ewing sarcoma cell lines in vitro and in vivo
Bortezomib is effective as a single agent in vitro against multiple Ewing sarcoma cell lines as shown in Figure 6A. When PU‐H71 was added at an IC50 concentration to varying doses of bortezomib and vice versa, we noted synergism in the inhibition of cell proliferation using the Chou‐Talalay method (Figure 6B). We also noted a greater expression of PARP p85 and cleaved caspase 7 in A673, CHP100, TC71 and SK‐PN‐DW when both drugs were used in combination compared to either drugs alone or vehicle (Figure 6C). In vivo study in NSG mice showed that the size, weight and luminescence of the tumors were lower in the combination group compared to single drug or vehicle (Figure 7A–C). The metastatic burden was significantly less in all the treatment groups compared to the control group (p‐values shown in Figure 7D).
Figure 6.
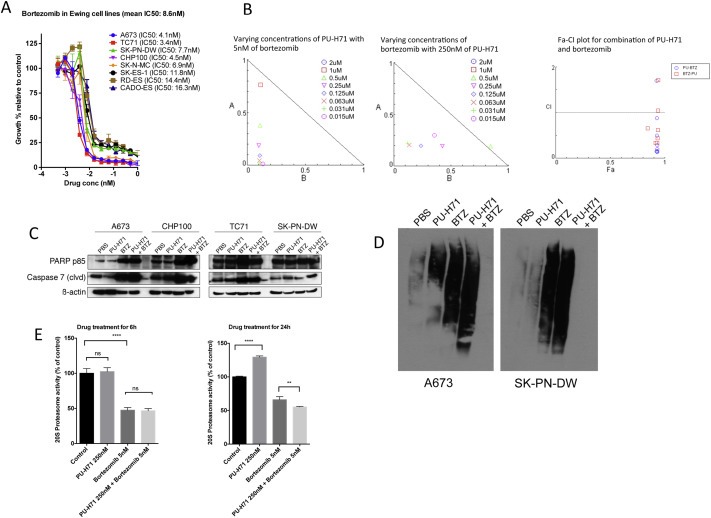
Combination of PU‐H71 and bortezomib exhibits synergism against Ewing sarcoma cells in vitro. A, Alamar blue proliferation assay of cell lines treated with varying concentrations of bortezomib (from 1 μM to 0.00048 μM) for 72 h (n = 3 experiments, each in triplicate). B, Normalized isobologram created with Compusyn software for combination of varying concentrations of PU‐H71 and IC50 of bortezomib and vice versa. Also, shown is the Fa‐combination index (CI) plot for the combinations. C, Western blot for PARP p85 and cleaved caspase 7 in 4 cell lines‐A673, CHP100, TC71 and SK‐PN‐DW treated with PBS, PU‐H71, bortezomib and combination of PU‐H71 and bortezomib for 24 h. D, immunoblot analysis of ubiquitinated proteins in A673 and SK‐PN‐DW cells treated with PBS, PU‐H71, bortezomib and combination of PU‐H71 and bortezomib for 24 h. E, A673 cells were treated with PBS, PU‐H71 250 nM, bortezomib 5 nM and combination of PU‐H71 250 nM and bortezomib 5 nM for 6 h and 24 h and their proteasome activity was measured (experiments were conducted in triplicate).
Figure 7.
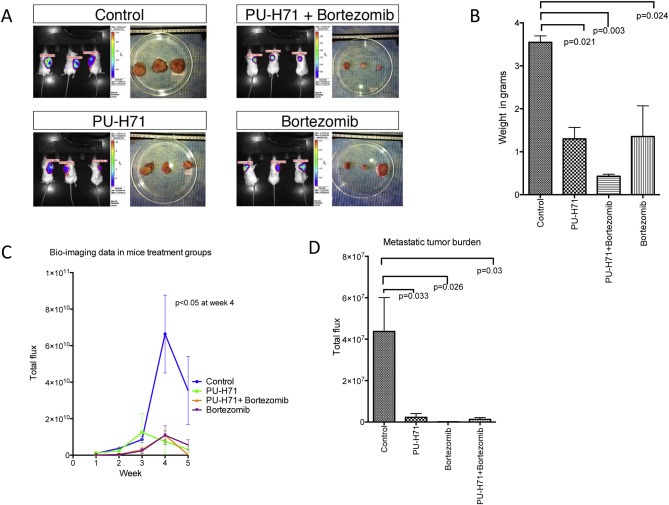
Combination of PU‐H71 and bortezomib exhibits greater inhibition of tumor growth in A673 xenograft model in NSG mice. A, Imaging at week 5 and the size of the tumors after excision are shown in all 4 groups of mice. B, Weight of the tumors, C, Total flux of the tumors imaged weekly, and D, metastatic burden (mean ± SEM of total flux of organs) in the four treatment groups is shown.
3.9. Combination of PU‐H71 and bortezomib increases the accumulation of ubiquitinated proteins in Ewing sarcoma cell lines
We treated A673 and SK‐PN‐DW cell lines with PU‐H71 250 nM, bortezomib10 nM alone and in combination for 24 h and performed immunoblot analyses for ubiquitinated proteins. PU‐H71 treated cells had a small increase in the ubiquitinated proteins. However, the combination of PU‐H71 and bortezomib led to marked accumulation of ubiquitinated proteins (Figure 6). We performed proteasome activity assay in A673 cells using either PU‐H71 (250 nM), BTZ (5 nM) or in combination. At 6 h treatment, there was no significant difference in the proteasome activity between untreated cells and cells treated with PU‐H71. When cells were treated with PU‐H71 for 24 h, we noted an increase in the proteasome activity. Bortezomib treatment led to a marked decrease in proteasome activity at 6 and 24 h. Combination of bortezomib and PU‐H71 significantly reduced the proteasome activity at 24 h compared to bortezomib alone, but no difference was noted at 6 h (Figure 6E).
4. Discussion
Novel drugs that have single agent efficacy or have synergistic action with other drugs are needed to improve the outcomes for Ewing sarcoma. The role of heat shock proteins, particularly HSP90 in pediatric solid tumors has been described recently in osteosarcoma (Bagatell et al., 2005; McCleese et al., 2009), neuroblastoma (Bagatell et al., 2005; Kim et al., 2002; López‐Maderuelo et al., 2001) and rhabdomyosarcoma (Lesko et al., 2007). Exposure to chemotherapy and radiotherapy leads to upregulation of HSP90 and this been implicated as a mechanism for resistance to chemotherapy and IGF1R treatment in Ewing sarcoma (Martins et al., 2008). Based on the pre‐clinical evidence of efficacy in pediatric solid tumors, two phase 1 studies of 17‐AAG in children with recurrent and refractory solid tumors were performed recently, one by the POETIC consortium (Bagatell et al., 2007) and another study by Children's Oncology Group (COG) (Weigel et al., 2007). Grade 3 transaminitis and hypoxia were reported in the POETIC study and no dose limiting toxicities were reported in the COG study. However, were no objective responses with 17‐AAG in either study. At MSKCC, we have developed a novel purine scaffold HSP90 inhibitor, PU‐H71 that was shown to be effective in pre‐clinical models of triple negative breast cancer and BCL‐6 positive lymphomas (Caldas‐Lopes et al., 2009; Cerchietti et al., 2009). PU‐H71 was noted to have IC50s around 2–8 fold lower than 17‐AAG in triple negative breast cancer cell lines (Caldas‐Lopes et al., 2009). A first‐in‐human phase 1 trial is currently underway for solid tumors in adults at MSKCC. There are no pre‐clinical data on activity of PU‐H71 in sarcomas and very limited data on in vivo efficacy of HSP90 inhibitors in Ewing sarcoma. In this study, we evaluated the activity of PU‐H71 in multiple Ewing sarcoma cell lines and early cultures derived from patient samples in in vitro and in vivo models. Ewing sarcoma is characterized by multiple dysregulated signaling pathways and represents an ideal target to affect multiple client proteins at once.
PU‐H71 inhibited proliferation of Ewing sarcoma cells lines and patient tumor samples and induced apoptosis via activation of caspase 3/7. The mean IC50 for the Ewing sarcoma cell lines tested was 230 nM and maximal cell death was noted at 48 h. We noted that inhibition of HSP90 with PU‐H71 led to upregulation of HSP70 and HSP27 in a dose dependent manner suggesting a compensatory increase in co‐chaperones. Using gene expression analysis from cell lines and patient samples, it has been shown that multiple signaling pathways involved in proliferation, cell cycle regulation and differentiation are active in Ewing sarcoma (Kauer et al., 2009). EWS‐FLI1 and EWS‐E1AF fusion genes were shown to activate telomerase activity and up‐regulate telomerase reverse transcriptase (TERT) mRNA in NIH3T3 cells (Takahashi et al., 2003). Telomerase was shown to be active in Ewing sarcoma patient samples using TRAP assay (Ulaner et al., 2004) and increased hTERT expression in Ewing sarcoma patient samples was shown by immunohistochemistry (Fuchs et al., 2004). Using PU‐H71 beads, we have shown that hTERT is a client protein of the HSP90 chaperone complex and inhibition of HSP90 by PU‐H71 led to decreased hTERT expression in A673. The role of mitogen‐activated protein kinase (MAPK) and phosphatidylinositol‐3‐kinase (PI3‐K) signaling pathways was shown in Ewing sarcoma and their inhibition using specific inhibitors led to impaired cell growth and colony formation in Ewing sarcoma cell lines (Benini et al., 2003). Similarly, Silvany et al. (Silvany et al., 2000) showed that ERK was activated in NIH3T3 cells expressing EWS‐FLI1 and inhibition of ERK led to impaired growth. In our work, we have seen a decrease in the expression of pERK, RAF‐1 and AKT in Ewing cell lines exposed to PU‐H71 (Figure 3B). The IGF1R mediated pathway was shown to play a prominent role in Ewing sarcoma cell lines and blockade of the IGF1R pathway led to growth inhibition, decreased colony formation in soft agar and decreased migratory ability in vitro (Scotlandi et al., 1996). Inhibition of IGF1R using monoclonal antibodies led to regression of tumors induced by TC71 in athymic mice (Scotlandi et al., 1998). In a recent phase II single arm clinical trial using monoclonal antibodies to IGF1R in patients having refractory Ewing sarcoma, only 18 out of 125 patients achieved complete or partial response (Pappo et al., 2011). Ewing cell lines resistant to IGF1R inhibitors were found to have up‐regulation of HSP90 and its inhibition with 17‐AAG restored sensitivity to IGF1R inhibitors (Martins et al., 2008). In our study we have shown that Ewing cell lines treated with PU‐H71 had decreased expression of IGF1R, suggesting a potential additive or synergistic effect when combined with IGF1R inhibitors. c‐MYC is another oncogene that was shown to be up‐regulated in Ewing sarcoma cell lines and its promoter is transactivated by EWS‐FLI1 protein (Bailly et al., 1994). In our immunoblot analysis, both c‐MYC and EWS‐FLI1 were decreased when A673 and SK‐PN‐DW were treated with PU‐H71 (Figure 3B). We have seen a decrease in metastatic burden in our mouse model when tumor‐bearing mice were treated with PU‐H71. An earlier study using a different HSP90 inhibitor, Geldanamycin, in rhabdomyosarcoma cells showed a decrease in chemotaxis towards a hepatocyte growth factor gradient in vitro and blockade of bone marrow metastases in vivo (Lesko et al., 2007). There is a report of increased expression of c‐KIT in Ewing sarcoma tumor samples, and pretreatment of Ewing sarcoma cells with Stem Cell Factor enhanced pulmonary and extra pulmonary metastases (Landuzzi et al., 2000). Interestingly, we have seen a decrease in c‐KIT expression in A673 and SK‐PN‐DW cell lines treated with PU‐H71. This partly explains the decrease in metastatic burden in our in vivo model. RPPA analysis showed that phosphosinositide dependent kinase 1 (PDK1) and glycogen synthase kinase 3 (GSK3) are decreased after treatment with PU‐H71 in A673 and SK‐PN‐DW, and both these proteins are downstream in the insulin receptor signaling pathway. Immunohistochemistry revealed that CD31, a marker for angiogenesis, was decreased in mice treated with PU‐H71 compared to the vehicle treated mice suggesting an additional mechanism for tumor inhibition.
We hypothesized that misfolded proteins, as a result of HSP90 inhibition, would undergo ubiquitination and degradation via the proteasome pathway. A recent paper also suggested that a combination of 17‐DMAG (an HSP90 inhibitor) and bortezomib exerted more potent inhibitory effects on rhabdomyosarcoma cells in vitro than either agent alone (Peron et al., 2012). Using the Chou‐Talalay method (Chou, 2010), we have shown that the combination of PU‐H71 with bortezomib is synergistic in Ewing sarcoma cell lines in vitro and A673 in vivo model (Figure 6B). When both agents were combined there was a greater induction of PARP p85 and cleaved caspase 7 compared to either drug alone (Figure 6C). Immunoblot analysis of ubiquitinated proteins in A673 and SK‐PN‐DW cells treated with PBS, PU‐H71, bortezomib and combination of PU‐H71 and bortezomib (Figure 6D) reveals a potential mechanism underlying the synergism. The results of this experiment suggest that when HSP90 is inhibited by PU‐H71, unstable proteins undergo ubiquitination. Accumulation of ubiqutinated proteins is also seen when proteasome is inhibited with bortezomib. The combination of PU‐H71 and bortezomib further increases the amount of ubiquitinated proteins leading to proteotoxic stress to the tumor cell. We noted an increase in proteasome activity in A673 cells with PU‐H71 treatment for 24 h (Figure 6E). This is likely a compensatory mechanism to process ubiquitinated proteins. Similar to 17‐AAG in multiple myeloma model (Mitsiades et al., 2006), we noted a significant reduction in proteasome activity when PU‐H71 was combined with bortezomib compared to bortezomib alone at 24 h drug exposure in A673 cells (Figure 6E). These mechanisms might explain the synergistic efficacy of PU‐H71 when combined with bortezomib simultaneously in A673 cell line. Bortezomib was effective in decreasing the metastases significantly compared to control tumors (p = 0.026). However, we did not see synergism in the reduction of the metastatic burden when bortezomib was combined with PU‐H71. We treated the mice at the maximal tolerated dose of bortezomib in the combination group, which may not be suitable for determining synergy with PU‐H71. Bortezomib, by itself has a potent growth inhibitory effect in Ewing sarcoma cell lines, with IC50 in the range of 3–17 nM in different Ewing cell lines. A phase 2 clinical trial of bortezomib in refractory sarcoma patients was closed early due to lack of activity. However there were only 2 patients with Ewing sarcoma (Maki et al., 2005) in that trial. Dose escalation was not possible due to toxicity noted in the first few patients. The observed synergism with HSP90 inhibitor, PU‐H71 is encouraging because it will likely result in decreased toxicities due to reduction in the doses for both drugs.
Financial support
S.R.A is a recipient of Miracle Margaux Foundation Fellowship and Kristen Ann Carr Foundation Fellowship. M.A.S.M received funding from Steven Stern Family Fund.
Conflicts of interest
P.A.M received travel support and funding from Millennium Pharmaceuticals for a clinical trial (Mifamurtide) not related to this work. PU‐H71 is licensed to Samus Therapeutics in which GC has equity. All other authors have no conflicts of interest.
Funding
S.R.A is a recipient of Miracle Margaux Foundation Fellowship and Kristen Ann Carr Foundation Fellowship. This work was supported by generous grant from Steven Stern Family Fund and Miracle Margaux Foundation. RPPA was performed at RPPA core facility at M.D. Anderson Cancer Center funded by NCI # CA16672.
Supporting information
The following are the supplementary data related to this article.
Supplementary data_Figure 1 Expression of proteins involved in key signaling pathways before and after treatment with PU‐H71 in two cell lines, A673 (S.1A) and SK‐PN‐DW (S.1B) and heat map showing the corresponding changes in proteins in both cell lines (S.1C). Side bar plot of protein expression in the A673 and SK‐PN‐DW cell lines for the proteins tested in untreated and treated samples that lie above1.25 and below 0.75 fold expression (S.1D).
Supplementary data_Figure 2 A, Optimization of 20S proteasome assay using serial dilution of positive controls. B, assay was validated using 25uM and 250uM of Lactacystin (a specific and potent proteasome inhibitor) included in the kit.
Acknowledgments
We thank Dr. Marc Ladanyi for providing cell lines TC71, CHP100, SK‐ES‐1, RD‐ES, CADO‐ES and SK‐N‐MC; Ms. Katharine Debeer for helpful comments and Ms. Elizabeth Peguero for technical help with mouse experiments.
Supplementary data 1.
Supplementary data related to this article can be found at http://dx.doi.org/10.1016/j.molonc.2013.12.005.
Ambati Srikanth R., Lopes Eloisi Caldas, Kosugi Kohji, Mony Ullas, Zehir Ahmet, Shah Smit K., Taldone Tony, Moreira Andre L., Meyers Paul A., Chiosis Gabriela and Moore Malcolm A.S., (2014), Pre‐clinical efficacy of PU‐H71, a novel HSP90 inhibitor, alone and in combination with bortezomib in Ewing sarcoma, Molecular Oncology, 8, doi: 10.1016/j.molonc.2013.12.005.
Contributor Information
Srikanth R. Ambati, Email: ambatis@mskcc.org, Email: srikanthambati@gmail.com
Malcolm A.S. Moore, Email: m-moore@ski.mskcc.org
References
- Bagatell, R. , Beliakoff, J. , David, C.L. , Marron, M.T. , Whitesell, L. , 2005. Hsp90 inhibitors deplete key anti-apoptotic proteins in pediatric solid tumor cells and demonstrate synergistic anticancer activity with cisplatin. Int. J. Cancer. 113, 179–188. [DOI] [PubMed] [Google Scholar]
- Bagatell, R. , Gore, L. , Egorin, M.J. , Ho, R. , Heller, G. , Boucher, N. , Zuhowski, E.G. , Whitlock, J.A. , Hunger, S.P. , Narendran, A. , Katzenstein, H.M. , Arceci, R.J. , Boklan, J. , Herzog, C.E. , Whitesell, L. , Ivy, S.P. , Trippett, T.M. , 2007. Phase I pharmacokinetic and pharmacodynamic study of 17-N-allylamino-17-demethoxygeldanamycin in pediatric patients with recurrent or refractory solid tumors: a pediatric oncology experimental therapeutics investigators consortium study. Clin. Cancer Res.. 13, 1783–1788. [DOI] [PubMed] [Google Scholar]
- Bailly, R.A. , Bosselut, R. , Zucman, J. , Cormier, F. , Delattre, O. , Roussel, M. , Thomas, G. , Ghysdael, J. , 1994. DNA-binding and transcriptional activation properties of the EWS-FLI-1 fusion protein resulting from the t(11;22) translocation in Ewing sarcoma. Mol. Cell. Biol.. 14, 3230–3241. [DOI] [PMC free article] [PubMed] [Google Scholar]
- Benini, S. , Manara, M.C. , Cerisano, V. , Perdichizzi, S. , Strammiello, R. , Serra, M. , Picci, P. , Scotlandi, K. , 2003. Contribution of MEK/MAPK and PI3-K signaling pathway to the malignant behavior of Ewing's sarcoma cells: therapeutic prospects. Int. J. Cancer. 108, 358–366. [DOI] [PubMed] [Google Scholar]
- Blagosklonny, M.V. , Toretsky, J. , Bohen, S. , Neckers, L. , 1996. Mutant conformation of p53 translated in vitro or in vivo requires functional HSP90. Proc. Natl. Acad. Sci.. 93, 8379–8383. [DOI] [PMC free article] [PubMed] [Google Scholar]
- Caldas-Lopes, E. , Cerchietti, L. , Ahn, J.H. , Clement, C.C. , Robles, A.I. , Rodina, A. , Moulick, K. , Taldone, T. , Gozman, A. , Guo, Y. , Wu, N. , de Stanchina, E. , White, J. , Gross, S.S. , Ma, Y. , Varticovski, L. , Melnick, A. , Chiosis, G. , 2009. Hsp90 inhibitor PU-H71, a multimodal inhibitor of malignancy, induces complete responses in triple-negative breast cancer models. Proc. Natl. Acad. Sci.. 106, 8368–8373. [DOI] [PMC free article] [PubMed] [Google Scholar]
- Cerchietti, L.C. , Lopes, E.C. , Yang, S.N. , Hatzi, K. , Bunting, K.L. , Tsikitas, L.A. , Mallik, A. , Robles, A.I. , Walling, J. , Varticovski, L. , Shaknovich, R. , Bhalla, K.N. , Chiosis, G. , Melnick, A. , 2009. A purine scaffold Hsp90 inhibitor destabilizes BCL-6 and has specific antitumor activity in BCL-6-dependent B cell lymphomas. Nat. Med.. 15, 1369–1376. [DOI] [PMC free article] [PubMed] [Google Scholar]
- Chou, T.C. , 2010. Drug combination studies and their synergy quantification using the Chou-Talalay method. Cancer Res.. 70, 440–446. [DOI] [PubMed] [Google Scholar]
- Chou,, T.-C. , Martin, N. , 2007. CompuSyn Software for Drug Combinations and for General Dose-Effect Analysis, and User's Guide ComboSyn, Inc. Paramus, NJ. (www.combosyn.com) [Google Scholar]
- De Vito, C. , Riggi, N. , Cornaz, S. , Suvà, M.-L. , Baumer, K. , Provero, P. , Stamenkovic, I. , 2012. A TARBP2-dependent miRNA expression profile underlies cancer stem cell properties and provides candidate therapeutic reagents in Ewing sarcoma. Cancer Cell. 21, 807–821. [DOI] [PubMed] [Google Scholar]
- Erkizan, H.V. , Uversky, V.N. , Toretsky, J.A. , 2010. Oncogenic partnerships: EWS-FLI1 protein interactions initiate key pathways of Ewing's sarcoma. Clin. Cancer Res.. 16, 4077–4083. [DOI] [PMC free article] [PubMed] [Google Scholar]
- Franken, N.A.P. , Rodermond, H.M. , Stap, J. , Haveman, J. , van Bree, C. , 2006. Clonogenic assay of cells in vitro. Nat. Protoc.. 1, 2315–2319. [DOI] [PubMed] [Google Scholar]
- Fuchs, B. , Inwards, C. , Scully, S.P. , Janknecht, R. , 2004. hTERT is highly expressed in Ewing's sarcoma and activated by EWS-ETS oncoproteins. Clin. Orthop. Relat. Res.. 64–68. [DOI] [PubMed] [Google Scholar]
- Garofalo, C. , Manara, M.C. , Nicoletti, G. , Marino, M.T. , Lollini, P.L. , Astolfi, A. , Pandini, G. , Lopez-Guerrero, J.A. , Schaefer, K.L. , Belfiore, A. , Picci, P. , Scotlandi, K. , 2011. Efficacy of and resistance to anti-IGF-1R therapies in Ewing's sarcoma is dependent on insulin receptor signaling. Oncogene. 30, 2730–2740. [DOI] [PubMed] [Google Scholar]
- Grier, H.E. , Krailo, M.D. , Tarbell, N.J. , Link, M.P. , Fryer, C.J. , Pritchard, D.J. , Gebhardt, M.C. , Dickman, P.S. , Perlman, E.J. , Meyers, P.A. , Donaldson, S.S. , Moore, S. , Rausen, A.R. , Vietti, T.J. , Miser, J.S. , 2003. Addition of ifosfamide and etoposide to standard chemotherapy for Ewing's sarcoma and primitive neuroectodermal tumor of bone. N. Engl. J. Med.. 348, 694–701. [DOI] [PubMed] [Google Scholar]
- He, H. , Zatorska, D. , Kim, J. , Aguirre, J. , Llauger, L. , She, Y. , Wu, N. , Immormino, R.M. , Gewirth, D.T. , Chiosis, G. , 2006. Identification of potent water soluble purine-scaffold inhibitors of the heat shock protein 90. J. Med. Chem.. 49, 381–390. [DOI] [PubMed] [Google Scholar]
- Hennessy, B.T. , Lu, Y. , Gonzalez-Angulo, A.M. , Carey, M.S. , Myhre, S. , Ju, Z. , Davies, M.A. , Liu, W. , Coombes, K. , Meric-Bernstam, F. , Bedrosian, I. , McGahren, M. , Agarwal, R. , Zhang, F. , Overgaard, J. , Alsner, J. , Neve, R.M. , Kuo, W.-L. , Gray, J.W. , Borresen-Dale, A.-L. , Mills, G.B. , 2010. A technical assessment of the utility of reverse phase protein arrays for the study of the functional proteome in non-microdissected human breast cancers. Clin. Proteom.. 6, 129–151. [DOI] [PMC free article] [PubMed] [Google Scholar]
- Kauer, M. , Ban, J. , Kofler, R. , Walker, B. , Davis, S. , Meltzer, P. , Kovar, H. , 2009. A molecular function map of Ewing's sarcoma. PLoS ONE. 4, e5415 [DOI] [PMC free article] [PubMed] [Google Scholar]
- Kim, S. , Kang, J. , Hu, W. , Evers, B.M. , Chung, D.H. , 2002. Geldanamycin decreases Raf-1 and Akt levels and induces apoptosis in neuroblastomas. Int. J. Cancer. 103, 352–359. [DOI] [PubMed] [Google Scholar]
- Landuzzi, L. , De Giovanni, C. , Nicoletti, G. , Rossi, I. , Ricci, C. , Astolfi, A. , Scopece, L. , Scotlandi, K. , Serra, M. , Bagnara, G.P. , Nanni, P. , Lollini, P.-L. , 2000. The metastatic ability of Ewing's sarcoma cells is modulated by stem cell factor and by its receptor c-kit. Am. J. Pathol.. 157, 2123–2131. [DOI] [PMC free article] [PubMed] [Google Scholar]
- Lesko, E. , Gozdzik, J. , Kijowski, J. , Jenner, B. , Wiecha, O. , Majka, M. , 2007. HSP90 antagonist, geldanamycin, inhibits proliferation, induces apoptosis and blocks migration of rhabdomyosarcoma cells in vitro and seeding into bone marrow in vivo. Anticancer Drugs. 18, 1173–1181. [DOI] [PubMed] [Google Scholar]
- Lin, P.P. , Brody, R.I. , Hamelin, A.C. , Bradner, J.E. , Healey, J.H. , Ladanyi, M. , 1999. Differential transactivation by alternative EWS-FLI1 fusion proteins correlates with clinical heterogeneity in Ewing's sarcoma. Cancer Res.. 59, 1428–1432. [PubMed] [Google Scholar]
- López-Maderuelo, M.D. , Fernández-Renart, M. , Moratilla, C. , Renart, J. , 2001. Opposite effects of the Hsp90 inhibitor Geldanamycin: induction of apoptosis in PC12, and differentiation in N2A cells. FEBS Lett.. 490, 23–27. [DOI] [PubMed] [Google Scholar]
- Maki, R.G. , Kraft, A.S. , Scheu, K. , Yamada, J. , Wadler, S. , Antonescu, C.R. , Wright, J.J. , Schwartz, G.K. , 2005. A multicenter phase II study of bortezomib in recurrent or metastatic sarcomas. Cancer. 103, 1431–1438. [DOI] [PubMed] [Google Scholar]
- Martins, A.S. , Ordonez, J.L. , Garcia-Sanchez, A. , Herrero, D. , Sevillano, V. , Osuna, D. , Mackintosh, C. , Caballero, G. , Otero, A.P. , Poremba, C. , Madoz-Gurpide, J. , de Alava, E. , 2008. A pivotal role for heat shock protein 90 in Ewing sarcoma resistance to anti-insulin-like growth factor 1 receptor treatment: in vitro and in vivo study. Cancer Res.. 68, 6260–6270. [DOI] [PubMed] [Google Scholar]
- Martínez-Ramírez, A. , Rodríguez-Perales, S. , Meléndez, B. , Martínez-Delgado, B. , Urioste, M. , Cigudosa, J.C. , Benítez, J. , 2003. Characterization of the A673 cell line (Ewing tumor) by molecular cytogenetic techniques. Cancer Genet. Cytogenet.. 141, 138–142. [DOI] [PubMed] [Google Scholar]
- Marubayashi, S. , Koppikar, P. , Taldone, T. , Abdel-Wahab, O. , West, N. , Bhagwat, N. , Caldas-Lopes, E. , Ross, K.N. , Gönen, M. , Gozman, A. , Ahn, J.H. , Rodina, A. , Ouerfelli, O. , Yang, G. , Hedvat, C. , Bradner, J.E. , Chiosis, G. , Levine, R.L. , 2010. HSP90 is a therapeutic target in JAK2-dependent myeloproliferative neoplasms in mice and humans. J. Clin. Invest.. 120, 3578–3593. [DOI] [PMC free article] [PubMed] [Google Scholar]
- McCleese, J.K. , Bear, M.D. , Fossey, S.L. , Mihalek, R.M. , Foley, K.P. , Ying, W. , Barsoum, J. , London, C.A. , 2009. The novel HSP90 inhibitor STA-1474 exhibits biologic activity against osteosarcoma cell lines. Int. J. Cancer. 125, 2792–2801. [DOI] [PubMed] [Google Scholar]
- Miser, J.S. , Goldsby, R.E. , Chen, Z. , Krailo, M.D. , Tarbell, N.J. , Link, M.P. , Fryer, C.J. , Pritchard, D.J. , Gebhardt, M.C. , Dickman, P.S. , Perlman, E.J. , Meyers, P.A. , Donaldson, S.S. , Moore, S.G. , Rausen, A.R. , Vietti, T.J. , Grier, H.E. , 2007. Treatment of metastatic Ewing sarcoma/primitive neuroectodermal tumor of bone: evaluation of increasing the dose intensity of chemotherapy – a report from the Children's oncology group. Pediatr. Blood Cancer. 49, 894–900. [DOI] [PubMed] [Google Scholar]
- Mitsiades, C.S. , Mitsiades, N.S. , McMullan, C.J. , Poulaki, V. , Kung, A.L. , Davies, F.E. , Morgan, G. , Akiyama, M. , Shringarpure, R. , Munshi, N.C. , Richardson, P.G. , Hideshima, T. , Chauhan, D. , Gu, X. , Bailey, C. , Joseph, M. , Libermann, T.A. , Rosen, N.S. , Anderson, K.C. , 2006. Antimyeloma activity of heat shock protein-90 inhibition. Blood. 107, 1092–1100. [DOI] [PMC free article] [PubMed] [Google Scholar]
- Morozov, A. , Downey, R.J. , Healey, J. , Moreira, A.L. , Lou, E. , Franceschino, A. , Dogan, Y. , Leung, R. , Edgar, M. , LaQuaglia, M. , Maki, R.G. , Moore, M.A.S. , 2010. Benign mesenchymal stromal cells in human sarcomas. Clin. Cancer Res.. 16, 5630–5640. [DOI] [PMC free article] [PubMed] [Google Scholar]
- Moulick, K. , Ahn, J.H. , Zong, H. , Rodina, A. , Cerchietti, L. , Gomes DaGama, E.M. , Caldas-Lopes, E. , Beebe, K. , Perna, F. , Hatzi, K. , Vu, L.P. , Zhao, X. , Zatorska, D. , Taldone, T. , Smith-Jones, P. , Alpaugh, M. , Gross, S.S. , Pillarsetty, N. , Ku, T. , Lewis, J.S. , Larson, S.M. , Levine, R. , Erdjument-Bromage, H. , Guzman, M.L. , Nimer, S.D. , Melnick, A. , Neckers, L. , Chiosis, G. , 2011. Affinity-based proteomics reveal cancer-specific networks coordinated by Hsp90. Nat. Chem. Biol.. 7, 818–826. [DOI] [PMC free article] [PubMed] [Google Scholar]
- Nimmanapalli, R. , O'Bryan, E. , Bhalla, K. , 2001. Geldanamycin and its analogue 17-allylamino-17-demethoxygeldanamycin lowers Bcr-Abl levels and induces apoptosis and differentiation of Bcr-Abl-positive human leukemic blasts. Cancer Res.. 61, 1799–1804. [PubMed] [Google Scholar]
- Ohali, A. , Avigad, S. , Zaizov, R. , Ophir, R. , Horn-Saban, S. , Cohen, I.J. , Meller, I. , Kollender, Y. , Issakov, J. , Yaniv, I. , 2004. Prediction of high risk Ewing's sarcoma by gene expression profiling. Oncogene. 23, 8997–9006. [DOI] [PubMed] [Google Scholar]
- Ottaviano, L. , Schaefer, K.-L. , Gajewski, M. , Huckenbeck, W. , Baldus, S. , Rogel, U. , Mackintosh, C. , de Alava, E. , Myklebost, O. , Kresse, S.H. , Meza-Zepeda, L.A. , Serra, M. , Cleton-Jansen, A.-M. , Hogendoorn, P.C.W. , Buerger, H. , Aigner, T. , Gabbert, H.E. , Poremba, C. , 2010. Molecular characterization of commonly used cell lines for bone tumor research: a trans-European EuroBoNet effort. Genes Chromosom. Cancer. 49, 40–51. [DOI] [PubMed] [Google Scholar]
- Pappo, A.S. , Patel, S.R. , Crowley, J. , Reinke, D.K. , Kuenkele, K.P. , Chawla, S.P. , Toner, G.C. , Maki, R.G. , Meyers, P.A. , Chugh, R. , Ganjoo, K.N. , Schuetze, S.M. , Juergens, H. , Leahy, M.G. , Geoerger, B. , Benjamin, R.S. , Helman, L.J. , Baker, L.H. , 2011. R1507, a monoclonal antibody to the insulin-like growth factor 1 receptor, in patients with recurrent or refractory Ewing sarcoma family of tumors: results of a phase II sarcoma alliance for research through collaboration study. J. Clin. Oncol. Official J. Am. Soc. Clin. Oncol.. 29, 4541–4547. [DOI] [PMC free article] [PubMed] [Google Scholar]
- Peron, M. , Bonvini, P. , Rosolen, A. , 2012. Effect of inhibition of the ubiquitin-proteasome system and Hsp90 on growth and survival of Rhabdomyosarcoma cells in vitro. BMC Cancer. 12, 233 [DOI] [PMC free article] [PubMed] [Google Scholar]
- RCoreTeam, n.d. R: a Language and Environment for Statistical Computing, 2012 ed. R Foundation for Statistical Computing, Vienna, Austria.
- Roue, G. , Perez-Galan, P. , Mozos, A. , Lopez-Guerra, M. , Xargay-Torrent, S. , Rosich, L. , Saborit-Villarroya, I. , Normant, E. , Campo, E. , Colomer, D. , 2011. The Hsp90 inhibitor IPI-504 overcomes bortezomib resistance in mantle cell lymphoma in vitro and in vivo by down-regulation of the prosurvival ER chaperone BiP/Grp78. Blood. 117, 1270–1279. [DOI] [PubMed] [Google Scholar]
- Schmid, I. , Krall, W.J. , Uittenbogaart, C.H. , Braun, J. , Giorgi, J.V. , 1992. Dead cell discrimination with 7-amino-actinomycin D in combination with dual color immunofluorescence in single laser flow cytometry. Cytometry. 13, 204–208. [DOI] [PubMed] [Google Scholar]
- Scotlandi, K. , Benini, S. , Nanni, P. , Lollini, P.L. , Nicoletti, G. , Landuzzi, L. , Serra, M. , Manara, M.C. , Picci, P. , Baldini, N. , 1998. Blockage of insulin-like growth factor-I receptor inhibits the growth of Ewing's sarcoma in athymic mice. Cancer Res.. 58, 4127–4131. [PubMed] [Google Scholar]
- Scotlandi, K. , Benini, S. , Sarti, M. , Serra, M. , Lollini, P.-L. , Maurici, D. , Picci, P. , Manara, M.C. , Baldini, N. , 1996. Insulin-like growth factor I receptor-mediated circuit in Ewing's sarcoma/peripheral neuroectodermal tumor: a possible therapeutic target. Cancer Res.. 56, 4570–4574. [PubMed] [Google Scholar]
- Silvany, R.E. , Eliazer, S. , Wolff, N.C. , Ilaria, R.L. , 2000. Interference with the constitutive activation of ERK1 and ERK2 impairs EWS/FLI-1-dependent transformation. Oncogene. 19, 4523–4530. [DOI] [PubMed] [Google Scholar]
- Smith, M.A. , Seibel, N.L. , Altekruse, S.F. , Ries, L.A. , Melbert, D.L. , O'Leary, M. , Smith, F.O. , Reaman, G.H. , 2010. Outcomes for children and adolescents with cancer: challenges for the twenty-first century. J. Clin. Oncol. Official J. Am. Soc. Clin. Oncol.. 28, 2625–2634. [DOI] [PMC free article] [PubMed] [Google Scholar]
- Sohn, E.J. , Li, H. , Reidy, K. , Beers, L.F. , Christensen, B.L. , Lee, S.B. , 2010. EWS/FLI1 oncogene activates caspase 3 transcription and triggers apoptosis in vivo. Cancer Res.. 70, 1154–1163. [DOI] [PMC free article] [PubMed] [Google Scholar]
- Takahashi, A. , Higashino, F. , Aoyagi, M. , Yoshida, K. , Itoh, M. , Kyo, S. , Ohno, T. , Taira, T. , Ariga, H. , Nakajima, K. , Hatta, M. , Kobayashi, M. , Sano, H. , Kohgo, T. , Shindoh, M. , 2003. EWS/ETS fusions activate telomerase in Ewing's tumors. Cancer Res.. 63, 8338–8344. [PubMed] [Google Scholar]
- Ulaner, G.A. , Hoffman, A.R. , Otero, J. , Huang, H.-Y. , Zhao, Z. , Mazumdar, M. , Gorlick, R. , Meyers, P. , Healey, J.H. , Ladanyi, M. , 2004. Divergent patterns of telomere maintenance mechanisms among human sarcomas: sharply contrasting prevalence of the alternative lengthening of telomeres mechanism in Ewing's sarcomas and osteosarcomas. Genes Chromosom. Cancer. 41, 155–162. [DOI] [PubMed] [Google Scholar]
- van Engeland, M. , Ramaekers, F.C. , Schutte, B. , Reutelingsperger, C.P. , 1996. A novel assay to measure loss of plasma membrane asymmetry during apoptosis of adherent cells in culture. Cytometry. 24, 131–139. [DOI] [PubMed] [Google Scholar]
- Weigel, B.J. , Blaney, S.M. , Reid, J.M. , Safgren, S.L. , Bagatell, R. , Kersey, J. , Neglia, J.P. , Ivy, S.P. , Ingle, A.M. , Whitesell, L. , Gilbertson, R.J. , Krailo, M. , Ames, M. , Adamson, P.C. , 2007. A phase I study of 17-allylaminogeldanamycin in relapsed/refractory pediatric patients with solid tumors: a Children's oncology group study. Clin. Cancer Res.. 13, 1789–1793. [DOI] [PubMed] [Google Scholar]
- Whitesell, L. , Lindquist, S.L. , 2005. HSP90 and the chaperoning of cancer. Nat. Rev. Cancer. 5, 761–772. [DOI] [PubMed] [Google Scholar]
Associated Data
This section collects any data citations, data availability statements, or supplementary materials included in this article.
Supplementary Materials
The following are the supplementary data related to this article.
Supplementary data_Figure 1 Expression of proteins involved in key signaling pathways before and after treatment with PU‐H71 in two cell lines, A673 (S.1A) and SK‐PN‐DW (S.1B) and heat map showing the corresponding changes in proteins in both cell lines (S.1C). Side bar plot of protein expression in the A673 and SK‐PN‐DW cell lines for the proteins tested in untreated and treated samples that lie above1.25 and below 0.75 fold expression (S.1D).
Supplementary data_Figure 2 A, Optimization of 20S proteasome assay using serial dilution of positive controls. B, assay was validated using 25uM and 250uM of Lactacystin (a specific and potent proteasome inhibitor) included in the kit.