

Abstract
Endothelial filopodia play key roles in guiding the tubular sprouting during angiogenesis. However, their dynamic morphological characteristics, with the associated implications in cell motility, have been subjected to limited investigations. In this work, the interaction between endothelial cells and extracellular matrix fibrils was recapitulated in vitro, where a specific focus was paid to derive the key morphological parameters to define the dynamics of filopodium-like protrusion during cell motility. Based on one-dimensional gelatin fibrils patterned by near-field electrospinning (NFES), we study the response of endothelial cells (EA.hy926) under normal culture or ROCK inhibition. It is shown that the behaviour of temporal protrusion length versus cell motility can be divided into distinct modes. Persistent migration was found to be one of the modes which permitted cell displacement for over 300 µm at a speed of approximately 1 µm min−1. ROCK inhibition resulted in abnormally long protrusions and diminished the persistent migration, but dramatically increased the speeds of protrusion extension and retraction. Finally, we also report the breakage of protrusion during cell motility, and examine its phenotypic behaviours.
Keywords: cellular protrusion, near-field electrospinning, extracellular matrix, micropatterning, cell motility, ROCK
1. Introduction
Natural extracellular matrices (ECMs) consist of fibril structures ranging from the nanometre to the micrometre scale [1,2]. These fibrils provide specific adhesive features, together with topographical and mechanical cues, which conduct cellular behaviours [3]. In vivo, individual cells would interface with one or more ECM fibrils organized in a three-dimensional fashion [1–3]. Cytoplasmic slender projections, for example filopodia, were suggested to function as antennae to sense the biochemical and biophysical cues given by the surrounding substratum, for example ECM, in turn guiding cellular locomotion [4]. For endothelial cells in particular, filopodia were identified at the tip cell, which leads sprouting vessels during angiogenesis [5,6]. Owing to the key role of filopodia associated with angiogenesis, extensive studies have been performed to identify the signalling pathways and molecular regulators of endothelial filopodia [5,7]. Motility guidance through soluble chemical factors, for example VEGF, has been extensively studied [8,9]. However, guidance due to adhesion and topographical factors presented by the ECM fibrils was subjected to limited investigation [10]. It is known that during tumorigenesis, significant alteration to the physical characteristics of surrounding ECM takes place [11,12]. For example, thickening and straightening of collagen fibrils are typically associated with tumour development and angiogenesis [11,12]. Lumen formation, which is associated with tubular sprouting in angiogenesis, only takes place for adhesive pattern smaller than approximately 10 µm [13]. Recent studies also showed that only the filopodial migration mode, not the lamellipodial mode, promoted lumen formation [14]. With the a priori investigations, it is thus of interest to address the question of how the ECM fibrils may impact the protrusion initiation and development, and its correlation to cell motility.
As fibril structures are the building blocks of an ECM, studying endothelial protrusion interaction with a single ECM fibril can be seen as a simple and physiologically relevant model system. Micrometre-wide tracks of ECM molecules can be patterned by techniques such as contact printing [15] and photopatterning [16]. Based on these systems, Doyle et al. [16] studied the fibroblast migration and revealed the rapid and uniaxial migratory behaviour of one-dimensional migration, mimicking the behaviour in a three-dimensional ECM. Similar one-dimensional systems have now been widely used for studying cellular motility and morphogenesis [17,18]. However, to our knowledge, detailed morphological characterizations of the dynamic interaction between the filopodial-like protrusion and a one-dimensional adhesive pattern are lacking. Therefore, in our study here, the endothelial filopodium–ECM interaction is recapitulated using patterned gelatin fibrils. Ordered patterns of gelatin fibrils of 2 µm width were created by near-field electrospinning (NFES) [19,20]. Gelatin, as a denatured form of collagen, [21] was employed as the ECM mimic, because collagen is the most abundant protein in the ECM [22] and has possible implications in tumorigenesis (as previously stated). Unlike the micropatterned tracks which have a flat topography, the fibril produced by NFES presents a convex surface (see Results), which is expected to better recapitulate the topography of an ECM fibril. The interaction between endothelial protrusions and the fibrils was monitored using live cell imaging on non-fluorescently labelled cells. We observed occasional breakage of protrusions during cell migration. ROCK inhibition was applied to test the influence of reduced ROCK-driven actomyosin contractility [23,24] on the protrusion morphology and cell motility. To perform quantitative and statistical analysis, we adopted simple and directly observable parameters of length characteristics to reflect the behaviours of protrusion.
2. Material and methods
2.1. Near-field electrospinning of gelatin fibrils
NFES was used to pattern gelatin fibrils of 2 µm in width on a flexible PDMS (polydimethylsiloxane) substrate, following a procedure adapted from Huang et al. [20]. Briefly, a home-built NFES system was constructed with two single-axis translation stages placed orthogonally to enable two-dimensional horizontal motions to control pattern formation. A syringe containing gelatin solution was fixed in a vertical (z) position directly above the target, with a semi-spherical droplet of approximately 0.2 µl attached at a tapered needle tip (BD Microlance, 19G). During NFES, a positive potential was applied at the needle, which induced fibril extrusion from the leading edge of the droplet. Fibrils were deposited onto a cross-linked PDMS film (1 mm thick, Sylgard 184) attached to the electrically grounded aluminium plate fixed on the translation stage. To enable continuous deposition of straight gelatin fibrils of 1–2 µm, we used a gelatin solution containing 15 wt% gelatin (porcine skin, Sigma), 25 wt% deionized water, 36 wt% acetic acid (Sigma) and 24 wt% ethyl acetate (Sigma). A voltage of 1000 V was applied, and the spacing between the needle tip and the PDMS surface was kept at 1.25 mm. After NFES, gelatin fibrils were then cross-linked following procedures described in Zhang et al. [25]. After cross-linking, the fibril-PDMS construct was rinsed with 70% ethanol, and then phosphate buffered saline (Sigma) prior to use for cell culturing.
2.2. Live cell studies and quantitative analysis
Human umbilical vein cell line EA.hy926 (American Type Culture Collection, Manassas, VA, USA; given by the Institute of Cancer Research London, UK; passage 10–20) were cultured in DMEM (Gibco) supplemented with 10% fetal bovine serum (Sigma) and 1% penicillin–streptomycin (Sigma). Cells were maintained under 5% CO2, 37°C in a Binder (Germany) incubator.
To study the interaction between EA.hy926 and the gelatin fibrils, aligned fibrils of 40 µm spacing, patterned on PDMS pieces of 0.5 × 0.5 cm, were used. Cells were seeded to obtain a coverage of 100 mm2 on fibril-patterned PDMS or bare PDMS (as a reference). Time lapse imaging commenced approximately 1 h after cell seeding. Cells were found to attach fully to the substrate/fibril approximately 1 h after imaging. As endothelial cells are known to be sensitive to light, imaging was acquired using a confocal microscope (Leica TCS SP2) at 633 nm laser (Helium–Neon) scanning through a transmission mode. Cells were kept under 5% CO2 and 37°C using a live cell imaging chamber. Images (512 × 512 pixels) were acquired using a scanning rate of 400 Hz at a 10 min interval. In each experiment run, three sample sets were simultaneously performed. The first sample set (Fibril-0-0) involved cells seeded on fibril-patterned PDMS and cultured in the standard culture medium for the initial stage of image acquisition. After 12 h, the medium was replaced with fresh culture medium and continued to be monitored for 8 h. The second sample set (Fibril-0-I, where I stands for inhibition) underwent the same initial stage as the first sample set; while at the second stage, the culture medium with 5 µM H1152 ROCK inhibitor was used instead. A reference sample of cells growing on bare PDMS was also performed (Ref-0-0). Three runs of experiments were performed.
Time lapse images for the live cells were subsequently analysed with LAS AF software (Leica Microsystems). Preliminary inspection of endothelial cells showed highly dynamic protrusions along the gelatin fibrils. Breakage of the protrusions was also seen for some cells. Owing to the low contrast of a non-stained sample, these measurements were manually determined. For each sample set, over 50 cells which were free from interaction with neighbouring cells were studied. We estimated that an uncertainty of ±5 µm was associated with the length values. This was estimated based on the change in protrusion lengths between successive frames. Protrusion lengths LAA and LBB and cell position C (see definitions in the Results and discussion section) were determined using the ImageJ Manual Tracking plugin. They were measured for the period when the cell is visible not diving or clustering with protrusion extremities clearly seen.
3. Results and discussion
3.1. Visual analysis of cellular interaction with gelatin fibrils
Figure 1a,b shows the profiles of a NFES gelatin fibril. The fibril has a uniform width with a convex surface contour. The cellular morphology on the fibrils, i.e. Fibril-0-0, is different from that on a bare PDMS (Ref-0-0). The endothelial cells in Fibril-0-0 were observed to preferably attach to the fibrils. They formed visually more elongated cell shapes (cell aspect ratio = 2.4±1.6 s.d.) compared with the Ref-0-0 (cell aspect ratio = 1.6±0.53 s.d.; see figure 1c,d). This effect is similar to the bipolar cell shape typically seen when cells interact with patterned fibronectin tracks smaller than 5 µm [16,26] or a three-dimensional collagen matrix [27]. One distinct feature of the Fibril-0-0 cells is the filopodial-like protrusion developed at either ends of a bipolarly shaped cell along the gelatin fibril. After ROCK inhibition for sample Fibril-0-I, figure 1e shows that the gelatin fibril again guided the path of the cellular protrusion. The protrusion that meandered along the fibril seems to be longer than those of Fibril-0-I. The cell aspect ratio associated with Fibril-0-I is 2.1 ± 1.2 s.d. (N.B. The lower value compared to Fibril-0-0 is because the long thin protrusion was not significant to be accounted in calculating the long axis of the cell.)
Figure 1.

(a,b) Profiles of the NFES gelatin fibril imaged by atomic force microscopy. (c–e) Immunofluorescence images showing the morphology of the EA.hy926 endothelial cells subjected to different treatments: (c) Ref-0-0 for the bare PDMS case, (d) Fibril-0-0 for the fibrillar case and (e) Fibril-0-I for the fibrillar case with ROCK inhibition. Nuclei were stained with Hoechst-33258 (Sigma), and F-actin stained with Phalloidin-Alexa-488 (Invitrogen). (f) Time lapse images (at an interval of 10 min) showing elongation, retraction and breakage of a protrusion.
Our preliminary observation prompts us to study the dynamics and morphology of these protrusion structures as a key feature to characterize the interaction between endothelial cells and gelatin fibrils. It is of note that cells might remain on the same fibril, or cross between different fibrils at a fibril spacing of 40 µm. Fibril crossing of a cell normally took place when an existing cell interacted with another endothelial cell residing on the neighbouring fibril. A protrusion was found to initiate this process by first approaching the neighbouring fibril and seemingly pulled the cell across to another fibril. If a cell stayed on a fibril instead of crossing, the two opposing protrusions would remain prevalent. Irrespective of the case of crossing or staying, cell motility seemed to be initially directed by the anchoring of protrusion on the fibril, after which the cell body was retracted and pulled forward by protrusion shortening. In our study here, we focus on investigating the case where a cell remains on the same fibril.
Typical migration behaviours on a single fibril involved continuous protrusion extension and retraction at opposite ends. This seemingly leads to some ‘confusion’ for the cell to designate a leading edge for migration. The cell's central position could progress persistently towards one direction or oscillate forwards and backwards along the fibril. To allow for quantitative analysis of the above behaviours, we define the temporal lengths of the two dominating protrusions LAA′ and LBB′; the centre position C where the shift in position C (equivalent to cell displacement) will be studied. The maximum of LAA′ and LBB′ for the same cell observed during the course of imaging process (i.e. when the cell was within the image window, typically between 5 and 10 h) is defined as LM. Here, it is worth emphasizing that cells might exhibit some thinner protrusions which were not detected under our imaging conditions; however, we would like to focus on the dominating, visible filopodial-like protrusions which were expected to play a major role in force generation and load bearing. It is interesting to note that competition between the two edges sometimes also resulted in fracture/scission of one of the protrusions. We further define the length of the protrusion prior to breakage as LB. An example image sequence illustrating the aforementioned leading edge selection process for Fibril-0-0 is shown in figure 1f. The majority of the cells do not exhibit protrusion breakage during cell migration, and they display the stages of protrusion extension, retraction and shifting of their centre positions C along the fibre (see sequence (f1–f4)). For those cells that exhibited protrusion breakage, clustering of protrusion tips and subsequent ‘necking’ of the trailing protrusion occurred, which led to some retraction of the elongated cell body and subsequent cell release after the breakage of the trailing protrusion (see sequence (f5) and (f6)). For the ROCK-inhibited counterpart Fibril-0-I, a similar process of protrusion breakage was also observed. In the following sections, we will further perform quantitative analysis of the dynamics of cell–fibril interaction, by first discussing the different forms of protrusion morphology versus cell motility, and then moving on to study the protrusion breakage events.
3.2. Motility mode versus protrusion morphology on fibril
Analysing the temporal migration and protrusion dynamics of endothelial cells on fibrils reveals different types of behaviours depending on the treatment. The first type of behaviour (Type-1A) is characterized by the weak oscillatory shift in the cells’ central position C with distances typically below 50 µm. The associated protrusions constantly extended and retracted with LAA′ and LBB′ remaining smaller than 100 µm. This behaviour is seen for cells in both Fibril-0-0 and Fibril-0-I (see figure 2a–c). The second category of behaviour is similar to Type-1A, but with an amplified oscillatory effect in the position shift. We term this behaviour Type-1B, and it is only present for Fibril-0-0 cells, with examples shown in figure 2d. The Type-1B behaviour is also characterized by the relatively synchronized patterns between the variation in protrusion lengths and the C-position shift (figure 2e). The pair correlation coefficient between LAA or LBB w.r.t. C-position shift for the Type-1B example cell is approximately 0.6. In comparison, the correlation coefficient for the two examples in Type-1A is approximately −0.5 to 0.2. Another type of migratory behaviour which is only exhibited by Fibril-0-0 is persistent migration for distances over 100 µm. Examples of this behaviour (Type-2) are shown in figure 2f. The speed of persistent migration seen in Type-2 is estimated to be approximately 1 µm min−1. Similar to Type-1A, LAA′ and LBB′ of Type-2 did not show a strong variation pattern. Finally, for Fibril-0-I, a distinct behaviour displayed is the extremely long protrusions with lengths much exceeding 100 µm (Type-3). However, the migratory distance of these cells was very limited.
Figure 2.

The temporal protrusion lengths and cell motility relationships are divided into different groups and illustrated in (a–c) for Type-1A, (d,e) for Type-1B, (f,g) for Type-2 and (h,i) for Type-3. In each group (graphs in the same row), the first plot shows a collection of C-position shift traces for various cells exhibiting the corresponding mode. The subsequent plot(s) emphasize the behaviour of one or two example cell(s), by overlapping the time traces of C-position shift, LAA′ and LBB′. In the collection of C-position shift shown in (d), (f) or (h), each symbol indicates one cell. Specifically, the cell represented by the dark blue-squared symbol corresponds to the cell which is selected for further analysis in (e), (g) or (i). In (f), which represents the Type-2 persistent migration mode, a linear best fit is also drawn to indicate the speed of displacement.
A question to be addressed first is the correlation between LAA′ and LBB′ at the same time point. For a homogeneous one-dimensional feature, one would expect the average distribution of LAA′ and LBB′ to be invariant for sufficient sampling, because there would be no overall preference for the protrusions to develop in either direction along the fibril with the same adhesive cues. To answer this question, we plot pairs of LAA′ and LBB′ occurring at the same time point, for the entire range of time trace over a number of cells (N = 57 for Fibril-0-0 and N = 56 for Fibril-0-I). Such a scatter plot implies the probability of a cell, at a randomly chosen time point, to be seen exhibiting a specific combination of LAA′ and LBB′. According to figure 3a,e, this seems to be the case: one observes that the scatter patterns LAA′ versus LBB′ for Fibril-0-0 and Fibril-0-I are both roughly symmetrical with respect to the line of LAA′ = LBB′. In particular, cells in Fibril-0-0 are more likely to have comparable lengths of LAA′ and LBB′ within approximately 50 µm. In comparison, cells in Fibril-0-I might have a large discrepancy in LAA′ and LBB′ as the protrusions lengthened. The temporal lengths of Fibril-0-I are suggested to be less tightly controlled than Fibril-0-0, as seen by the more dispersed scatter pattern.
Figure 3.

(a,e) Scatter plots of LAA′ versus LBB′, where the arrows indicate the trend of the behaviour; (b,f) scatter plots of temporal length versus the magnitude of C-position shift, with division of three modes shown in the plots; (c,g) histograms of temporal lengths; (d,h) histograms of the magnitude of C-position shift fitted with a Logistic distribution; the fitting between Logistic (red fitting) and Normal (blue fitting) distributions are compared in the inset. For the above figures, the ones in the top row correspond to Fibril-0-0, and those in the bottom row are associated with Fibril-0-I.
To systematically describe the correlation between the temporal lengths and cell motility modes seen in figure 2, we construct scatter plots of C-position shift versus temporal protrusion lengths (including both LAA′ and LBB′). As LAA′ is invariant to LBB′, we deduce that such an analysis strategy is valid. Figure 3b,f indicates that an individual scatter plot can be partitioned into three regions separated by length = 125 µm and C-position shift = 200 µm. For Fibril-0-0 in figure 3b, the majority of behaviours are located within Region-1, which consists of the Type-1A and Type-1B modes as discussed earlier. A small number of events is also seen in Region 2, which characterize the Type-2 behaviour. A histogram of the temporal protrusion lengths in figure 3c indicates the most likely length to be approximately 10−15 µm. As the adhesive feature on either direction of the fibril is the same, the most likely C-position shift is expected to be 0 and is also confirmed in figure 3d. Moving onto Fibril-0-I in figure 3f, the data points all lie in the lower half of Regions 1 and 3, which contain the Type-1A and Type-3 modes, respectively (i.e. modes of weak motility and long protrusion lengths). A histogram of the temporal protrusion lengths in figure 3g shows a modal length of approximately 20−25 µm. The modal C-position shift is again at 0, as shown in figure 3h. Cross-comparing the scatter plots of Fibril-0-0 and Fibril-0-I, one notes that for C-position shift below approximately 50 µm, the temporal lengths of protrusions seem to be uncorrelated with the C-position shift even for temporal lengths more than 125 µm. However, for Fibril-0-0, of which C-position shift takes place for long displacements, short temporal lengths are favoured.
3.3. Speed of protrusion extension and retraction
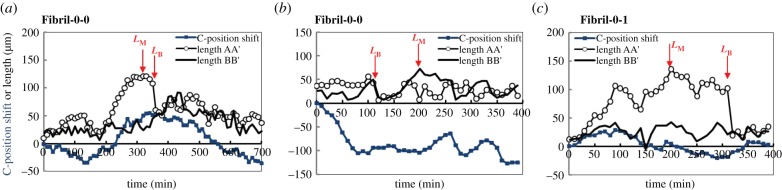
As previously demonstrated in figure 2, a protrusion could undergo intermittent extension and retraction during the cell migration. The temporal length traces show that a continuous extension/retraction process typically lasts for over 30 min. Hence, to account for random fluctuation in the length measurement, a three-point average velocity (equivalent to 30 min duration) of temporal length variation is considered at each time point (i.e. 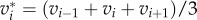 and
and  , where Li is the temporal length of either LAA′ or LBB′ at the time point ti). Therefore, a velocity of a positive sign will be associated with an extending protrusion, and a negative sign will be associated with a contracting protrusion.
Figure 4a,b shows the histogram of the temporal protrusion velocity for Fibril-0-0 and Fibril-0-I, respectively. One significant difference between Fibril-0-0 and Fibril-0-I is the range of the magnitude of protrusion velocity. For Fibril-0-0, the speed values rarely exceed 2 µm min−1, with a modal speed at 0 µm min−1 (i.e. no change in length over an averaging 30 min period) and a mean speed at 0.4 µm min−1. For Fibril-0-I, the speed values can reach beyond 20 µm min−1, with a modal speed again at 0 µm min−1 and a mean speed of 4 µm min−1, which is 10 times that of Fibril-0-0.
Figure 4.
(a,b) Histograms of protrusion velocity for Fibril-0-0 and Fibril-0-I, respectively. The shaded area in each histogram indicates a 50% population. (c,d) Maps of protrusion velocity versus temporal length for Fibril-0-0 and Fibril-0-I, respectively, where the colour scale indicates the number of occurring events. It is to note that a positive velocity indicates protrusion extension, and a negative velocity indicates retraction. The trend of change in protrusion velocity w.r.t. length is indicated by black arrows.
The correlation between the temporal protrusion length (LAA′ or LBB′) and velocity is of particular interest as illustrated in figure 4c,d. The colour level of each map indicates the differing number of events occurring at specific ranges of protrusion length and speed. As an overview of these two maps, one observes that cells in Fibril-0-I exhibited longer protrusions accompanied by higher protrusion retraction/extension speed than Fibril-0-0. For Fibril-0-0, the map is relatively symmetrical with respect to velocity = 0 µm min−1. This means that both the retraction and the extension speed follow similar relationship with the temporal protrusion length; also, they are comparable in magnitude for the same temporal length. It is important to note that the protrusion speed tends to decrease as the temporal length increases. Hence, a protrusion might exhibit a maximum length as its speed approached 0 µm min−1. In comparison, Fibril-0-I displayed a very different pattern of temporal length versus velocity profile. For contracting protrusions, the speed of retraction monotonically decreases for increased protrusion length as the case for Fibril-0-0. However, for the extending protrusions, there seems to be two regimes: the protrusion extension speed first increases for temporal lengths up to approximately 50 µm, after which a decreasing trend is observed. The extension speed at this turning point is approximately 10 µm min−1. For small protrusion lengths, the speed of retraction is higher than extension. The protrusion length at which a crossover between the retraction and extension speeds occurs is approximately 30 µm. Therefore, under ROCK inhibition, protrusions having temporal lengths between approximately 30 and 50 µm were capable to further lengthen.
3.4. Implication
The first point to be discussed is the cell motility. If an endothelial cell performed random one-dimensional migration on the fibril, the resultant C-position histogram in figure 3d,h should have the form of a half-normal distribution. However, the histograms are found to be better fitted with a half-logistic distribution to account for the events occurring at larger values of position shifts (especially for Fibril-0-0). It is likely that the fibril might give rise to enhanced persistency for cell migration. As a consequence, a heavier tail is seen in the probability distribution. The mean value of C-position shift is similar for Fibril-0-0 (22 µm) and Fibril-0-I (24 µm). However, the probability for a cell to have its C-position shift greater than 50 µm (i.e. an approximate size of the cell body) is 15% for Fibril-0-0, higher than the 5% for Fibril-0-I. As demonstrated previously, a persistent migration mode (shown in figure 2f) was only observed for Fibril-0-0. The associated migration speed of approximately 1 µm min−1, interestingly, is comparable to the 60 µm h−1 (1 μm min−1) speed found for fibroblast migration in a three-dimensional collagen gel [16]. Therefore, we postulate that these ‘rare’ endothelial migratory modes imply the inherent capability for the endothelial cells to be mobilized for events such as wound healing and angiogenesis. This persistent migration mode is mostly associated with protrusion lengths shorter than 50 µm as shown in figure 3a, though we cannot make a definite conclusion on whether long protrusions slow down migration.
Our results show that the overall protrusion extension speed of Fibril-0-0 (mean speed approx. 0.4 µm min−1) is lower than Fibril-0-I (mean speed approx. 4 µm min−1). Mogilner et al. [28] theoretically estimated the speed of protrusion extension to be 0.05–0.1 µm s−1 (3–6 µm min−1). This was modelled based on an unsupported protrusion reaching a maximum length of 10 µm [28]. These authors [28] suggested that for protrusion lengths exceeding 10 µm, the bundling of actin would be significantly limited by G-actin diffusion. Coming back to our study, it is known that ROCK-driven actomyosin contractility was required for retraction of the protrusion [23]; upon inhibition of ROCK, the retraction was blocked or delayed. Our finding seems to suggest that retraction activated by actomyosin seems to be a more pronounced factor regulating the speed of protrusion extension than G-actin diffusion. This may explain the enhanced rate of protrusion and the bigger temporal length, when comparing Fibril-0-I to Fibril-0-0 samples. Our results further suggest that for Fibril-0-I, deregulation in ROCK-driven contractility could lead to unmatched speed of protrusion extension versus retraction, thus leading to higher rate of growth, resulting in enhanced temporal lengths.
3.5. Protrusion breakage characteristics
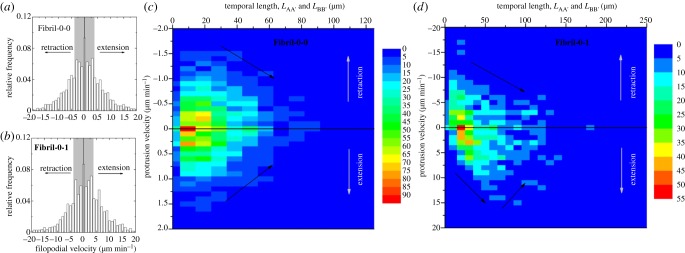
In figure 1f, we have demonstrated that in addition to constant variation in the protrusion length as a cell migrated, its protrusion could also experience breakage. To characterize this process, two characteristic lengths will be studied. First, the maximum length of protrusions during the course of image acquisition, LM; secondly, the length of the visible protrusion before its breakage, LB. Typical migration and temporal length traces associated with the breakage events are shown in figure 5a,b for Fibril-0-0 and figure 5c for Fibril-0. LM and LB are indicated on the corresponding traces. Two points are to be emphasized. Firstly, on the same cell, protrusion breakage does not necessarily need to happen on the protrusions which experience LM (cf. figure 5a versus 5b). Secondly, after breakage, a sharp drop in length was observed. The sudden length decrease could be an effect of release/relaxation in residual tension in the protrusion. At breaking, the cell was relatively stationary (as reflected by the shallow slope of C-position shift w.r.t. time trace). The stationary behaviour can be an indication of the ‘confusion’ state of the cell to designate a leading edge. Post-breakage, the cell might start relatively directed migration (Type-2 mode) like case (a), or resume position shifting (Type-1A mode) as in case (b) and (c).
Figure 5.
Typical time traces of C-position shift, LAA′ and LBB′ overlapped in the same plot for Fibril-0-0 in (a,b) and for Fibril-0-I in (c). It is of note that in these plots, LAA′ and LBB′ are arbitrary and the protrusion which experiences breakage is designated as LAA′. The point at which LM or LB occurs is also indicated in each figure. (Online version in colour.)
Histograms summarizing the distributions of LM and LB are shown in figure 6a,d,g,b,e,h. Here, the reference sample, which involves cells on featureless PDMS (Ref-0-0), is also illustrated. By comparing the LM results for the three cases, it is found that interaction with a fibril did not significantly alter the distribution of LM for the untreated cells. Both Fibril-0-0 and Ref-0-0 have a modal LM of approximately 50 µm, though Fibril-0-0 may exhibit a bimodal distribution showing a secondary peak at approximately 75 µm. In comparison, Fibril-0-I shows significantly wider range of LM. There also seem to be two peaks in the distribution, with a major one at LM ∼ 60 µm and a secondary one at LM ∼ 90 µm. Extremely long protrusions with LM > 150 µm were also present, which were not observed for Fibril-0-0 and Ref-0-0. For Fibril-0-0 and Fibril-0-I, the major modal LM is approximately 30 µm longer than that of their respective temporal lengths (see figure 3b,f).
Figure 6.

(a,d,g) Histograms showing the distribution of LM for Ref-0-0, Fibril-0-0 and Fibril-0-I, respectively; (b,e,h) the corresponding histograms for LB; (c,f,i) the corresponding fracture likelihood; the red-line drawn at y = 0 indicates no protrusion breakage. (j) Plot of LB against LM using the results from all three cases. (Online version in colour.)
Breakage is observed for approximately one in 10 cells for all the three cases (sampling cell number N = 73 for Ref-0-0, N = 203 for Fibril-0-0, N = 132 for Fibril-0-I). As the breaking events were relatively rare, and the statistics were obtained by manual observation, a precise probability is not stated here. Figure 6b,e,h shows that breakage can occur for various lengths. It is important to note that this LB distribution does not give a true reflection of correlation between the probability of breakage and length. This is because, as seen in figure 3c,g, the probability of having protrusions of large temporal lengths diminishes as a protrusion becomes greater than approximately 25 µm. This leads us to investigate whether there is a correlation between the possession of large LM and the likelihood of protrusion fracture. A parameter, ‘fracture likelihood’ is established as follows. If one defines the number of cells possessing a specific range of LM as  , and out of this
  number of cells,
  cells experienced protrusion breakage, then fracture likelihood is
  . It is again worth emphasizing here that for a cell which experienced protrusion breakage, the particular protrusion which broke might or might not relate to the longest protrusion. In other words, the longest protrusion did not necessarily lead to the eventual breakage of the protrusion. The fracture likelihood is plotted against their corresponding LM in figure 6c,f,i. For Fibril-0-0, it is observed that having long protrusions increased the probability of fracture for LM > 80 µm. For Ref-0-0, the influence of LM on fracture is not obvious. In comparison, Fibril-0-I shows some positive dependence of breakage on LM up to approximately 150 µm. However, as LM increased beyond approximately 150 µm (i.e. the upper LM threshold for the untreated cells), the Fibril-0-I cells did not experience any protrusion fracture.
Finally, we investigate the correlation between LM and LB. By plotting LB against LM for the different cells in all these three cases, an interesting correlation is revealed. Figure 6j indicates that regardless of the treatment and interface, a majority of the (LM, LB) pairs scatter with respect to a straight line of LB = k × LM − L* (µm). k is the pre-factor and k ∼ 1; L* ∼ 10 µm is the interception at the y-axis. Based on this linear relationship, we may postulate that (i) for cells which experience protrusion breakage events, LB is most likely to be 10 µm shorter than LM. Re-surveying figure 5a–c, this seems to be indeed the case. (ii) For the trailing protrusions which are shorter than 10 µm, they can be effectively retracted without incurring breakage from cellular motility. This postulation is further supported by figure 3c,g, which show a good proportion of cells which can have protrusion lengths smaller than 10 µm; however, no LB is observed to have values in this range in figure 6e,h. It is interesting that the extrapolated value of L* coincides with the upper protrusion length predicted by the limitation in G-actin diffusion [28]. It may be the fact that only within this length scale, coordination in actin stress fibre formation with respect to cell motility can be dynamically regulated by polymerization and de-polymerization of actin filaments across the entire cell.
3.6. Implication
Fracture of the protrusions may be interpreted as a result of uncoordinated clustering of focal adhesion with respect to the retraction-lead cell motility [29]. The complete dissociation of actin filaments from the matured focal adhesion is possible, since recent studies have indicated a layered architecture of focal adhesions, where the focal adhesion kinase-associated integrins were vertically separated from the actin filament ends [30]. In this case, approximately 5 µm patch break-off from the protrusions seemed to suggest that multiple focal adhesions of less than 200 nm [26] were contained. We suggest that the dipolar morphology of the Fibril-0-0 had resulted in a more pronounced dependence of fracture on LM for large LM (comparing figure 6c,f), because all the force components causing the tension were acting along the same line. This contrasts with Ref-0-0, which had a more rounded cell morphology. On the other hand, for Fibril-0-I, cells with longer LM under ROCK inhibition were expected to produce weaker actin filament bundles in the protrusion interior, but at the same time retaining lower levels of contractility [23,24]. Balancing these two factors, it is possible that a transition in behaviour occurred such that cells with abnormally long LM demonstrated no protrusion breakage (cf. figure 6i).
For both Fibril-0-0 and Fibril-0-I, directed protrusion tips were initiated by the gelatin fibrils. In other words, the inherent ability of protrusions to interact with the substratum was not affected by the decrease in the ROCK-driven actomyosin contractility induced by the H1152 treatment. This postulation is supported by the fact that extremely long protrusions LM > 100 µm would have consumed substantial actin monomers; and, second, by the fact that for LM > 150 µm, breakage of protrusions was not observed. Both of these suggest unregulated distribution of actin across the cell body and the lack of strong stress fibres for cell motility (as confirmed by the much reduced long-ranged migration illustrated before).
Close examination on the breakage process shows thinning (or ‘necking’) of the trailing protrusion prior to breakage. The sharp retraction at breaking shown in the temporal length traces in figure 5 also implies that tensile strain energy was stored in the protrusions prior to breakage. As the system is in quasi-equilibrium, one can evaluate the protrusion pulling force (Fp) exerted on the fibril, which is assumed to be locally transmitted via approximately 5 µm adhesive patch. Under these conditions, we can postulate 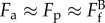 . Here,
  is the tensile breaking force for a filopodial-like protrusion; Fa is the attachment force provided by the integrin clusters at the adhesion patch. Taking the force per unit area (fa) of the adhesion patch as 300 dyne cm−2 (3 × 10⁻¹¹ N µm−2) [31] and the area (A) of the patch as 20 µm2 (i.e. approx. 5 µm diameter), the adhesive force Fa
∼ fa × A ∼ 6 × 10⁻¹⁰ N, and thus the upper limit of
is the tensile breaking force for a filopodial-like protrusion; Fa is the attachment force provided by the integrin clusters at the adhesion patch. Taking the force per unit area (fa) of the adhesion patch as 300 dyne cm−2 (3 × 10⁻¹¹ N µm−2) [31] and the area (A) of the patch as 20 µm2 (i.e. approx. 5 µm diameter), the adhesive force Fa
∼ fa × A ∼ 6 × 10⁻¹⁰ N, and thus the upper limit of  N. Separately, the breaking force for a single actin filament (10–30 µm long, 7 nm in diameter) has been experimentally determined to be approximately 10−10 N under isometric tension [32]. Hence, it is postulated that fewer than 10 actin filaments had remained in the ‘neck’ of the protrusion prior to breakage.
4. Conclusion
In this study, we have investigated the behaviour of endothelial cells on NFES gelatin fibrils as a model system to recapitulate the endothelium–ECM interaction. Our analysis suggests that cellular migration along a gelatin fibril is accompanied by filopodial-like protrusion extension and retraction. When interfaced with a fibril, cells adopt a bipolar morphology with extended protrusions at both ends. Different modes of cell motility versus temporal protrusion lengths are identified under normal culture and ROCK inhibition. Type-1A mode is characterized by weak displacement along with relatively short protrusions (mostly less than 50 µm); Type-1B mode is characterized by the more distinct and regular oscillatory movements between displacement and short protrusions; further, Type-2 mode is seen to be associated with persistent migration; and, finally, Type-3 corresponds to weak motility along with long protrusions (more than 125 μm). Fibril-0-0 is shown to exhibit Type-1A and B, and Type-2 behaviours, whereas Fibril-0-I is shown to possess Type-1A and Type-3 behaviours. Analysing the patterns of protrusion length versus cell displacement seems to indicate that short protrusions better facilitate cell motility. ROCK inhibition, which significantly increased the temporal protrusion lengths, did not apparently alter the mean value of cell displacement (22−24 μm); however, it had reduced the probability of long-ranged cell migration (i.e. C-position shift more than 50 μm). Measuring the protrusion velocity indicates that the speeds of extension and retraction have very different distributions between the Fibril-0-0 and Fibril-0-I cases. For Fibril-0-I, a much wider range of speeds is observed with an asymmetrical distribution between the extension and retraction processes. The rate of protrusion length change of Fibril-0-I is on average 10 times that of the Fibril-0-0.
Occasional protrusion breakage is observed during cell motility, while its implication and the resulting effects on membrane integrity are still to be investigated. It is noted that during the experiments, we also observe cases of subsequent internalization of the broken protrusion fragments by another cell (which resembles endocytosis). According to our results, protrusion breakage can occur on a variety of lengths (from 20 µm to over a 100 µm). A positive dependence between the likelihood of breakage and LM seems to result for both Fibril-0-0 and Fibril-0-I up to LM = 150 µm. However, owing to the relatively small number of breakage events observed, a conclusive probability of breakage is not determined here. Nevertheless, by investigating the correlation between LM and LB, a limiting breakage length L* ∼ 10 µm is extrapolated. Therefore, we postulate that when a trailing protrusion has lengths lower than L*, they can be effectively retracted during cell motility without breakage. Overall, our results suggest that characteristic lengths of endothelial protrusions, LM and LB, can act as indicators for cellular contractility. In addition, NFES of one-dimensional ECM fibrils provides a simple and well-controlled model to recapitulate fibril topography. In particular, our data show that for the case of persistent migration on fibrils, endothelial cells can proceed with a migration speed of approximately 1 µm min−1, similar to fibroblast migration in a three-dimensional collagen gel. Future studies which involve comparison to in vivo systems are important to further validate the fibrils’ physiological relevancy. Optimization in the NFES fibril-based culture to include a combination of different fibril diameters and adhesive molecules will improve its bio-mimicry. Such a system may potentially allow the study of a variety of cell types including human origin, and also facilitate the ease of data analysis for potential high-throughput applications.
Acknowledgement
The authors thank M. Locard Paulet and C. Jorgensen for advising on cell staining and supplier of EA.hy926 cells; and E. Sahai, N.C.L. Gauthier, M. Oyen and A. Kabla for helpful discussions.
Funding statement
YYSH was supported by an Oppenheimer Research Fellowship, a Homerton College Fellowship, and a Department of Engineering (Cambridge) Starting Grant. CB was supported by Fondazione Angelo della Riccia and Christ's College.
References
- 1.Stevens MM, George JH. 2005. Exploring and engineering the cell surface interface. Science 310, 1135–1138. ( 10.1126/science.1106587) [DOI] [PubMed] [Google Scholar]
- 2.Lutolf M, Hubbell J. 2005. Synthetic biomaterials as instructive extracellular microenvironments for morphogenesis in tissue engineering. Nat. Biotechnol. 23, 47–55. ( 10.1038/nbt1055) [DOI] [PubMed] [Google Scholar]
- 3.Kim D, Wong P, Park J, Levchenko A, Sun Y. 2009. Microengineered platforms for cell mechanobiology. Annu. Rev. Biomed. Eng. 11, 203–233. ( 10.1146/annurev-bioeng-061008-124915) [DOI] [PubMed] [Google Scholar]
- 4.Mattila P, Lappalainen P. 2008. Filopodia: molecular architecture and cellular functions. Nat. Rev. Mol. Cell Biol. 9, 446–454. ( 10.1038/nrm2406) [DOI] [PubMed] [Google Scholar]
- 5.De Smet F, Segura I, De Bock K, Hohensinner P, Carmeliet P. 2009. Mechanisms of vessel branching: filopodia on endothelial tip cells lead the way. Arterioscler. Thromb. Vasc. Biol. 29, 639–649. ( 10.1161/ATVBAHA.109.185165) [DOI] [PubMed] [Google Scholar]
- 6.DeLisser H. 2011. Modulator of endothelial cell filopodia. Cell Adhes. Migration 5, 37–41. ( 10.4161/cam.5.1.13575) [DOI] [PMC free article] [PubMed] [Google Scholar]
- 7.Lamalice L, Le Boeuf F, Huot J. 2007. Endothelial cell migration during angiogenesis. Circ. Res. 100, 782–794. ( 10.1161/01.RES.0000259593.07661.1e) [DOI] [PubMed] [Google Scholar]
- 8.Gerhardt H, et al. 2003. VEGF guides angiogenic sprouting utilizing endothelial tip cell filopodia. J. Cell Biol. 161, 1163–1177. ( 10.1083/jcb.200302047) [DOI] [PMC free article] [PubMed] [Google Scholar]
- 9.Wacker A, Gerhardt H. 2011. Endothelial development taking shape. Curr. Opin. Cell Biol. 23, 676–685. [DOI] [PubMed] [Google Scholar]
- 10.Lei Y, Zouani O, Murielle R, Ayela C, Durrieu M. 2012. Geometrical microfeature cues for directing tubulogenesis of endothelial cells. PLoS ONE 7, e41163 ( 10.1371/journal.pone.0041163) [DOI] [PMC free article] [PubMed] [Google Scholar]
- 11.Yamaguchi H, Wyckoff J, Condeelis J. 2005. Cell migration in tumors. Curr. Opin. Cell Biol. 17, 559–564. ( 10.1016/j.ceb.2005.08.002) [DOI] [PubMed] [Google Scholar]
- 12.Chen P, Cescon M, Bonaldo P. 2013. Collagen VI in cancer and its biological mechanisms. Trends Mol. Med. 19, 410–417. ( 10.1016/j.molmed.2013.04.001) [DOI] [PubMed] [Google Scholar]
- 13.Dike L, Chen C, Mrksich M, Tien J, Whitesides G, Ingber D. 1999. Geometric control of switching between growth, apoptosis, and differentiation during angiogenesis using micropatterned substrates. In Vitro Cell. Dev. Biol. Anim. 35, 441–448. ( 10.1007/s11626-999-0050-4) [DOI] [PubMed] [Google Scholar]
- 14.Lei Y, Zouani O, Rami L, Chanseau C, Durrieu M. 2012. Modulation of lumen formation by microgeometrical bioactive cues and migration mode of actin machinery. Small 9, 1086–1095. ( 10.1002/smll.201202410) [DOI] [PubMed] [Google Scholar]
- 15.Azioune A, Storch M, Bornens M, Thry M, Piel M. 2009. Simple and rapid process for single cell micro-patterning. Lab Chip 9, 1640–1642. ( 10.1039/b821581m) [DOI] [PubMed] [Google Scholar]
- 16.Doyle A, Wang F, Matsumoto K, Yamada K. 2009. One-dimensional topography underlies three-dimensional fibrillar cell migration. J. Cell Biol. 184, 481–490. ( 10.1083/jcb.200810041) [DOI] [PMC free article] [PubMed] [Google Scholar]
- 17.Maiuri P, et al. 2012. The first world cell race. Curr. Biol. 22, R673–R675. ( 10.1016/j.cub.2012.07.052) [DOI] [PMC free article] [PubMed] [Google Scholar]
- 18.Thery M. 2010. Micropatterning as a tool to decipher cell morphogenesis and functions. J. Cell Sci. 123, 4201–4213. ( 10.1242/jcs.075150) [DOI] [PubMed] [Google Scholar]
- 19.Sun D, Chang C, Li S, Lin L. 2006. Near-field electrospinning. Nano Lett. 6, 839–842. ( 10.1021/nl0602701) [DOI] [PubMed] [Google Scholar]
- 20.Huang Y, Terentjev E, Oppenheim T, Lacour S, Welland M. 2012. Fabrication and electromechanical characterization of near-field electrospun composite fibers. Nanotechnology 23, 105305 ( 10.1088/0957-4484/23/10/105305) [DOI] [PubMed] [Google Scholar]
- 21.Frushour B, Koenig J. 1975. Raman scattering of collagen, gelatin, and elastin. Biopolymers 14, 379–391. ( 10.1002/bip.1975.360140211) [DOI] [PubMed] [Google Scholar]
- 22.Shoulders M, Raines R. 2009. Collagen structure and stability. Annu. Rev. Biochem. 78, 929–958. ( 10.1146/annurev.biochem.77.032207.120833) [DOI] [PMC free article] [PubMed] [Google Scholar]
- 23.Riento K, Ridley A. 2003. Rocks: multifunctional kinases in cell behaviours. Nat. Rev. Mol. Cell Biol. 4, 446–546. ( 10.1038/nrm1128) [DOI] [PubMed] [Google Scholar]
- 24.Maekawa M, et al. 1999. Signaling from rho to actin cytoskeleton through protein kinases ROCK and LIM-kinase. Science 285, 895–898. ( 10.1126/science.285.5429.895) [DOI] [PubMed] [Google Scholar]
- 25.Zhang S, Huang Y, Yang X, Mei F, Ma Q, Chen G, Ryu S, Deng X. 2009. Gelatin nanofibrous membrane fabricated by electrospinning of aqueous gelatin solution for guided tissue regeneration. J. Biomed. Mater. Res. A 90A, 671–679. ( 10.1002/jbm.a.32136) [DOI] [PubMed] [Google Scholar]
- 26.Pouthas F, Girard P, Lecaudey V, Ly T, Gilmour D, Boulin C, Pepperkok R, Reynaud E. 2008. In migrating cells, the Golgi complex and the position of the centrosome depend on geometrical constraints of the substratum. J. Cell Sci. 121, 2406–2414. ( 10.1242/jcs.026849) [DOI] [PubMed] [Google Scholar]
- 27.Petroll W, Ma L. 2003. Direct, dynamic assessment of cell-matrix interactions inside fibrillar collagen lattices. Cell Motil. Cytoskeleton 55, 254–264. ( 10.1002/cm.10126) [DOI] [PubMed] [Google Scholar]
- 28.Mogilner A, Rubinstein B. 2005. The physics of filopodial protrusion. Biophys. J. 89, 782–795. ( 10.1529/biophysj.104.056515) [DOI] [PMC free article] [PubMed] [Google Scholar]
- 29.Ridley A, Schwartz M, Burridge K, Firtel R, Ginsberg M, Borisy G, Parsons J, Horwitz A. 2003. Cell migration: integrating signals from front to back. Science 302, 1704–1709. ( 10.1126/science.1092053) [DOI] [PubMed] [Google Scholar]
- 30.Kanchanawong P, Shtengel G, Pasapera A, Ramko E, Davidson M, Hess H, Waterman C. 2010. Nanoscale architecture of interin-based cell adhesions. Nature 468, 580–584. ( 10.1038/nature09621) [DOI] [PMC free article] [PubMed] [Google Scholar]
- 31.Gallant N, Michael K, Garcia A. 2005. Cell adhesion strengthening: contributions of adhesive area, integrin binding, and focal adhesion assembly. Mol. Biol. Cell 16, 4329–4340. ( 10.1091/mbc.E05-02-0170) [DOI] [PMC free article] [PubMed] [Google Scholar]
- 32.Kishino A, Yanagida T. 1988. Force measurements by micromanipulation of a single actin filament by glass needles. Nature 334, 74–76. ( 10.1038/334074a0) [DOI] [PubMed] [Google Scholar]