

Abstract
Self-inactivating (SIN) lentiviral vectors (LV) have an excellent therapeutic potential as demonstrated in preclinical studies and clinical trials. However, weaker mechanisms of insertional mutagenesis could still pose a significant risk in clinical applications. Taking advantage of novel in vivo genotoxicity assays, we tested a battery of LV constructs, including some with clinically relevant designs, and found that oncogene activation by promoter insertion is the most powerful mechanism of early vector-induced oncogenesis. SIN LVs disabled in their capacity to activate oncogenes by promoter insertion were less genotoxic and induced tumors by enhancer-mediated activation of oncogenes with efficiency that was proportional to the strength of the promoter used. On the other hand, when enhancer activity was reduced by using moderate promoters, oncogenesis by inactivation of tumor suppressor gene was revealed. This mechanism becomes predominant when the enhancer activity of the internal promoter is shielded by the presence of a synthetic chromatin insulator cassette. Our data provide both mechanistic insights and quantitative readouts of vector-mediated genotoxicity, allowing a relative ranking of different vectors according to these features, and inform current and future choices of vector design with increasing biosafety.
Introduction
Lentiviral vectors (LVs) with self-inactivating (SIN) long terminal repeats (LTRs) have been shown to pose a lower risk of insertional mutagenesis with respect to γ-retroviral vectors.1,2,3,4,5 Importantly, therapeutic efficacy of LVs has also been shown in clinical trials for the therapy of adrenoleukodystrophy,6 metachromatic leukodystrophy, and Wiskott–Aldrich syndrome, without detectable adverse genotoxic events at the latest molecular follow-up in treated patients.7,8 However, despite the encouraging results obtained in clinical trials, a longer follow-up is required to fully confirm the safety of LV integration. Moreover, there is cumulating evidence that SIN LVs are not entirely neutral because they may upregulate the expression of genes flanking the integration site, especially when carrying strong enhancer/promoter sequences in internal positions,1,2,3,4,9 or induce aberrant splicing and/or premature termination of endogenous transcripts of the targeted gene and cause loss-of-function or gain-of-function mutations.1,10,11,12,13,14 Thus, it is possible that, when large numbers of transduced cells are infused into long-living humans, insertional mutagenesis events that could provide delayed and/or reduced risk of tumor onset could arise even when SIN LVs are used.
Several modifications of the LV backbone have been proposed to further increase safety. These include (i) the recoding of vector splice sites and the polyadenylation site of the LTR to avoid vector-induced aberrant splicing and read-through transcription from the integrated provirus into neighboring genes12,13 or (ii) the inclusion of chromatin insulators to block the enhancer-mediated activation of cancer genes.9,15,16,17
Therefore, it is important to understand whether SIN LVs may trigger oncogenesis in the long term, what are the relevant mechanisms of insertional mutagenesis, and the features that should be eventually modified to increase the safety profile of LV integration in vivo. With this aim, we developed and validated two sensitive in vivo genotoxicity assays based on systemic vector injection in newborn tumor-prone Cdkn2a−/− or Cdkn2a+/− mice and tested a battery of LVs with different designs, including therapeutically relevant ones and one containing a validated synthetic chromatin insulator cassette. We show that SIN LVs with therapeutically relevant enhancer/promoters in internal positions are genotoxic in our sensitized mouse models by insertional mutagenesis. Importantly, the mechanism of insertional mutagenesis dictates the culprits of oncogenesis and the time of tumor onset. Finally, we show that the inclusion of an engineered chromatin insulator cassette effectively diminishes the capability of an LV to activate oncogenes by enhancer-mediated mechanisms. However, escape mechanisms of genotoxicity, such as inactivation of tumor suppressors, are present even when insulator sequences are used.
Results
Systemic LV injection in newborn tumor-prone mice induced histiocytic sarcomas
To uncover and study the residual genotoxicity of LV integration, we set up a novel in vivo genotoxicity assay based on tumor-prone mice in which the genotoxic insult was provided at newborn age, thus widening the window for monitoring accelerated oncogenesis. Because recipient conditioning and hematopoietic stem and progenitor cell transplantation is complex in newborn mice, we delivered the vector by systemic injection that would target mainly the liver, an active hematopoietic organ in mice at that age.
As positive control for genotoxicity readout, newborn Cdkn2a−/− mice (FVB and C57 strains) were injected with a genotoxic green fluorescent protein (GFP)–expressing LV carrying the strong spleen focus–forming virus (SF) enhancer/promoter sequences in the LTR (LV.SF.LTR).1 Moreover, double-knockout Cdkn2a−/−/Ifnar1−/− mice1,10 were used to evaluate if the higher permissiveness to LV transduction conferred by the Ifnar1 deficiency18 could result in an enhanced vector genotoxicity readout. To maximize our chances of achieving high transduction levels by systemic LV delivery, we injected the maximum possible volume (20 µl) of concentrated vector for each newborn mouse. Each mouse received 4 × 10⁷ HeLa transducing units of LV.SF.LTR by temporal vein injection (Figure 1a). All Cdkn2a-deficient uninjected mice (referred to as “mock injected” in the text) died between 140 and 460 days, with a similar median survival time among the different strains (median survival: 242 ± 16.8 days for all strains; Figure 1b). LV.SF.LTR-treated mice died significantly earlier with respect to their untransduced strain-matched controls and even to mice transplanted with Cdkn2a−/− hematopoietic stem and progenitor cells transduced with the same vector (P < 0.0001, log-rank Mantel–Cox test; Figure 1b), thus showing a widened time interval for tumor onset between treatment and control in this new model. All LV.SF.LTR-treated mice developed CD45+, CD3−, B220−, MPO−, F4/80+, and GFP+ hematopoietic tumors, mainly infiltrating the liver and the spleen (Figure 1c–e; Supplementary Table S1), a phenotype indicative of vector-marked histiocytic sarcomas (HS)19 (Figure 1f).
Figure 1.
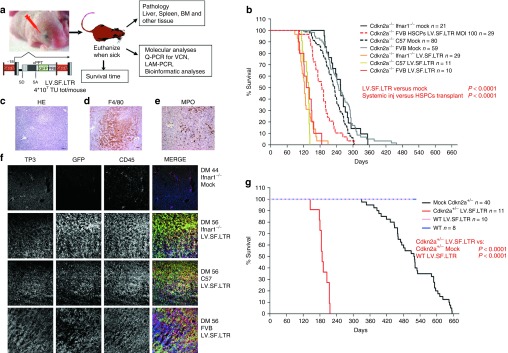
In vivo experimental strategy and Kaplan–Meier survival curves. (a) Experimental strategy. LV.SF.LTR vector was systemically administered to newborn Cdkn2a−/− mice by temporal vein injection. Mice are sacrificed when they displayed signs of illness, and bone marrow, spleen, liver, and other organs were harvested for blinded histopathology and molecular analyses; see Supplementary Methods for details. Scheme of the proviral forms of the LV.SF.LTR vector tested: SFFV: enhancer/promoter of the spleen focus–forming virus U3 LTR. SD, SA: viral splice donor/acceptor sites; cPPT, central polypurine tract. PRE, posttranscriptional regulatory element from the woodchuck hepatitis virus. Transgene transcript is indicated by arrows. (b) Kaplan–Meier survival curves of mock mice and mice injected with LV.SF.LTR vector (n = number of mice). All mock control mice died, with similar median survivals among the strains: 233 days for Cdkn2a−/− C57, 248 days for 10 Cdkn2a−/− FVB, and 255 days for Cdkn2a−/− Ifnar1−/−. All LV.SF.LTR-treated mice died significantly earlier (median survival: 138 days for Cdkn2a−/− C57, 135 days for 10 Cdkn2a−/− FVB, and 123 days for Cdkn2a−/− Ifnar1−/−) than their untransduced strain-matched controls (mock, P < 0.0001), and their survival was significantly shorter than that of mice transplanted with Cdkn2a−/− hematopoietic stem progenitor cells (HSPCs) transduced with the same vector (Cdkn2a−/− FVB HSPCs LV.SF.LTR MOI 100, red dashed line, 187 days median survival, P < 0.0001). (c) Representative example of hematoxylin-and-eosin-stained sections (original magnification ×10 ) of the liver infiltrated by hematopoietic tumor cells. (d,e) Immunohistochemical analysis (original magnification ×20) reveals that hematopoietic tumor cells infiltrating the liver are (d) F4/80+ and (e) MPO−. (f) Representative immunofluorescence-stained sections (original magnification ×20) of tumor-infiltrated liver. Each row represents a single mouse. Immunofluorescence analysis of liver from an untreated Cdkn2a−/−Ifnar−/− mouse (first row) and from tumor-infiltrated liver from the different strains of Cdkn2a−/− mice injected with LV.SF.LTR. In column order, from left to right: TO-PRO3, for nuclei (TP3); green fluorescent protein (GFP) for vector marking, CD45 as pan-leukocyte marker; and merge of the three channels. GFP and CD45 costaining confirmed that the tumor infiltrating the liver in the LV.SF.LTR group of mice was of hematopoietic origin and vector marked. (g) Kaplan–Meier survival curves of Cdkn2a+/− and wild-type (WT) mice injected with LV.SF.LTR vector. Survival of Cdkn2a+/− mice injected with the highly genotoxic vector was significantly shorter (median survival of 188 days) than that of their untransduced strain-matched controls (mock, P < 0.0001); whereas WT mice injected with the same vector did not develop any tumor in the 520 days of observation.
We then tested the sensitivity to LV.SF.LTR genotoxicity of heterozygous Cdkn2a+/− and wild-type (WT) mice. Untreated Cdkn2a+/− succumbed to spontaneous tumors at advanced age, with a median survival time of 519 days (n = 40), whereas WT mice did not develop tumors until this age (n = 8; Figure 1g; Supplementary Table S1). Therefore, Cdkn2a heterozygosity significantly delays (P < 0.0001 versus Cdkn2a−/−) but does not abrogate tumor development (Cdkn2a+/− versus WT; P = 0.0074). LV.SF.LTR injection in newborn Cdkn2a+/− mice (n = 11, 6 × 10⁷ transducing units per mouse) induced an increased incidence of HS (100% LV.SF.LTR versus 71% mock) and an earlier tumor onset time with respect to untreated Cdkn2a+/− mice (P < 0.0001), which was however delayed with respect to the tumor onset time observed in LV.SF.LTR-treated homozygous Cdkn2a−/− mice (P < 0.0001). LV.SF.LTR injection in newborn WT mice (n = 10) did not affect mouse survival, indicating that two WT copies of the Cdkn2a allele are fully protective in these settings (Figure 1g; Supplementary Table S1).
Residual genotoxicity of LVs with SIN LTRs
Next, we investigated if SIN LVs could accelerate oncogenesis in homozygous or heterozygous Cdkn2a mutant mice. The vectors tested were the following: (i) SIN.LV.SF.GFP.PRE and SIN.LV.PGK.GFP.PRE, both of which scored neutral in the previous Cdkn2a−/− transplantation assay1,2; (ii) SIN.LV.SF.PRE, a SIN LV construct without GFP downstream of the SF promoter but maintaining the 3′-truncated open reading frame (ORF) of the Woodchuck posttranscriptional regulatory element (PRE); (iii) SIN.LV.SF, a SIN LV without any ORF (GFP or PRE) downstream of the SF sequences; and finally (iv) IDLV.SIN.LV.SF.GFP.PRE, an integrase-defective (IDLV) version of SIN.LV.SF.GFP.PRE to test if injection of viral proteins, DNA, and/or RNA per se could promote oncogenesis in our mouse models (Figure 2a). Vectors were injected into newborn Cdkn2a−/−C57 mice at a dose ranging from 1 × 10⁸ to 4 × 10⁸ transducing units per mouse (Supplementary Table S1).
Figure 2.
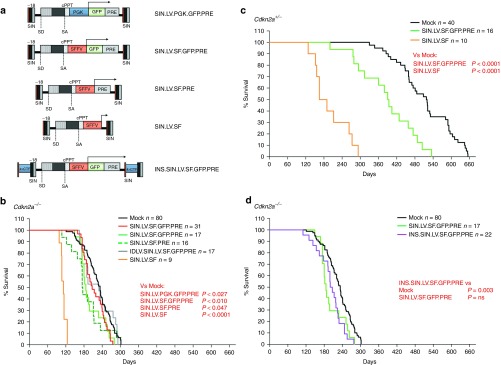
Vectors tested and Kaplan–Meier survival curves of mice treated with Cdkn2a−/− and Cdkn2a+/−. (a) Scheme of the proviral forms of the SIN LVs systemically administered to newborn Cdkn2a−/− or Cdkn2a+/− mice by temporal vein injection. The strategy has been described in Figure 1a; SIN: self-inactivating long terminal repeats; SFFV: enhancer/promoter of the spleen focus–forming virus. SD, SA: viral splice donor/acceptor sites. cPPT, central polypurine tract; PRE, posttranscriptional regulatory element from the woodchuck hepatitis virus. 4xCTF: insulator sequences made by four CAAT-box binding transcription factor (CTF) binding sites. Transgene transcript is indicated by arrows. (b–d) Kaplan–Meier survival curves of (b,d) Cdkn2a−/− and (c) Cdkn2a+/− mice injected with the indicated vector (n = number of injected mice for each group). Survival of SIN.LV.SF-treated mice was significantly shorter than that of their untransduced strain-matched controls (P < 0.0001, for both Cdkn2a−/−- and Cdkn2a+/−-injected mice, median survival: 112 and 178 days, respectively). For SIN LVs, survival of SIN.LV.PGK.GFP.PRE-, SIN.LV.SF.GFP.PRE-, and SIN.LV.SF.PRE-treated mice was shorter than that of their untransduced strain-matched controls (in Cdkn2a−/−, P = 0.027 for SIN.LV.PGK.GFP.PRE and median survival of 207 days; P = 0.01 for SIN.LV.SF.GFP.PRE and 186 days; P = 0.047 for SIN.LV.SF.PRE and 175 days; P = 0.003 for INS.SIN.LV.SF.GFP.PRE and 203 days; and in Cdkn2a+/−, P < 0.0001 for SIN.LV.SF.GFP.PRE and 392 days).
Cdkn2a−/− and Cdkn2a+/− mice treated with SIN.LV.SF.GFP.PRE (n = 17 and n = 16, respectively) and Cdkn2a−/− treated with SIN.LV.SF.PRE (n = 16) developed HS significantly earlier than genotype-matched mock-treated mice (P = 0.0095 versus mock Cdkn2a−/−; P < 0.0001 versus mock Cdkn2a+/−; and P = 0.047 for Cdkn2a−/− SIN.LV.SF.PRE treated versus mock; Figure 2b,c) and significantly later than LV.SF.LTR-injected mice (SIN.LV.SF.GFP.PRE versus LV.SF.LTR; P < 0.0001 for both genotypes; Figure 1b,g). In Cdkn2a−/− mice, SIN.LV.PGK.GFP.PRE (n = 31) injection induced a slight but significant acceleration of tumor onset with respect to Cdkn2a−/− mock-treated mice (P = 0.027 versus mock). On the other hand, treatment with SIN.LV.SF (an ORF-less SIN LV) induced a strong acceleration of tumor onset in both Cdkn2a−/− (n = 9; P < 0.0001 versus genotype-matched mock) and Cdkn2a+/− mice (n = 10; P < 0.0001 versus genotype-matched mock), similarly to LV.SF.LTR with active LTRs (Figure 2b,c). Finally, no acceleration in tumor onset was observed in Cdkn2a−/− mice (n = 17) injected with the IDLV.SIN.LV.SF.GFP.PRE (Figure 2b). Cdkn2a−/− or Cdkn2a+/− mice treated with integration-competent SIN LVs developed mainly HS (>88.8% of HS; Supplementary Table S1 and Supplementary Figure S1). Conversely, IDLV- and mock-treated Cdkn2a−/− or Cdkn2a+/− mice developed both lymphomas and HS (57.6% of HS) with a significantly lower incidence of HS with respect to vector-treated Cdkn2a−/− mice (P = 0.0013; Fisher's exact test; Supplementary Table S1).
Testing the genotoxicity of an LV containing a synthetic chromatin insulator cassette
We then tested if the safety of SIN LVs could be improved by the use of chromatin insulator sequences. We thus cloned a validated synthetic chromatin insulator element composed of four CAAT-box binding transcription factor binding sites in the ∆U3 of the 3′ LTR of the SIN.LV.SF.GFP.PRE (INS.SIN.LV.SF.GFP.PRE; Figure 2a). Injection of INS.SIN.LV.SF.GFP.PRE induced an earlier tumor onset with respect to mock-treated mice (P value = 0.003; Figure 2d and Supplementary Table S1) and their median survival time was 17.5 days longer with respect to mice injected with the noninsulated counterpart, indicating that the inclusion of the insulator was able to slightly reduce but not abrogate the genotoxicity of this vector.
Vector integration analysis and identification of common insertion sites
We characterized the LV integration sites in tumor-infiltrated livers (Cdkn2a−/−, n = 99; Cdkn2a+/−, n = 29) and spleens (Cdkn2a−/−, n = 28) from the different groups of vector-injected mice to find the culprits of oncogenesis. In addition, we retrieved integration sites from tumors previously harvested from 70 mice transplanted with Cdkn2a−/− hematopoietic stem and progenitor cells transduced with either LV.SF.LTR or SIN.LV.SF.GFP.PRE1 to compare the molecular culprits of insertional mutagenesis with those found in HSs induced by the same vector on systemic injection.
Vector copy number in tumor-infiltrated tissues was highly variable (vector copy number range = 0.2–60) in most experimental groups, probably reflecting the expansion of clonal tumor from cells transduced at high variable levels by the systemic injection approach (Supplementary Figure S2). LV/genomic junctions were retrieved by linear amplification–mediated polymerase chain reaction (PCR), sequenced by 454-pyrosequencing, mapped on the mouse genome, and the nearest RefSeq gene was identified (Supplementary Tables S2 and S3). Overall, we retrieved >12,600 unique integration sites. All integration data sets displayed the characteristic LV integration profile within genes, without any bias, to target regulatory regions (Supplementary Figure S3).
Common insertion sites (CISs) are genomic intervals targeted by vector integrations at a frequency significantly higher than the expected rate. In tumors, CISs map near or within genes that are putative culprits of genotoxicity, thus allowing their identification. To identify CISs in our data sets, we used a two-step validation approach, as recently described.7,8 First, CISs were identified by the algorithm described by Abel et al.20,21 (based on Monte Carlo simulations) to evaluate the significance of integration clustering within defined genomic windows (Supplementary Tables S3 and S4). Then, the Grubbs test for outliers7,8,22 was used to select the most significant CISs identified by the Abel's method (Supplementary Materials and Methods). By combining these statistical approaches, we identified a total of n = 96 (nonredundant, n = 79) CIS-associated genes (CIS genes) distributed among the different vector treatment groups (Table 1).
Table 1. List of the common insertion site genes identified in Cdkn2a−/− and Cdkn2a+/− mice treated with the different vectors.
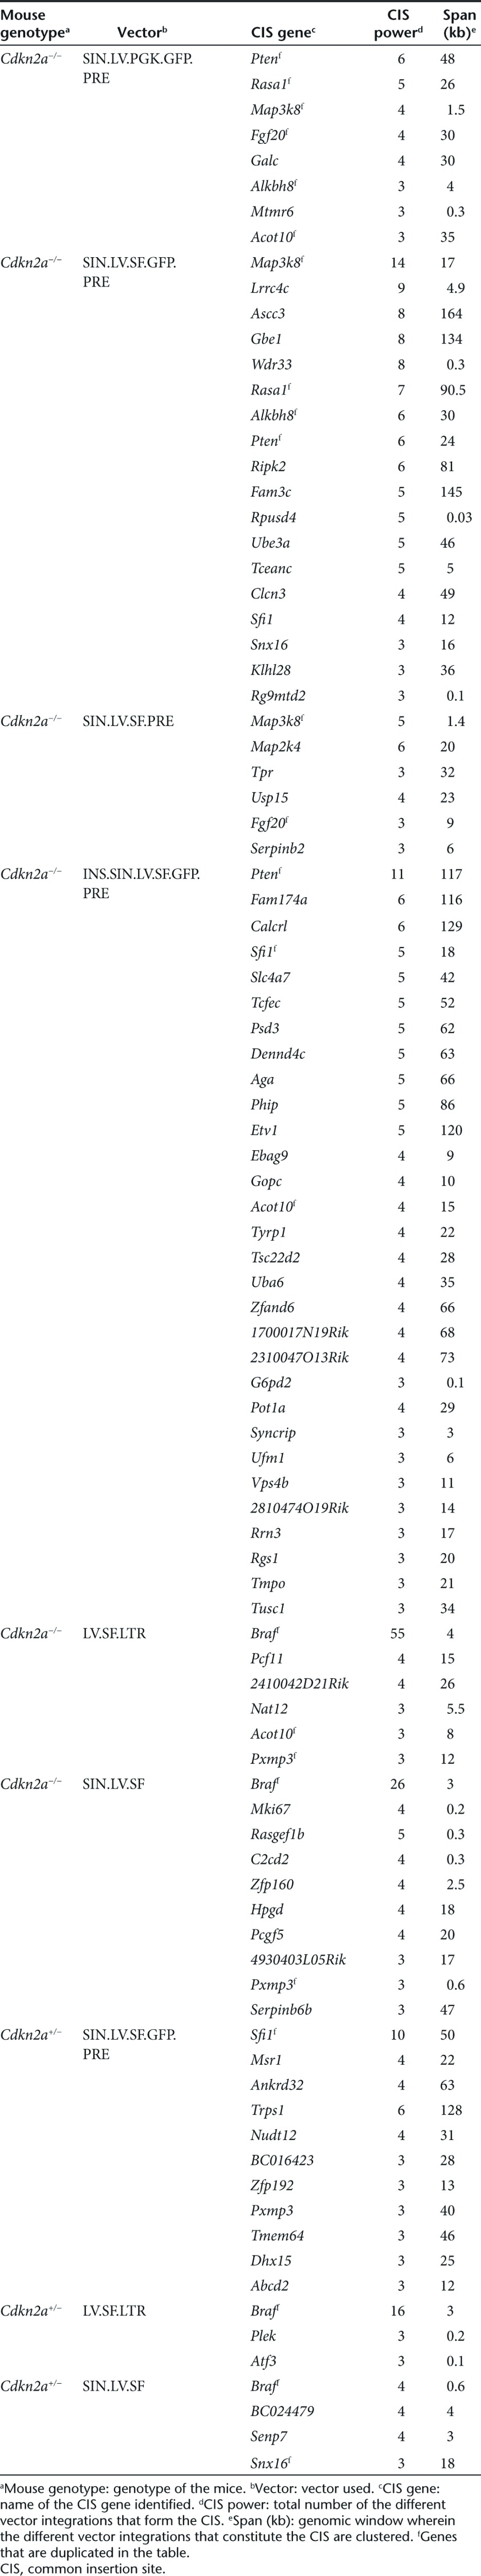
Several of the identified CIS genes, such as Braf, Map3k8, Sfi1, Pten, Rasa1, Lrrc4c, and Map2k4 (Table 1), are cancer genes, many of which have already been identified in γ-retroviruses or during transposon oncogene-tagging studies.23,24 We found that about 78% of the CIS genes identified in this study were deregulated in different types of human hematopoietic tumors and 19% were differentially expressed among different subgroups of acute myeloid leukemia (Supplementary Materials and Methods; Supplementary Figures S4 and S5; Supplementary Tables S5 and S6).
Braf was the highest-ranking CIS gene (n = 101) in Cdkn2a−/− and Cdkn2a+/− tumors induced by the highly genotoxic LV.SF.LTR or SIN.LV.SF vectors (Figure 3a; Table 1). Almost all integrations were in the same orientation as the targeted gene (93%, n = 94) and clustered within a 4-kb genomic region between Braf intron11 and intron12 (Figure 3a); the same region was found to be targeted by transposon integrations in sarcomas of Arf−/− mice25 (Figure 3a). Braf was not significantly targeted by any of the other LV constructs.
Figure 3.
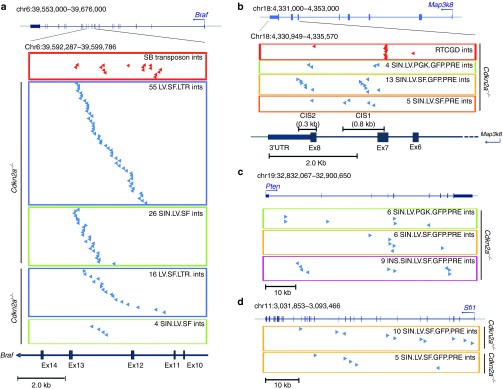
Distribution of vector integrations in the highly targeted genes. (a) Genomic position of 71 LV.SF.LTR and 30 SIN.LV.SF integrations in tumor-infiltrated liver targeting introns 11 and 12 of Braf in Cdkn2a−/− and Cdkn2a+/−. Chromosome number and coordinates of Braf and its genomic structure are indicated on top (blue boxes and vertical bars indicate exons; blue arrows indicate the start site and orientation of transcription). On the bottom, the genomic interval covering the targeted region is enlarged and indicated. In the red boxes, red arrows represent sleeping beauty integrations retrieved from sarcomas in Arf−/− mice. In the blue and green boxes, blue arrows indicate the position and orientation of LV.SF.LTR and SIN.LV.SF integrations with respect to the targeted gene in tumor-infiltrated liver from Cdkn2a−/− and Cdkn2a+/−, as indicated. (b) Genomic position of the vector integrations in tumor-infiltrated liver targeting Map3k8 gene in Cdkn2a−/− (scheme as in a). On the bottom, the genomic interval covering the targeted 3′ portion of the Map3k8 gene is enlarged. In the red boxes, red arrows represented retroviral integrations from the RTCGD database targeting the same genomic regions. In the green, yellow, and orange boxes, blue arrows indicate SIN.LV.PGK.GFP.PRE, SIN.LV.SF.GFP.PRE, and SIN.LV.SF.PRE integrations in tumor-infiltrated liver from Cdkn2a−/−, as indicated. (c) Genomic position of SIN.LV.SF.GFP.PRE integrations in tumor-infiltrated liver targeting Pten gene in Cdkn2a−/− (scheme as in a). In the green, yellow, and pink boxes, blue arrows indicate SIN.LV.PGK.GFP.PRE, SIN.LV.SF.GFP.PRE, and INS.SIN.LV.SF.GFP.PRE integrations in tumor-infiltrated liver from Cdkn2a−/−, as indicated. (d) Genomic position of vector integrations in tumor-infiltrated liver targeting Sfi1 gene in Cdkn2a−/− and in Cdkn2a+/− (scheme as in a). Yellow boxes indicate SIN.LV.SF.GFP.PRE integrations found in tumor-infiltrated liver from Cdkn2a−/− and Cdkn2a+/− and the integrations found in tumors due to SIN.LV.SF.PRE, as indicated.
Map3k8 was the highest-ranking CIS gene (n = 18) found in Cdkn2a−/− tumors induced by SIN.LV.SF.GFP.PRE (n = 13) and SIN.LV.SF.PRE (n = 5), whereas in SIN.LV.PGK.GFP.PRE was a low-power CIS, ranking third in the list (n = 4; Figure 3b; Table 1). The integrations targeting Map3k8 did not show any orientation bias and clustered within a 1.8-kb genomic window at the 3′ portion of the gene. Interestingly, two subclusters of integrations can be distinguished within the Map3k8 gene (Figure 3b). One cluster targeted the Map3k8 exon 7 and the intron 7 (Map3k8_CIS1), a region that was also targeted by γ-retroviral integrations in mouse lymphomas.26,27,28 The second cluster of integrations targeted Map3k8 exon 8 and the flanking 3′UTR (Map3k8_CIS2) (Figure 3b). INS.SIN.LV.SF.GFP.PRE showed a significantly reduced frequency of integrations targeting Map3k8 (P = 0.001, Fisher's exact test versus SIN.LV.SF.GFP.PRE; Supplementary Table S2). LV.SF.LTR or SIN.LV.SF did not target Map3k8.
The tumor suppressor gene Pten was the highest-ranking CIS gene found in Cdkn2a−/− tumors induced by SIN.LV.PGK.GFP.PRE (n = 6) and INS.SIN.LV.SF.GFP.PRE (n = 11), whereas it was only the fifth-ranking CIS (n = 6) in the SIN.LV.SF.GFP.PRE data set (Figure 3c; Table 1). Pten integrations were in part clustered in the first intron, and the majority (14 out of 21) within or near the fourth and fifth exons—encoding the phosphatase catalytic domain—and exon8 (Figure 3c). No vector orientation preference with respect to gene transcription was observed.
Sfi1 was the highest-ranking CIS gene (n = 10) found in Cdkn2a+/− tumors induced by SIN.LV.SF.GFP.PRE integrations (Figure 3d; Table 1). Nine out of 10 integrations targeting Sfi1 were in opposite orientations with respect to gene transcription and were clustered in a 50-kb genomic window.
Gene ontology analysis of CIS genes identified in tumor-infiltrated tissues of Cdkn2a−/− mice showed a significant overrepresentation of gene classes involved in the regulation of protein kinase cascade, guanosine triphosphatase regulator activity, and mitogen-activated protein kinase signaling pathway. These data indicate that perturbation of genes belonging to the receptor tyrosine kinase pathway plays a pivotal role in the transformation process of Cdkn2a−/− cells (Figure 4; Supplementary Table S7).
Figure 4.

The receptor tyrosine kinase (RTK) signaling pathway is frequently hit by lentiviral vector (LV) integration. The RTK pathway is frequently activated in human and murine tumors by several mechanisms. Several of the common insertion site (CIS) genes identified in our model, such as Braf, Map3k8, Rasa1, and Pten, belong to the RTK pathway. The LV integration in these genes may collaborate with the genetic lesion of the Cdkn2a−/− mice to activate the RTK pathway and induce tumorigenesis. Genes of the RTK pathway that promote cellular proliferation and survival are indicated in red, whereas genes that promote cell cycle arrest and senescence are indicated in blue. The rounded rectangles highlight the pathways that are deficient in Cdkn2a−/− mice. Stars indicate the genes of the pathway that are CISs in our model.
Finally, Braf, Rasa1, and Lrrc4c were also found to be significantly targeted by LV integrations in the tumor-infiltrated tissue of mice transplanted with LV.SF.LTR- and SIN.LV.SF.GFP.PRE-transduced Cdkn2a−/− HSCs, indicating that the oncogenesis culprits are shared with those found in mice subjected to systemic LV injection (Supplementary Table S8).
Molecular mechanism of insertional mutagenesis
We performed reverse transcription–polymerase chain reaction (RT–PCR) analysis on complementary DNA (cDNA) from tumor-infiltrated livers harboring LV.SF.LTR and LV.SF integrations targeting Braf (Figure 5a) to address whether chimeric mRNAs containing LV and Braf sequences were generated, as previously described.1 The RT–PCR products from LV.SF.LTR-marked tumors were chimeric cDNAs with the major splice donor site of the LV backbone fused to the splice acceptor of exon 13 of Braf, in agreement with our previous observations.1 In SIN.LV.SF-induced tumors, the RT–PCR products contained the end of the LV LTR directly joined to exon13 or fused to flanking genomic sequences of the intron12 of Braf, in which cryptic splice donor signals within the intron were joined to exon13 (Figure 5b).
Figure 5.

Mechanism of insertional mutagenesis by SF-containing lentiviral vectors (LVs) with different designs. (a) Reverse transcription–polymerase chain reaction (RT–PCR) on cDNA from tumor-infiltrated liver from the indicated vector-treated mice. Primers on the U5′ LV long terminal repeats (LTR) and exon 22 of Braf were used, and these amplified a 1,500-bp product only in the group of mice that received LV.SF.LTR or SIN.LV.SF vector (M, molecular size markers; + ctrl, LV/Braf–positive control (ref. 2)); tumor cDNA of the indicated mouse. For each sample, RT–PCR using primers complementary to Gapdh was also performed as control. Fp and Rp arrows indicate the position of the primers used for the detection of LV/Braf chimeric transcripts; (b) schematic representation of the sequences of the RT–PCR products obtained in (a) from SIN.LV.SF-treated mice aligned to LV and to Braf exons. Black bars: amplified cDNA sequence; dashed lines: splicing events; Fp and Rp arrows: primers used for cDNA amplification; 3′UTR: 3′ untranslated region of Braf. The cDNA sequences were LV specific up to the end of the LTR and contained different portions of Braf intron 12 depending on the integration site, the cryptic splice donor site of the genome used to fuse the transcript to the splice junction of exon 13 of Braf. (c) Representation of SIN.LV.SF.GFP.PRE (black arrows), INS.SIN.LV.SF.GFP.PRE (blue arrows), and SIN.LV.SF.PRE (white arrows) integrations in the 3′ region of the Map3k8 gene in tumor-infiltrated liver of the mice tested for Map3k8 gene expression. Map3k8 genomic structure of 3′ portion is indicated: grey boxes indicate exons; black arrow indicates the orientation of transcription. Note that we draw the gene in reverse orientation. Arrows above the gene representation indicate the position and the orientation of the vector integrations with respect to gene transcription. Mouse ID is indicated for each integration site. (d) Expression levels of Map3k8 in tumor-infiltrated livers from mice injected with the indicated vector and harboring or not harboring a vector integration into the tested gene. For each mouse, the expression levels of the Map3k8 gene detected by the two probe sets used (probe sets Ex4-5 and Ex7-8) are indicated. The position of the probe set used for gene expression is indicated in c. In samples DMM129 and 130, probe sets Ex4-5 and Ex7-8 show different levels of overexpression of the two cDNA portions. It is unclear if these differences are caused by an effect of the integrations on Map3k8 mRNA splicing or interference with the qPCR assay. (e) Schematic representation of the Map3k8/LV aberrant transcript sequences obtained by RT–PCR from SIN.LV.SF.GFP.PRE- and INS.SIN.LV.SF.GFP.PRE-induced tumors with Map3k8 integrations and aligned to Map3k8 gene. For the RT–PCR, primers on the exon 7 of Map3k8 (Fp) and on ∆U3′ LV LTR (Rp) were used. The aberrant Map3k8 transcripts contain the exon 7 of the targeted gene spliced into internal portions of the SIN vector or fused with portions of the Map3k8 exon 8 colinear with the 5′ SIN LTR of the vector. Scheme as in b.
We then investigated by quantitative PCR (qPCR) if the SINLVs integrations at Map3k8_CIS1 and CIS2 regions could perturb Map3k8 expression. We used probe sets specific for cDNA portions upstream of the Map3k8_CIS1 and CIS2 regions (probe set exons 4–5) or a cDNA portion encompassing the Map3k8_CIS1 and upstream of Map3k8_CIS2 (probe set exons 7–8; Figure 5c,d). Control tumors containing integrations targeting genes other than Map3k8 or tumors from IDLV-treated mice showed similar levels of Map3k8 expression using both probe sets. Tumors harboring Map3k8_CIS2 integrations showed up to ninefold overexpression with respect to controls for both cDNA regions tested (Figure 5d). Tumors harboring Map3k8_CIS1 integrations showed a similar overexpression of the upstream portion of the Map3k8 transcript, whereas the portion downstream of the Map3k8_CIS1 region showed expression levels similar to those in controls (Figure 5d), indicating truncation of the overexpressed aberrant transcript probably occurring at the vector LTR polyadenylation site. Finally, by sequencing specific PCR products from tumor cDNA obtained using primers complementary to Map3k8 exon7 and the SIN LV LTR, we identified the formation of chimeric Map3k8–SIN LV transcripts (Figure 5e). These chimeric transcripts contained the Map3k8 exon7 fused to different portions of the SIN vector or to a portion of exon8 followed by the 5′ portions of the SIN LTR (Figure 5e). All these chimeric transcripts appeared to be the products of aberrant splicing and truncation using cryptic vector splice acceptor sites and/or the LV polyadenylation site present in the LTR.
Discussion
Here, we developed in vivo assays in which the degree of tumor onset acceleration serves as a readout of the overall genotoxic potential of integrative vectors and further used them (i) to measure and compare the genotoxic potential of different vector designs and (ii) to uncover and rank the most relevant mechanisms involved in oncogenesis induced by insertional mutagenesis.
Our data shed light for the first time why gene therapy–like LVs with a SIN LTR configuration and a transgene expression cassette in an internal position are less genotoxic than vectors with active LTRs.1,3 Indeed, the highly genotoxic LV with active LTRs induced early tumor onset mainly by activating oncogenes (such as Braf) through a mechanism known as promoter insertion. The capability to efficiently perform promoter insertion, however, was not specific only for LVs with active LTRs but also for SIN LVs with a single viral enhancer promoter in an internal position devoid of any downstream ORF that was highly genotoxic by the same mechanism. We speculate that, in gene therapy–like SIN LVs, the presence of an ORF stabilizes a promoter-primed mRNA and activates the function of the polyadenylation signal located in the Repeated (R) region of the LTR, thus promoting termination and reducing read-through transcription as well as subsequent splicing capture events. Splice acceptor scanning mechanisms have been proposed,29,30,31 which influence which exon to use by “measuring” the strength of the splice acceptor sites and the protein-coding potential of the resulting transcripts. The role of aberrant splicing in insertional mutagenesis has recently been suggested in several studies performed in vitro11,12,13 and in a clinical trial for the treatment of β-thalassemia.14 It would therefore be preferable to avoid having splice donor sites downstream promoter sequences and more generally adopt strategies aimed at reducing aberrant splicing to increase the safety profile of integrating vectors.12
The higher sensitivity of these new in vivo assays with respect to the previous transduction/transplantation model1,2 is now demonstrated by its ability to significantly detect the mild but still existing genotoxicity of different SIN LVs harboring either strong viral SF or moderate endogenous phosphoglycerate kinase (PGK) promoters in an internal position, vectors that were instead shown to be neutral in previous in vivo models. Similar vector designs have been used in currently ongoing LV-based clinical trials for the treatment of adrenoleukodystrophy (containing the strong synthetic MND promoter that includes the U3 region of a modified Moloney murine leukemia virus LTR with myeloproliferative sarcoma virus enhancer)6 and metachromatic leukodystrophy (containing the PGK promoter),8 without detectable adverse genotoxic events at the latest molecular follow-up. Molecular analysis revealed that the SIN LVs tested in our model mainly activated Map3k8 by combining transcript truncation and enhancer-mediated overexpression or alternatively inactivated the tumor suppressors Pten or Rasa1. Interestingly, Map3k8 was the predominant CIS when the strong enhancer/promoter SF was used, whereas when the moderate PGK promoter was used, the oncosuppressors Pten and Rasa1 (targeted by inactivating integrations in exons) became the predominant driver of oncogenesis in Cdkn2a−/− mice. This difference can be explained by the superior capability of the SF relative to PGK to activate oncogenes near the integration site by enhancer-mediated activation.32 Therefore, the strength of the promoter directly modulates the frequency of tumors induced by oncogene activation and thus prompts, when possible, the use of moderated promoters versus strong ones.
Finally, we show that the inclusion of a validated synthetic chromatin insulator within the SIN LV LTRs was able to slightly reduce the acceleration of tumor onset with respect to its uninsulated counterpart and still be genotoxic in our model. Molecular analysis of the tumors induced by the insulated LV revealed a significantly reduced number of integrations targeting Map3k8, whereas the oncosuppressor Pten was frequently inactivated by integrations in exons, a mechanism that cannot be prevented by the use of insulators. Therefore, we conclude that the residual genotoxicity observed in mice treated with the insulated LV was not due to inefficient insulating activity but due to the occurrence of “escape” mechanisms represented by the inactivation of a tumor suppressor. The capability of this synthetic insulator to virtually eliminate the enhancer-mediated activation of Map3k8 prompts the use of this or other validated insulators in future gene therapy applications to alleviate the risks associated with this mechanism of insertional mutagenesis.
Overall, our study indicates that the vector design influences the modality through which the integrated proviral genome interacts with the surrounding cellular genome, modulating the capability to deregulate genes in a specific fashion, determining the culprits of insertional mutagenesis, and ultimately dictating the level of oncogenic risk as well as the time of tumor onset in vivo. Based on our data, the most genotoxic vectors are those capable of efficiently performing promoter insertion, followed by vectors that are able to perform enhancer-mediated activation of oncogenes or inactivation of tumor suppressor genes. It also appears that the capability to induce cancer by enhancer-mediated activation of oncogenes versus inactivation of tumor suppressor genes is linked to the strength of the enhancer promoter used or the presence of chromatin insulator sequences that efficiently block the interaction between vector enhancers and the surrounding cellular genes (Figure 6).
Figure 6.

Summary of the vector-specific mechanisms of insertional mutagenesis and levels of vector genotoxicity in Cdkn2a−/− mice. Specific culprits of insertional mutagenesis were predominant when specific lentiviral vector (LV) designs were used to treat Cdkn2a−/− mice. For each vector design, we indicated the word cloud representation of the CIS gene identified and the major mechanism of insertional mutagenesis used with the relative median survival indicated into the brackets. In the word cloud representation (rectangles on the left), the most targeted genes are represented by larger letter size. The genotoxic potential of each vector varied from high (top), to moderate and low (bottom). The most genotoxic vectors were those capable of efficiently performing promoter insertion, such as LV.SF.LTR and SIN.LV.SF, leading to Braf activation (average of the median survival of the two groups is indicated). Vectors containing strong enhancer/promoters, such as SIN.LV.SF.GFP.PRE and SIN.LV.SF.PRE, efficiently performed enhancer-mediated activation of oncogenes as the main mechanism of insertional mutagenesis, leading to Map3k8 activation in our in vivo model (average of the median survival of the two groups is indicated). When SIN vectors contained moderate enhancer/promoters such as SIN.LV.PGK.GFP.PRE, both enhancer-mediated activation of oncogenes and gene inactivation are used as insertional mechanisms, promoting Map3k8 activation and inactivation of Pten and Rasa1 genes. Finally, when the activity of enhancers is shielded by the presence of insulator sequences, vector genotoxicity relies only on gene inactivation mechanisms.
It remains unclear why for LV.SF.LTR and SIN.LV.SF, which could activate Map3k8 or inactivate tumor suppressor genes acting on the Mapk/Erk pathway in an independent fashion,25,26,33 only Braf is retrieved as the dominant CIS in Cdkn2a−/− or Cdkn2a+/− mice. Probably, after vector injection, a “race” toward malignant transformation takes place among transduced cells harboring different genotoxic integrations. In this scenario, cell clones harboring Braf-activating integrations might hold a stronger proliferative advantage and/or require a lower number of complementing mutations to promote early tumor onset with respect to clones containing Map3k8-activating integrations. Moreover, in the Cdkn2a-deficient model, Map3k8 activation appears to predominate in tumors only when there is the combined action of the removal of microRNA-binding sites from the 3′UTR and the enhancer activity of the integrated SIN LV. Indeed, even if SIN.LV.PGK.GFP and the insulated SIN LVs have reduced ability with respect to SIN.LV.SF.GFP.PRE to activate this oncogene by enhancer-mediated mechanisms, the sequences that mediate aberrant splicing and premature transcript termination are intact. Yet, these vectors do not appear to preferentially activate Map3k8. Moreover, the progressive increase of Pten-inactivating integrations, paralleled by the progressive decrease of Map3k8-activating integrations, in tumors generated from vectors with progressively lower enhancer activity suggests that the removal of microRNA-binding sites from the Map3k8 mRNA is less penetrant than Pten inactivation.
Besides the vector design, the specificity of the drivers of oncogenesis was also influenced by the genetic background of the transduced cells because differently from Cdkn2a−/−, Sfi1 was the predominant culprit of oncogenesis in Cdkn2a+/− mice treated with SIN.LV.SF.GFP.PRE. In line with the interplay between vector design and mouse genotype, we show that Braf activation was able to induce cancer in Cdkn2a−/− and Cdkn2a+/− mice but not in WT mice. These data indicate that two copies of Cdkn2a are fully protective against Braf hyperactivation, probably due to the induction of senescence/apoptosis upon vector-mediated Braf overexpression.34,35 The cyclin-dependent kinase inhibitor 2A (CDKN2A) pathway has a central role in maintaining the barriers to proto-oncogene activation and aberrant cell proliferation, and it has been found to be frequently inactivated in many types of human cancer,36 including leukemic cells triggered by γ-retroviral insertions in X-linked severe combined immunodeficiency (X-SCID) gene therapy patients.37,38 Cdkn2a+/− cells instead supported Braf-induced oncogenesis but required a longer latency for tumor onset compared with Cdkn2a−/− cells. It is possible that mutations inactivating the remaining Cdkn2a allele are required for tumor onset, as demonstrated in Eµ-myc transgenic Cdkn2a+/− mice.39,40 Of note, when mildly genotoxic vectors were used, Map3k8 activation or Pten disruption strictly required full Cdkn2a deficiency to induce cancer.
The results of this study have been instrumental in the identification of both already known and novel oncogenes that could also be relevant in human cancer. The LV treatment induced formation of LV/Braf aberrant transcripts encoding for a putative shorter protein lacking the N-terminal regulatory domains which has a constitutive kinase activity and that has been shown to be implicated in murine and human cancer.1,10,25,41,42 The mildly genotoxic SIN LVs identified two main CISs targeting the 3′ region of Map3k8, and these two CISs triggered the formation of prematurely terminated transcripts lacking negative regulatory elements. Similar mutations have been described in other insertional mutagenesis studies.26,27,28 Moreover, overexpression of full-length or C-terminal–truncated MAP3K8 proteins has clinical relevance also because it has been found to be overexpressed in several human cancers.33,43,44,45 Additionally, our models allowed the identification of tumor suppressor genes such as Pten, whose haploinsufficiency has been demonstrated to be sufficient to promote cancer development in humans and mice.46,47,48 Finally, other cancer gene candidates found in our study are deregulated in human hematopoietic tumors, suggesting that they could play a role in human diseases also.
It is important to note that our model suffers from the common limitations of all mouse models (including those based on the WT genotype) when trying to extrapolate risk calculation to humans, in which several complex interacting factors may temper or, instead, aggravate the outcome of a genotoxic hit. However, our findings are relevant for the relative assessment of the genotoxic risk associated with different vector designs because they were compared side by side in the same animal model and under similar experimental conditions. Indeed, our model provides both a qualitative (mechanistic insight) and quantitative readout of genotoxicity (rate of accelerated oncogenesis), allowing a relative ranking of the different vectors according to these features. We expect that the observed differences in genotoxic potential and the mechanisms of insertional mutagenesis, specifically uncovered for each vector design, will be maintained on clinical testing, albeit being tempered or compounded by other factors specifically associated with the choice of disease, conditioning regimen, and ex vivo transduction protocol. Thus, our findings can inform current and future choices of vector design with increased biosafety.
Materials and Methods
Vector production. SIN.LV.SF.GFP.PRE, SIN.LV.PGK.GFP.PRE, and LV.SF.LTR vectors were previously described.1,2 SIN.LV.SF.PRE, SIN.LV.SF, and INS.SIN.LV.SF.GFP.PRE plasmids were produced from SIN.LV.SF.GFP.PRE (see Supplementary Methods for details). IDLV.SIN.LV.SF.GFP.PRE was produced using an integrase-defective packaging construct.49 Concentrated VSV.G-pseudotyped LV stocks were produced as described previously.1,2
Mouse treatment. FVB129-Cdkn2a−/− mice and C57BL6/J-Cdkn2a−/− mice were obtained from the National Cancer Institute Mouse Models of Human Cancer Consortium. C57BL6/J-Cdkn2a+/− mice were generated by breeding C57BL6/J-Cdkn2a−/− with C57BL6/J WT mice obtained from Charles River Laboratories (Calco, Italy). 129SVEV-IfnaR1−/− mice were obtained from B&K Universal (Grimston, UK). Cdkn2a−/−/IfnaR1−/− mice were generated by sequential crossing of C57BL6/J-Cdkn2a−/− mice with IfnaR1−/− mice.
Newborn mice from the different strains/genotypes were injected with 10–20 µl of highly concentrated vector preparations into the temporal vein (Supplementary Table S1). For each vector treatment group, sample size was defined using the criteria calculated following definitions in Supplementary Statistical Methods. All mice were bred and maintained in a dedicated pathogen-free animal facility and were euthanized when they showed signs of severe sickness (see Supplementary Methods).
Vector copy number. Genomic DNA was extracted from tumor-infiltrated liver using the Qiagen midiDNA kit (Hilden, Germany). qPCR analysis was performed as previously described1,2 using probes complementary to mouse genomic β-actin and the common ψ-signal region of LV. VCN was determined as the ratio between the relative amounts of LV versus total DNA evaluated by β-actin (see Supplementary Methods for details).
Linear amplification–mediated PCR and genomic integration site analysis. Linear amplification–mediated PCR was performed on liver and spleen tumor-infiltrated tissue according to published protocol.1,2,50 Genomic sequences were aligned to the mouse genome (assembly July 2007, mm9) using the Basic Local Alignment Search Tool of the National Center for Biotechnology Information (NCBI BLAST) genome browser coupled with bioinformatics analyses.
Gene expression analysis. Total RNA from tumor-infiltrated liver/spleen was isolated with RNeasy MiniKit. cDNA preparation was performed using reverse transcriptase and random hexamer primers. cDNA was used as template for qualitative PCR and for quantitative TaqMan reactions using specific gene expression assays. Amplification of the chimeric LV/Braf transcripts was performed as previously described.1 The chimeric LV/Map3k8 transcripts were amplified using oligonucleotides complementary to the U3_LV.LTR and Map3k8_exon7.
Statistics. Statistical analysis was performed with the R-statistical (http://www.r-project.org/) or GraphPad Prism 4.0 software (GraphPad Software, Inc. La Jolla, CA, USA). Mouse survival analyses were performed using log-rank Mantel–Cox test. Statistical significance for each CIS was established using the algorithm described by Abel et al.20,21 and the Grubbs test for outliers7,8,22 (see Supplementary Statistical Methods for details).
SUPPLEMENTARY MATERIAL Figure S1. Representative example of liver-infiltrated hematopoietic tumoral cells in Cdkn2a−/− mice. Figure S2. VCN distribution in tumor-infiltrated liver. Figure S3. Vector integration site analysis in tumor-infiltrating liver. Figure S4. Representative expression of some CIS gene in human hematopoietic tumors. Figure S5. Heat map of CIS gene deregulated in AML. Table S1. Group of Cdkn2a−/−, Cdkn2a+/−, and WT mice systemically injected with the indicated LV or mock control. Table S2. Genomic position of LV integrations found in tumor infiltrating liver and spleen and nearest targeted gene. Table S3. Summary table on vector integrations in Cdkn2a−/− and Cdkn2a+/− mice. Table S4. Common insertion sites gene defined by the algorithm described by Abel et al. based on Monte/Carlo simulation in Cdkn2a−/− and Cdkn2a+/− mice Table S5. Data mining of CIS genes in human hematopoietic tumors. Table S6. Microarray statistical analyses for CIS genes differentially expressed from different AML patients in the two different cohorts. Table S7. Gene ontology analyses of common insertion sites retrieved from Cdkn2a−/− mice injected with the different SIN LVs. Table S8. Common insertion sites retrieved from hematopoietic tumors derived from Cdkn2a−/− HSPCs transduced with the different vector.
Acknowledgments
This work was supported by grants from the Association for International Cancer Research to E.M. (AICR 09-0784), EU Clinigene NoE grant to E.M. (LSHB-CT-2006–018933), Italian Telethon to L.N. and E.M. (TIGET grants), EU grant HEALTH-2009–222878 to L.N. (PERSIST), and Bill and Melinda Gates Foundation grant Round 7 of Grand Challenges Explorations to E.M. (OPP1045909). We are grateful to Andrea Calabria for bioinformatics support and to Anna Kajaste-Rudnitski for critical reading of the manuscript. We thank Martina Rocchi and Arianna Vino for providing technical support for histological and immunohistochemistry sample preparations. The authors have declared that no conflict of interest exists. D.C. conceived and performed experiments and wrote the manuscript. M.R., M.V, F.B., and L.S.S. performed experiments. C.D. and A.A. provided reagents. C.B., S.M., C.v.K., and M.S. mapped the integration sites. F.S. and C.D. performed histopathological analysis. C.B., A.N., and C.D.S. performed statistical analyses on human microarray data. O.C.-H. and L.N. revised the manuscript. E.M. supervised the project and wrote the manuscript.
Supplementary Material
Representative example of liver-infiltrated hematopoietic tumoral cells in Cdkn2a−/− mice.
VCN distribution in tumor-infiltrated liver.
Vector integration site analysis in tumor-infiltrating liver.
Representative expression of some CIS gene in human hematopoietic tumors.
Heat map of CIS gene deregulated in AML.
Group of Cdkn2a−/−, Cdkn2a+/−, and WT mice systemically injected with the indicated LV or mock control.
Genomic position of LV integrations found in tumor infiltrating liver and spleen and nearest targeted gene.
Summary table on vector integrations in Cdkn2a−/− and Cdkn2a+/− mice.
Common insertion sites gene defined by the algorithm described by Abel et al. based on Monte/Carlo simulation in Cdkn2a−/− and Cdkn2a+/− mice
Data mining of CIS genes in human hematopoietic tumors.
Microarray statistical analyses for CIS genes differentially expressed from different AML patients in the two different cohorts.
Gene ontology analyses of common insertion sites retrieved from Cdkn2a−/− mice injected with the different SIN LVs.
Common insertion sites retrieved from hematopoietic tumors derived from Cdkn2a−/− HSPCs transduced with the different vector.
References
- Montini E, Cesana D, Schmidt M, Sanvito F, Bartholomae CC, Ranzani M, et al. The genotoxic potential of retroviral vectors is strongly modulated by vector design and integration site selection in a mouse model of HSC gene therapy. J Clin Invest. 2009;119:964–975. doi: 10.1172/JCI37630. [DOI] [PMC free article] [PubMed] [Google Scholar]
- Montini E, Cesana D, Schmidt M, Sanvito F, Ponzoni M, Bartholomae C, et al. Hematopoietic stem cell gene transfer in a tumor-prone mouse model uncovers low genotoxicity of lentiviral vector integration. Nat Biotechnol. 2006;24:687–696. doi: 10.1038/nbt1216. [DOI] [PubMed] [Google Scholar]
- Modlich U, Navarro S, Zychlinski D, Maetzig T, Knoess S, Brugman MH, et al. Insertional transformation of hematopoietic cells by self-inactivating lentiviral and gammaretroviral vectors. Mol Ther. 2009;17:1919–1928. doi: 10.1038/mt.2009.179. [DOI] [PMC free article] [PubMed] [Google Scholar]
- Arumugam PI, Higashimoto T, Urbinati F, Modlich U, Nestheide S, Xia P, et al. Genotoxic potential of lineage-specific lentivirus vectors carrying the beta-globin locus control region. Mol Ther. 2009;17:1929–1937. doi: 10.1038/mt.2009.183. [DOI] [PMC free article] [PubMed] [Google Scholar]
- Zychlinski D, Schambach A, Modlich U, Maetzig T, Meyer J, Grassman E, et al. Physiological promoters reduce the genotoxic risk of integrating gene vectors. Mol Ther. 2008;16:718–725. doi: 10.1038/mt.2008.5. [DOI] [PubMed] [Google Scholar]
- Cartier N, Hacein-Bey-Abina S, Bartholomae CC, Veres G, Schmidt M, Kutschera I, et al. Hematopoietic stem cell gene therapy with a lentiviral vector in X-linked adrenoleukodystrophy. Science. 2009;326:818–823. doi: 10.1126/science.1171242. [DOI] [PubMed] [Google Scholar]
- Aiuti A, Biasco L, Scaramuzza S, Ferrua F, Cicalese MP, Baricordi C, et al. Lentiviral hematopoietic stem cell gene therapy in patients with Wiskott-Aldrich syndrome. Science. 2013;341:1233151. doi: 10.1126/science.1233151. [DOI] [PMC free article] [PubMed] [Google Scholar]
- Biffi A, Montini E, Lorioli L, Cesani M, Fumagalli F, Plati T, et al. Lentiviral hematopoietic stem cell gene therapy benefits metachromatic leukodystrophy. Science. 2013;341:1233158. doi: 10.1126/science.1233158. [DOI] [PubMed] [Google Scholar]
- Ramezani A, Hawley TS, Hawley RG. Combinatorial incorporation of enhancer-blocking components of the chicken beta-globin 5'HS4 and human T-cell receptor alpha/delta BEAD-1 insulators in self-inactivating retroviral vectors reduces their genotoxic potential. Stem Cells. 2008;26:3257–3266. doi: 10.1634/stemcells.2008-0258. [DOI] [PMC free article] [PubMed] [Google Scholar]
- Ranzani M, Cesana D, Bartholomae CC, Sanvito F, Pala M, Benedicenti F, et al. Lentiviral vector-based insertional mutagenesis identifies genes associated with liver cancer. Nat Methods. 2013;10:155–161. doi: 10.1038/nmeth.2331. [DOI] [PMC free article] [PubMed] [Google Scholar]
- Almarza D, Bussadori G, Navarro M, Mavilio F, Larcher F, Murillas R. Risk assessment in skin gene therapy: viral-cellular fusion transcripts generated by proviral transcriptional read-through in keratinocytes transduced with self-inactivating lentiviral vectors. Gene Ther. 2011;18:674–681. doi: 10.1038/gt.2011.12. [DOI] [PubMed] [Google Scholar]
- Cesana D, Sgualdino J, Rudilosso L, Merella S, Naldini L, Montini E. Whole transcriptome characterization of aberrant splicing events induced by lentiviral vector integrations. J Clin Invest. 2012;122:1667–1676. doi: 10.1172/JCI62189. [DOI] [PMC free article] [PubMed] [Google Scholar]
- Moiani A, Paleari Y, Sartori D, Mezzadra R, Miccio A, Cattoglio C, et al. Lentiviral vector integration in the human genome induces alternative splicing and generates aberrant transcripts. J Clin Invest. 2012;122:1653–1666. doi: 10.1172/JCI61852. [DOI] [PMC free article] [PubMed] [Google Scholar]
- Cavazzana-Calvo M, Payen E, Negre O, Wang G, Hehir K, Fusil F, et al. Transfusion independence and HMGA2 activation after gene therapy of human ß-thalassaemia. Nature. 2010;467:318–322. doi: 10.1038/nature09328. [DOI] [PMC free article] [PubMed] [Google Scholar]
- Emery DW. The use of chromatin insulators to improve the expression and safety of integrating gene transfer vectors. Hum Gene Ther. 2011;22:761–774. doi: 10.1089/hum.2010.233. [DOI] [PMC free article] [PubMed] [Google Scholar]
- Evans-Galea MV, Wielgosz MM, Hanawa H, Srivastava DK, Nienhuis AW. Suppression of clonal dominance in cultured human lymphoid cells by addition of the cHS4 insulator to a lentiviral vector. Mol Ther. 2007;15:801–809. doi: 10.1038/sj.mt.6300103. [DOI] [PubMed] [Google Scholar]
- Li CL, Xiong D, Stamatoyannopoulos G, Emery DW. Genomic and functional assays demonstrate reduced gammaretroviral vector genotoxicity associated with use of the cHS4 chromatin insulator. Mol Ther. 2009;17:716–724. doi: 10.1038/mt.2009.7. [DOI] [PMC free article] [PubMed] [Google Scholar]
- Brown BD, Sitia G, Annoni A, Hauben E, Sergi LS, Zingale A, et al. In vivo administration of lentiviral vectors triggers a type I interferon response that restricts hepatocyte gene transfer and promotes vector clearance. Blood. 2007;109:2797–2805. doi: 10.1182/blood-2006-10-049312. [DOI] [PubMed] [Google Scholar]
- Carrasco DR, Fenton T, Sukhdeo K, Protopopova M, Enos M, You MJ, et al. The PTEN and INK4A/ARF tumor suppressors maintain myelolymphoid homeostasis and cooperate to constrain histiocytic sarcoma development in humans. Cancer Cell. 2006;9:379–390. doi: 10.1016/j.ccr.2006.03.028. [DOI] [PubMed] [Google Scholar]
- Suzuki T, Shen H, Akagi K, Morse HC, Malley JD, Naiman DQ, et al. New genes involved in cancer identified by retroviral tagging. Nat Genet. 2002;32:166–174. doi: 10.1038/ng949. [DOI] [PubMed] [Google Scholar]
- Abel U, Deichmann A, Nowrouzi A, Gabriel R, Bartholomae CC, Glimm H, et al. Analyzing the number of common integration sites of viral vectors–new methods and computer programs. PLoS ONE. 2011;6:e24247. doi: 10.1371/journal.pone.0024247. [DOI] [PMC free article] [PubMed] [Google Scholar]
- Biffi A, Bartolomae CC, Cesana D, Cartier N, Aubourg P, Ranzani M, et al. Lentiviral vector common integration sites in preclinical models and a clinical trial reflect a benign integration bias and not oncogenic selection. Blood. 2011;117:5332–5339. doi: 10.1182/blood-2010-09-306761. [DOI] [PubMed] [Google Scholar]
- Akagi K, Suzuki T, Stephens RM, Jenkins NA, Copeland NG. RTCGD: retroviral tagged cancer gene database. Nucleic Acids Res. 2004;32 Database issue:D523–D527. doi: 10.1093/nar/gkh013. [DOI] [PMC free article] [PubMed] [Google Scholar]
- Keng VW, Villanueva A, Chiang DY, Dupuy AJ, Ryan BJ, Matise I, et al. A conditional transposon-based insertional mutagenesis screen for genes associated with mouse hepatocellular carcinoma. Nat Biotechnol. 2009;27:264–274. doi: 10.1038/nbt.1526. [DOI] [PMC free article] [PubMed] [Google Scholar]
- Collier LS, Carlson CM, Ravimohan S, Dupuy AJ, Largaespada DA. Cancer gene discovery in solid tumours using transposon-based somatic mutagenesis in the mouse. Nature. 2005;436:272–276. doi: 10.1038/nature03681. [DOI] [PubMed] [Google Scholar]
- Lund AH, Turner G, Trubetskoy A, Verhoeven E, Wientjens E, Hulsman D, et al. Genome-wide retroviral insertional tagging of genes involved in cancer in Cdkn2a-deficient mice. Nat Genet. 2002;32:160–165. doi: 10.1038/ng956. [DOI] [PubMed] [Google Scholar]
- Patriotis C, Makris A, Bear SE, Tsichlis PN. Tumor progression locus 2 (Tpl-2) encodes a protein kinase involved in the progression of rodent T-cell lymphomas and in T-cell activation. Proc Natl Acad Sci USA. 1993;90:2251–2255. doi: 10.1073/pnas.90.6.2251. [DOI] [PMC free article] [PubMed] [Google Scholar]
- Patriotis C, Makris A, Chernoff J, Tsichlis PN. Tpl-2 acts in concert with Ras and Raf-1 to activate mitogen-activated protein kinase. Proc Natl Acad Sci USA. 1994;91:9755–9759. doi: 10.1073/pnas.91.21.9755. [DOI] [PMC free article] [PubMed] [Google Scholar]
- Hirose Y, Manley JL. RNA polymerase II is an essential mRNA polyadenylation factor. Nature. 1998;395:93–96. doi: 10.1038/25786. [DOI] [PubMed] [Google Scholar]
- Hirose Y, Manley JL. RNA polymerase II and the integration of nuclear events. Genes Dev. 2000;14:1415–1429. [PubMed] [Google Scholar]
- Proudfoot NJ. Genetic dangers in poly(A) signals. EMBO Rep. 2001;2:891–892. doi: 10.1093/embo-reports/kve207. [DOI] [PMC free article] [PubMed] [Google Scholar]
- Lombardo A, Cesana D, Genovese P, Di Stefano B, Provasi E, Colombo DF, et al. Site-specific integration and tailoring of cassette design for sustainable gene transfer. Nat Methods. 2011;8:861–869. doi: 10.1038/nmeth.1674. [DOI] [PubMed] [Google Scholar]
- Johannessen CM, Boehm JS, Kim SY, Thomas SR, Wardwell L, Johnson LA, et al. COT drives resistance to RAF inhibition through MAP kinase pathway reactivation. Nature. 2010;468:968–972. doi: 10.1038/nature09627. [DOI] [PMC free article] [PubMed] [Google Scholar]
- Kang TW, Yevsa T, Woller N, Hoenicke L, Wuestefeld T, Dauch D, et al. Senescence surveillance of pre-malignant hepatocytes limits liver cancer development. Nature. 2011;479:547–551. doi: 10.1038/nature10599. [DOI] [PubMed] [Google Scholar]
- Michaloglou C, Vredeveld LC, Soengas MS, Denoyelle C, Kuilman T, van der Horst CM, et al. BRAFE600-associated senescence-like cell cycle arrest of human naevi. Nature. 2005;436:720–724. doi: 10.1038/nature03890. [DOI] [PubMed] [Google Scholar]
- Collado M, Blasco MA, Serrano M. Cellular senescence in cancer and aging. Cell. 2007;130:223–233. doi: 10.1016/j.cell.2007.07.003. [DOI] [PubMed] [Google Scholar]
- Hacein-Bey-Abina S, Garrigue A, Wang GP, Soulier J, Lim A, Morillon E, et al. Insertional oncogenesis in 4 patients after retrovirus-mediated gene therapy of SCID-X1. J Clin Invest. 2008;118:3132–3142. doi: 10.1172/JCI35700. [DOI] [PMC free article] [PubMed] [Google Scholar]
- Howe SJ, Mansour MR, Schwarzwaelder K, Bartholomae C, Hubank M, Kempski H, et al. Insertional mutagenesis combined with acquired somatic mutations causes leukemogenesis following gene therapy of SCID-X1 patients. J Clin Invest. 2008;118:3143–3150. doi: 10.1172/JCI35798. [DOI] [PMC free article] [PubMed] [Google Scholar]
- Jacobs JJ, Scheijen B, Voncken JW, Kieboom K, Berns A, van Lohuizen M. Bmi-1 collaborates with c-Myc in tumorigenesis by inhibiting c-Myc-induced apoptosis via INK4a/ARF. Genes Dev. 1999;13:2678–2690. doi: 10.1101/gad.13.20.2678. [DOI] [PMC free article] [PubMed] [Google Scholar]
- Matheu A, Pantoja C, Efeyan A, Criado LM, Martín-Caballero J, Flores JM, et al. Increased gene dosage of Ink4a/Arf results in cancer resistance and normal aging. Genes Dev. 2004;18:2736–2746. doi: 10.1101/gad.310304. [DOI] [PMC free article] [PubMed] [Google Scholar]
- Ciampi R, Knauf JA, Kerler R, Gandhi M, Zhu Z, Nikiforova MN, et al. Oncogenic AKAP9-BRAF fusion is a novel mechanism of MAPK pathway activation in thyroid cancer. J Clin Invest. 2005;115:94–101. doi: 10.1172/JCI23237. [DOI] [PMC free article] [PubMed] [Google Scholar]
- Palanisamy N, Ateeq B, Kalyana-Sundaram S, Pflueger D, Ramnarayanan K, Shankar S, et al. Rearrangements of the RAF kinase pathway in prostate cancer, gastric cancer and melanoma. Nat Med. 2010;16:793–798. doi: 10.1038/nm.2166. [DOI] [PMC free article] [PubMed] [Google Scholar]
- Clark AM, Reynolds SH, Anderson M, Wiest JS. Mutational activation of the MAP3K8 protooncogene in lung cancer. Genes Chromosomes Cancer. 2004;41:99–108. doi: 10.1002/gcc.20069. [DOI] [PMC free article] [PubMed] [Google Scholar]
- Miyoshi J, Higashi T, Mukai H, Ohuchi T, Kakunaga T. Structure and transforming potential of the human cot oncogene encoding a putative protein kinase. Mol Cell Biol. 1991;11:4088–4096. doi: 10.1128/mcb.11.8.4088. [DOI] [PMC free article] [PubMed] [Google Scholar]
- Jeong JH, Bhatia A, Toth Z, Oh S, Inn KS, Liao CP, et al. TPL2/COT/MAP3K8 (TPL2) activation promotes androgen depletion-independent (ADI) prostate cancer growth. PLoS ONE. 2011;6:e16205. doi: 10.1371/journal.pone.0016205. [DOI] [PMC free article] [PubMed] [Google Scholar]
- Carver BS, Tran J, Gopalan A, Chen Z, Shaikh S, Carracedo A, et al. Aberrant ERG expression cooperates with loss of PTEN to promote cancer progression in the prostate. Nat Genet. 2009;41:619–624. doi: 10.1038/ng.370. [DOI] [PMC free article] [PubMed] [Google Scholar]
- Di Cristofano A, Pesce B, Cordon-Cardo C, Pandolfi PP. Pten is essential for embryonic development and tumour suppression. Nat Genet. 1998;19:348–355. doi: 10.1038/1235. [DOI] [PubMed] [Google Scholar]
- Nardella C, Chen Z, Salmena L, Carracedo A, Alimonti A, Egia A, et al. Aberrant Rheb-mediated mTORC1 activation and Pten haploinsufficiency are cooperative oncogenic events. Genes Dev. 2008;22:2172–2177. doi: 10.1101/gad.1699608. [DOI] [PMC free article] [PubMed] [Google Scholar]
- Lombardo A, Genovese P, Beausejour CM, Colleoni S, Lee YL, Kim KA, et al. Gene editing in human stem cells using zinc finger nucleases and integrase-defective lentiviral vector delivery. Nat Biotechnol. 2007;25:1298–1306. doi: 10.1038/nbt1353. [DOI] [PubMed] [Google Scholar]
- Schmidt M, Schwarzwaelder K, Bartholomae C, Zaoui K, Ball C, Pilz I, et al. High-resolution insertion-site analysis by linear amplification-mediated PCR (LAM-PCR). Nat Methods. 2007;4:1051–1057. doi: 10.1038/nmeth1103. [DOI] [PubMed] [Google Scholar]
Associated Data
This section collects any data citations, data availability statements, or supplementary materials included in this article.
Supplementary Materials
Representative example of liver-infiltrated hematopoietic tumoral cells in Cdkn2a−/− mice.
VCN distribution in tumor-infiltrated liver.
Vector integration site analysis in tumor-infiltrating liver.
Representative expression of some CIS gene in human hematopoietic tumors.
Heat map of CIS gene deregulated in AML.
Group of Cdkn2a−/−, Cdkn2a+/−, and WT mice systemically injected with the indicated LV or mock control.
Genomic position of LV integrations found in tumor infiltrating liver and spleen and nearest targeted gene.
Summary table on vector integrations in Cdkn2a−/− and Cdkn2a+/− mice.
Common insertion sites gene defined by the algorithm described by Abel et al. based on Monte/Carlo simulation in Cdkn2a−/− and Cdkn2a+/− mice
Data mining of CIS genes in human hematopoietic tumors.
Microarray statistical analyses for CIS genes differentially expressed from different AML patients in the two different cohorts.
Gene ontology analyses of common insertion sites retrieved from Cdkn2a−/− mice injected with the different SIN LVs.
Common insertion sites retrieved from hematopoietic tumors derived from Cdkn2a−/− HSPCs transduced with the different vector.