

SUMMARY
Patients with neurofibromatosis type 1 (NF1) and Costello syndrome Rasopathy have behavioral deficits. In NF1 patients, these may correlate with white matter enlargement and aberrant myelin. To model these features, we induced Nf1 loss or HRas hyperactivation in mouse oligodendrocytes. Enlarged brain white matter tracts correlated with myelin decompaction, downregulation of claudin-11, and mislocalization of connexin-32. Surprisingly, non-cell-autonomous defects in perivascular astrocytes and the blood-brain barrier (BBB) developed, implicating a soluble mediator. Nitric oxide (NO) can disrupt tight junctions and gap junctions, and NO and NO synthases (NOS1–NOS3) were upregulated in mutant white matter. Treating mice with the NOS inhibitor NG-nitro-L-arginine methyl ester or the antioxidant N-acetyl cysteine corrected cellular phenotypes. CNP-HRasG12V mice also displayed locomotor hyperactivity, which could be rescued by antioxidant treatment. We conclude that Nf1/Ras regulates oligodendrocyte NOS and that dysregulated NO signaling in oligodendrocytes can alter the surrounding vasculature. The data suggest that anti-oxidants may improve some behavioral deficits in Rasopathy patients.
INTRODUCTION
Oligodendrocytes are the myelin-forming glial cells of the CNS. Changes in myelination have recently been implicated in CNS sensory and motor control, and in cognition (Zatorre et al., 2012). However, the role of oligodendrocytes and myelin in genetic diseases in which myelination changes have been implicated and cognitive deficits exist, as in Rasopathies such as neurofibromatosis type 1 (NF1) and Costello syndrome, has not been studied.
Rasopathies are inherited disorders in which individuals have mutations in Ras signaling pathway genes. Activating mutations in Ras proteins themselves, as in Costello syndrome (caused by mutations in H-Ras), or inactivation of Ras-GAPs, as in NF1 patients (caused by mutations in the NF1 gene), result in aberrant signaling to Ras effectors (Gysin et al., 2011). Low-grade pilocytic astrocytomas arise in white matter tracts in about 20% of NF1 patients (Williams et al., 2009). Results from diffusion tensor MRI (DTI) suggest that global changes occur in the brains of NF1 patients (van Engelen et al., 2008; Karlsgodt et al., 2012). T2 hyperintense regions in NF1 patients’ brains correlate with more profound DTI changes. On pathological analysis, these T2 hyperintense spots may be regions of dysmyelination (DiPaolo et al., 1995) and in some studies have been correlated with behavioral changes in NF1 patients (Hyman et al., 2007). More than half of NF1 patients present with CNS defects, learning and memory deficits, and/or hyperactivity (Acosta et al., 2012). Although the cellular changes that cause these deficits remain to be determined, more than half of NF1 patients are affected by macrocephaly, and increased size of the corpus callosum is associated with behavioral deficits (Pride et al., 2010). NF1 protein is highly expressed in rodent and human oligodendrocytes (Daston et al., 1992); therefore, we speculated that NF1 loss in oligodendrocytes could play a role in both the pathology and physiology of brain dysfunction in NF1 patients. The brain histology in Costello syndrome has not been studied, but macrocephaly followed by microcephaly, seizures, and cognitive problems has been reported, as has dysmyelination of optic nerves and basal ganglia based on brain imaging (Tidyman and Rauen, 2008). Costello mutations include the severe HRasG12V mutation, which we modeled.
In this study, we examined the effects of Nf1 loss and hyperactivation of HRas (HRasG12V) on oligodendrocytes in the adult brain. We identified a Ras-nitric oxide (NO) pathway that mediates altered myelin structure. Several lines of evidence have suggested key roles for reactive oxygen and nitrogen as upstream regulators and downstream effectors of Ras signaling (Ferro et al., 2012). Ras signaling through the downstream effectors MEK/ERK induces the generation of reactive oxygen species (ROS) (Heimfarth et al., 2013). Furthermore, MEK has been shown to play a critical role in oligodendrocyte formation (Li et al., 2012), and developmental Nf1 loss throughout the brain resulted in corpus callosum enlargement that could be reduced in size by MEK inhibition (Wang et al., 2012). However, in Drosophila, dNf1 loss caused a cyclic AMP (cAMP)-induced, Ras-independent upregulation of ROS (Tong et al., 2007). How loss of Nf1 affects oligodendrocyte viability and/or function remains unknown.
Oligodendrocytes manufacture myelin. Compact myelin is a multilamellar membrane whose structural integrity depends upon identified proteins and lipids. In addition to the major myelin proteins, such as proteolipid protein (Plp), myelin contains gap junction (GJ) and tight junction (TJ) proteins. Oligodendrocyte-specific protein (OSP; claudin-11) is a TJ protein. Claudin-11 mutants showed myelin decompaction in concert with Plp mutation (Chow et al., 2005). Genetic loss of the oligodendrocyte connexin protein Cx32 in mice results in myelin vacuolization (Magnotti et al., 2011). Claudins and connexins can be regulated by MEK/ERK or NO (Lee et al., 2009; Radosinska et al., 2011; Beutheu et al., 2012); however, such regulation has not been studied in intact brains.
We find that cell-intrinsic Ras upregulation in oligodendrocytes deregulates the expression and/or localization of TJ and GJ proteins in the myelin sheath, and, unexpectedly, in astrocyte and endothelial cells, resulting in altered permeability of the blood-brain barrier (BBB). Mechanistically, cellular phenotypes were caused by Ras-driven upregulation of NO synthase (NOS) expression and NO production. Behavioral changes also resulted from altered Ras/NO signaling in oligodendrocytes.
RESULTS
PlpCre;ERT (PlpCre) and CNP-HRasG12V Model Systems Target Mature Oligodendrocytes
To target Nf1 loss to oligodendrocytes, we used a tamoxifen-inducible PLP driver (Doerflinger et al., 2003). Plp is mainly expressed in adult white matter oligodendrocytes, but cellular targets of this driver have not been completely defined. We analyzed PlpCre;CMV-βactin-loxP-EGFP flanked (CAT) mice 1 day after they were dosed with tamoxifen for 3 days. The schematic in Figure S1 shows the oligodendrocyte lineage. As expected, enhanced green fluorescent protein (EGFP)+ cell labeling was enriched in white matter. We analyzed the optic nerve and corpus callosum in detail. Twenty percent of optic-nerve cells were EGFP+ and thus were affected by Cre recombinase. All EGFP+ cells in the optic nerve were double labeled with CC1 (Figure S1A), and 35% of the CC1+ population was double labeled with EGFP. In the corpus callosum, 75%–80% of EGFP+ cells were CC1+ (Figure S1A), likely indicating variable expression of CC1 in mature oligodendrocytes (Zeger et al., 2007). EGFP+ cells in white matter were negative for the progenitor marker NG2 (Figure S1B). Most EGFP+ cells had olig2+ nuclei (Figure S1C) and were CC1+ (Figure S1D). Cells expressing the astrocyte marker glial fibrillary acidic protein (GFAP; Figure S1E), the microglial marker Iba1 (Figure S1F), and the endothelial cell marker tomato lectin (Figure S1G) were EGFP−. No axons in the optic nerve or corpus callosum were EGFP+. Scattered neurons in the granule cell layers of the hippocampus and cerebellum were EGFP+, as were rare interneurons of the olfactory bulb (not shown).
The cellularity of optic-nerve cross-sections in hematoxylin and eosin (H&E)-stained paraffin sections did not change, and there was no increase in cell proliferation as assessed by bromo-deoxyuridine (BrdU) or Ki67/EGFP+, or cell death as assessed by TUNEL/caspase-3 immunohistochemistry (not shown). Furthermore, cell counts for NG2 and CC1 did not change in the optic nerve or corpus callosum (Figures S1H and S1I). Olig2 cell counts did increase in the corpus callosum, as expected from previous studies (Wang et al., 2012).
To mimic a severe form of Costello syndrome, we used a hemagglutinin (HA)-tagged CNP-HRasG12V mouse model (CNP-HRas). In this mouse, Ras-GTP is constitutively expressed (Figure S2A) as predicted for this G12V allele (Gysin et al., 2011; Patel et al., 2012). Immunohistochemical analysis confirmed HA staining primarily in the white matter of CNP-HRas animals (Figure S2C), which was absent in wild-type (WT) brain (Figure S2B). In the corpus callosum, the HA tag localized primarily to cell processes (Figure S2D). Verifying HA-Ras expression in mature oligodendrocytes, MAG+ ad-axonal membranes showed extensive overlap with the HA tag (Figure S2E) and MBP+ compact myelin was partly colocalized (Figure S2F). Astrocytes did not express HRasG12V (Figure S2G).
Nf1 Loss or HRas Activation in Oligodendrocytes Causes Optic-Nerve Enlargement, Myelin Decompaction, Loss of Claudin-11, and Altered Connexin 32 Localization
To test whether white matter structure is altered by Nf1 loss or Ras activation, we examined the brains of PlpCre;Nf1fl/fl mice exposed to tamoxifen at 2 months of age, and CNP-HRas mice (n = 5/genotype). Optic nerves were enlarged in PlpCre;Nf1fl/fl, and CNP-HRas mice at 12 months compared with WT animals (Figures 1A and 1B; quantification in Figure S3; p < 0.001), and the corpus callosum was enlarged in the PLPCre model (Figures S3C and S3D; p = 0.8 × 10⁻⁷).
Figure 1. Nf1 Loss or HRas Activation in Oligodendrocytes Causes Optic-Nerve Enlargement, Myelin Decompaction, Loss of Claudin-11, and Altered Cx32 Localization.

(A) Gross micrographs of optic nerves at the level of the chiasm in 12-month-old animals. Ruler shows 1 mm markings.
(B) Toluidine-blue-stained semithin optic-nerve cross-sections, 1 mm rostral to the chiasm.
(C) Optic-nerve g-ratio scatterplots (~5,000 axons/graph; measurements 1 mm rostral to the chiasm in three to five electron micrographs at 10,000×). Red box: 99% of WT g-ratios superimposed upon graphs of other genotypes. ANOVA, Tukey post hoc, p = 2.2 × 10⁻¹⁶.
(D) Diagram of myelin compaction. Brown circle: axon cross-section; gray: major dense lines (MDLs); orange: Cx32 GJs between compact myelin layers; blue lines: claudin-11+ TJs in compact myelin.
(E) Electron micrographs (scale bar, 10 nm) of WT, PLPCre;Nf1 fl/fl, and CNP-HRas optic-nerve myelin. White arrows: intraperiod lines (ILs); black arrows: MDLs.
(F–I) Western blots of total optic-nerve lysate or whole-brain cytosolic, endosomal, or myelin fractions showing myelin proteins (F), claudin-11 (G), or Cx32 cellular localization (H and I). n = 3–5 animals/genotype/experiment.
See also Figures S1, S2, S3, and S4.
To explain the increases in optic-nerve size, we performed electron microscopy. In normal nerves, myelin sheath thickness is proportional to the diameter of a wrapped axon. Pathological changes in myelin thickness can be quantified via a g-ratio analysis. A g-ratio analysis shows the extent of myelin disruption and the prevalence of the myelin abnormalities in >5,000 axons per genotype, and unbiased counting of myelinated axons in optic-nerve sections revealed significantly shifted gratios after loss of Nf1 or hyperactivation of HRas (Figure 1C). The g-ratios in mutant optic nerves shifted both to the right and down, indicating increased axonal diameter and myelin thickness in Nf1-deficient and HRasG12V mutant mice. In mutant animals, 35% of myelinated axons had g-ratios < 0.5; in contrast, 0.01% of WT fibers had g-ratios < 0.5. Analysis of electron micrographs showed that myelin in mutants was expanded due to splitting/decompaction of myelin lamellae rather than an increase in the number of lamellae. In cross-section, compact myelin is composed of major dense lines (compressed cytoplasm) and intraperiod lines composed of adjacent plasma membranes (see model in Figure 1D). After Nf1 loss or HRas-GTP expression in oligodendrocytes, the intraperiod lines were separated by extracellular space (Figure 1E).
Myelin decompaction can occur due to alterations in myelin, TJ, and/or GJ proteins. The brain myelin proteins 2′,3′-cyclic nucleotide 3′-phosphodiesterase (CNP) and PLP showed no significant changes in concentration (Figure 1F). The myelin basic protein (MBP) protein 24 kDa band decreased with a corresponding increase in 14 and 18 kDa bands, possibly reflecting changes in isoform expression. TJs span compact myelin layers (see schematic in Figure 1D). Claudin-11 levels in optic-nerve lysates were reduced after Nf1 loss or HRasG12V expression (Figure 1G).
Because claudin-11 loss alone is insufficient to explain the observed myelin decompaction, we analyzed the GJ protein connexin 32 (Cx32), which is normally found at myelin interperiod lines (Ahn et al., 2008). Cx32 messenger RNA (mRNA) was unchanged (not shown). Cx32 protein was increased in optic-nerve lysates after Nf1 loss or hyperactivation of HRas (Figure 1H). To define Cx32 distribution, we fractioned brain membranes by density centrifugation. In WT brains, Cx32 was enriched in myelin, whereas after Nf1 loss or HRasG12V expression, Cx32 was concentrated in plasma membrane/endosomal fractions (Figure 1I). Band shifts characteristic of phosphorylated and dimerized Cx32 proteins were also present in mutant cytoplasmic fractions.
Correlates of increased axon diameter can include alterations in mitochondria in affected axons. Confirming our g-ratio analysis, electron microscopy displayed enlarged axons that may contribute to enlarged white matter tracts (Figure S4A). Because Ras has been shown to directly regulate mitochondria, it is interesting to note that in some axons in PLP; Nf1floxed (not shown) or CNP-HRas animals, mitochondria were more numerous, present near noncompact myelin, or showed abnormal cristae (Figures S4B and S4C). Neuronal cell death, as indicated by cleaved caspase3+ in cell bodies, was present in the retinal ganglion cell layer of mutants (Figure S4D).
GJs Are Lost in Enlarged Astrocyte Endfeet after Nf1 Loss or HRas Activation
Increased myelin sheath diameters partially accounted for optic-nerve enlargement. Electron microscopy also revealed aberrantly wide perivascular space surrounding the capillaries in mutant optic nerves (Figure 2A; quantification in Figure 2C). The expanded perivascular space contained enlarged astrocyte endfeet surrounding endothelial cells (Figure 2B). These swollen endfeet contain increased numbers of mitochondria (not shown), indicating a possible shift in metabolic load at these sites. In WT brains, adjacent astrocyte endfoot membranes contain GJs composed of Cx43 (Simard et al., 2003). GJs appear as characteristic electron-dense plaques at opposed astrocyte membranes (Figure 2B, red arrows: GJ). In contrast to the WT brain, electron-dense plaques were rarely observed in astrocyte end-feet surrounding optic-nerve capillaries after Nf1 loss or HRas activation (Figure 2B, arrowheads; quantification in Figure 2D).
Figure 2. GJs Are Lost in Enlarged Optic-Nerve Astrocyte Endfeet after Nf1 Loss or HRas Activation.

(A) Electron micrograph cross-sections of capillaries and perivascular space in optic nerve 1 mm from the chiasm (10,000×; scale bar, 2 μm).
(B) Left: Diagram of capillary. Yellow: GJs. As, astrocyte endfoot; BV, blood vessel; Endo, endothelial cell.
(B) Electron micrographs of capillaries 1 mm from the chiasm (50,000×; scale bar, 250 nm). Red arrows: GJs on astrocyte endfeet; red arrowheads: astrocyte endfeet lacking GJs.
(C) Quantified perivascular area (% total area divided by vascular area).
(D) Percentage of astrocyte endfeet with visible GJs.
(E and F) Western blots using total optic-nerve lysate (E) or whole-brain endosomal fractions (F) showing Cx43. n = 3–5 animals/genotype. *p < 0.01.
Reductions in visible GJs at astrocyte endfeet could result from changes in Cx43, which is astrocyte specific in the brain. Quantitative RT-PCR did not show changes in Cx43 mRNA expression (not shown). Cx43 protein was decreased in PLP;Nf1fl/fl or CNP-HRas animals’ optic nerves (Figure 2E), but was not detectably changed in whole-brain lysates (Figure 2F). Decreased Cx43 was detectable in oligodendrocyte-rich myelin tracts, where Nf1/Ras mutant cells are enriched.
Nf1 Loss or HRas Activation in Oligodendrocytes Results in Changes in Endothelial Claudins and BBB Permeability
Astrocytes induce endothelial cells to form TJs, which are critical for the formation of the BBB (Wolburg and Lippoldt, 2002). TJs appear as continuous electron-dense plaques between endothelial cells in transmission electron micrographs (Figure 3A, top left). After Nf1 loss or HRasG12V expression, TJs were present between endothelial membranes but contained gaps. We found similar gaps in electron micrographs of optic-nerve blood vessels in a human NF1 autopsy sample (Figure 3A, blue arrowheads; quantification in Figure 3B). The use of human tissue was approved by the institutional review board of the Cincinnati Children’s Hospital.
Figure 3. Nf1 Loss or HRas Activation in the Optic Nerve Causes Changes in Claudins and BBB Permeability.

(A) Electron micrographs of optic-nerve cross-sections of capillaries 1 mm from the chiasm (50,000×; scale bar, 200nm) show electron-dense TJs between endothelial cells. Blue arrowheads: areas of TJ disruption.
(B) Quantification of the total TJs with gaps, with 200–300 TJs counted per genotype.
(C) Evans blue stain of longitudinal sections of PLPCre; Nf1fl/fl and CNP-HRas optic nerve. Insets: cross-sections; arrows: blood vessel.
(D) Western blots from total optic-nerve lysates showing claudin-1 and claudin-5. All experiments included three to five animals per genotype. *p < 0.001.
See also Figure S5.
To test whether loss of astrocyte endfoot GJs and endothelial TJ malformations result in functional alterations in the BBB, we injected Evans blue dye into WT, PlpCre;Nf1fl/fl, and CNP-HRas mice. As expected, 24 hr later the WT animals displayed no Evans blue leak. Strikingly, both PlpCre;Nf1fl/fl and CNP-HRas optic nerves showed residual dye in the perivascular space (Figure 3C). No detectable Evans blue dye was found in the parenchyma, indicating that leakage, but not extensive BBB disruption, occurred in the capillaries. Western blot analysis showed downregulation of the BBB TJ protein claudin-1 and loss of claudin-5 dimer after Nf1 loss or HRasG12V expression (Figure 3D), confirming endothelial TJ impairment. Vasculature abnormalities must be non-cell autonomous, as neither the PlpCre driver nor CNP-HRas was expressed in astrocytes or endothelial cells.
Optic-Nerve Enlargements Are Not Gliomas
NF1 patients are predisposed to grade 1 pilocytic astrocytomas, which are frequent along the visual pathway and are characterized by optic-nerve enlargement, astrocyte proliferation, angiogenesis, and deposition of Rosenthal fibers and eosinophilic granular bodies (Perilongo et al., 2012). None of these features were present after Nf1 loss or HRasG12V expression in oligodendrocytes. GFAP immunohistochemistry of optic-nerve cross-sections revealed no reactive or neoplastic astrocyte cell proliferation up to 12 months after tamoxifen injection (Figure S5A). Although there was a significant increase in the number of blood vessels per optic-nerve cross-section in the PLP;Nf1fl/fl and CNP-HRas mice (not shown), it was not significant after normalization to the nerve area (Figure S5B). The cellularity of optic-nerve cross-sections in H&E-stained paraffin sections did not change, and there was no increase in cell proliferation as assessed by BrdU or Ki67/EGFP+ immunohistochemistry (not shown). H&E analysis of optic-nerve sections (cross and longitudinal) revealed one case of focal, infiltrating optic glioma without the presence of inflammatory cells or increased reactive gliosis (not shown); however, this was very rare (n = 1/60).
Despite the absence of proliferating EGFP+ cells at 12 months after tamoxifen injection, EGFP+ cells remained numerous in PlpCre;Nf1fl/fl;EGFP+ animals, but diminished over time in PLPCre;Nf1WT;EGFP+ optic nerve (Figure S5C). EGFP+ cells were present along the ventricular walls, where many migratory NG2+ progenitor cells are normally found. Immunohistochemistry revealed NG2+/EGFP+ double-positive cells in the subventricular zone of PlpCre animals (Figure S5D). This may explain the persistence of EGFP+ cells in the mutant optic nerves long after tamoxifen exposure, as NG2+, Nf1+/−, and Nf1−/− progenitors proliferate more than their WT counterparts and NG2+ progenitors migrate from the third ventricle to the optic nerves during development (Bennett et al., 2003; Hegedus et al., 2007).
Myelin Decompaction and TJ and GJ Cellular Changes Resulting from Oligodendrocyte-Specific Ras Activation Are NO Dependent
The identification of non-cell-autonomous changes in astrocytes and endothelial cells after loss of Nf1 or HRasG12V expression in oligodendrocytes prompted us to consider whether a secreted Ras-dependent effector molecule might be produced by mutant oligodendrocytes. We focused on ROS because increased ROS can affect the BBB (Komatsu et al., 1999), and ROS was implicated downstream of Ras (Ferro et al., 2012) and Nf1 (Tong et al., 2007). ROS include hydrogen peroxide (H2O2), superoxide O2−, and NO. NO is an important signaling molecule that is synthesized inside cells from L-arginine, oxygen, and nicotinamide adenine dinucleotide phosphate (NADPH) by mammalian NOS (NOS1, NOS2, and NOS3). Inside target cells, NO activates guanylate cyclase, oxidizes, ADP ribosylates, and nitrosylates proteins, DNA, and lipids. All three NOS proteins were upregulated in optic-nerve lysates after Nf1 loss or HRasG12V expression (Figure 4A). ROS reaction products were also significantly increased in the CNP-HRas optic nerves (Figure 4B) and were diminished by preincubation with the NOS inhibitor NG-nitro-L-arginine methyl ester (L-NAME; Figure 4B, bottom), indicating the contribution of NO species.
Figure 4. Increased ROS after Nf1 Loss or HRas Activation.

NOS sufficiency for phenotype presentation.
(A) Western blot analysis of NOS (NOS1–NOS3) in optic-nerve protein lysates. Blot intensity was measured with ImageJ software and caps at upper intensity levels; “max” indicates intensity beyond the upper intensity limitations.
(B) DCF-DA stain in unfixed optic-nerve cross-sections (5×; inset: 40×) from WT and CNP-HRas mice with and without the NOS inhibitor L-NAME. White line shows optic-nerve boundaries.
(C) g-Ratio scatterplots show measurements of >1,000 axons/animal.
(D) Quantification.
(E–K) Electron micrographs of optic-nerve cross-sections 1 mm rostral to the chiasm (E and G: 10,000× and scale bar, 2 μm; I and K: 50,000× and scale bar, 100 nm).
(F) Optic area quantified in semithin cross-sections 1 mm rostral to the chiasm.
(H, J, and L) Quantification of perivascular area (H), percentage of astrocyte endfeet with visible GJs (J,~300 GJs/animal), and percentage of endothelial cells with TJ gaps (L, ~50–60 TJs/animal) measured using electron microscopy; n = 3–5 animals/genotype.
See also Figures S6 and S7.
To test whether the cellular phenotypes identified were caused by upregulation of NOS, CNP-HRas animals were administered L-NAME for 7 days and then the optic nerves were processed for electron microscopy. L-NAME rescued abnormal g-ratios (Figures 4C and 4D), perivascular area (Figures 4G and 4H), astrocyte GJs (Figures 4I and 4J), and endothelial TJs (Figures 4K and 4L). However, L-NAME administration for 7 days failed to rescue the increases in axon diameter (Figures 4E and 4F). Similar results were obtained in PLP;Nf1fl/fl animals (not shown).
Nf1 Haploinsufficiency in Oligodendrocytes Causes Myelin and Vascular Phenotypes
Most NF1 patients are heterozygous for the NF1 mutation; therefore, we examined whether heterozygous loss mimicked the myelin and/or vascular phenotypes identified in PLPCre;Nf1fl/fl and CNP-HRas models. Optic nerves were significantly enlarged in PLPCre;Nf1fl/+ animals (Figures 5A and 5B; p < 0.0001), but not in Nf1+/− animals (p = 0.41). Both Nf1+/− and PLPCre;Nf1fl/+ mice showed myelin g-ratio changes (Figure 5C), myelin decompaction with concurrent axonal enlargement (see Figure S7), Cx32 protein mislocalization (not shown), increased perivascular space with enlarged astrocyte endfeet (Figures 5D and 5E), and endothelial TJ disruptions (Figure 5F). On a molecular level, the heterozygotes showed increased NOS (NOS1–NOS3) protein expression in optic-nerve lysates (Figure 5G) and downregulation of optic-nerve Cx43 (Figure 5H).
Figure 5. Heterozygous Nf1 Loss in Oligodendrocytes Causes Myelin and Vascular Phenotypes.

(A) Gross micrographs of optic nerves at the level of the chiasm in 12-month-old animals. Ruler shows 1 mm markings.
(B–F) Optic nerve 1 mm rostral to the chiasm.
(B) Toluidine-blue-stained semithin cross-sections.
(C) Scatterplots of g-ratios (~5,000 axons/graph) from three to five electron micrographs (10,000×) of three to five animals/genotype. Red box: 99% of WT g-ratios superimposed upon graphs of other genotypes. ANOVA, Tukey post hoc, p = 2.2 × 10⁻¹⁶.
(D) Electron micrographs of capillaries and perivascular space (10,000×; scale bar, 2 μm).
(E) Electron micrographs of optic-nerve cross-sections of capillaries (50,000×; scale bar, 200 nm). Red arrows: GJs on astrocyte endfeet; red arrowheads: astrocyte endfeet without GJs.
(F) Electron micrographs of TJs between endothelial cells (50,000×, scale bar, 200 nm). Blue arrowheads: areas of TJ disruption.
(G) Western blot analysis of NOS (NOS1–NOS3) in total optic-nerve lysates.
(H) Western blots in total optic-nerve lysate showing Cx43.
Myelin Decompaction and Perivascular Changes Are Also Found in the Corpus Callosum after Nf1 Haploinsufficiency or HRas Activation
The corpus callosum is enlarged in many NF1 patients. We examined electron micrographs from Nf1+/−, PlpCre;Nf1fl/+, PlpCre;Nf1fl/fl, andCNP-HRas animals, and found myelin decompaction at intraperiodlines, expanded perivascular space with loss of GJs at astrocyte end feet (blue arrows), and changes in endothelial TJ (not shown; Figure S6). The data were confirmed by g-ratio analysis (not shown). Thus, Nf1 loss or HRasG12V in oligodendrocytes also affects hemispheric white matter. Corpus callosum size was measured from paraffin coronal sections at the level of rostral anterior commissure from three to seven animals per genotype. The corpus callosum of PlpCre;Nf1fl/+ and PlpCre;Nf1fl/fl animals was significantly increased when compared with WT controls (p = 0.6 × 10⁻⁵, p = 0.7 × 10⁻⁶, respectively; Figures S3C and S3D). Changes in the size of the corpus callosum in Nf1+/− and CNP-HRas mice were not significant.
Generation of Increased ROS Is Intrinsic to Oligodendrocytes
To determine which cell population(s) had increased ROS, we dissociated cells from the forebrain and optic nerve of PLP;Nf1fl+;eGFP mice (6 months after tamoxifen injection). We monitored the fluorescent ROS reporter 2′,7′-dichlorodihydrofluorescein diacetate (DCF-DA) by flow cytometry. There was no significant shift in DCF-DA fluorescence intensity (p = 0.74) or total live DCF-DA+ CNS resident cells (p = 0.51), although an increase was observed in some individual mutant mice (Figure 6A). We used gates to discriminate cell types (Figure 6B, top two rows). Importantly, a significant increase (p = 0.05) in DCF-DA fluorescence intensity was present in sorted GalC+ oligodendrocytes after Nf1 loss (Figure 6B, bottom row). In contrast, platelet-derived growth factor receptor α (PDGFRα)+ progenitors, GFAP+ astrocytes, intercellular adhesion molecule 1 (ICAM1)+ endothelial cells, and CD45+ blood cells/microglia in the mutant brains showed similar ROS compared with WT cells. Because EGFP expression is Cre driven, most sorted EGFP+ cells from PlpCre;Nf1fl/+ mice are Nf1 mutant, and EGFP− cells are WT. Strikingly, there was a significant increase in Cell ROX Orange ROS reporter fluorescence intensity in both EGFP+ recombined (p = 0.01) and EGFP− (p = 0.001) GalC+ oligodendrocytes after Nf1 loss (Figure 6C). The GFP− population was larger (p = 0.005) than that of GFP+ recombined cells, likely reflecting the larger number of total gated cells. Overall, the data indicate that Nf1 loss results in ROS accumulation in mutant oligodendrocytes. ROS also accumulates in other oligodendrocytes, possibly those coupled directly by GJs.
Figure 6. Increased Reactive Oxygen Is Detected Only in Oligodendrocytes.

(A) DCF-DA fluorescence intensity measured by flow cytometry in dissociated forebrain + optic nerves of WT and PLP;Nf1fl+ mice 6 months after tamoxifen injection. Gates for DCF-DA with cell percentages indicated.
(B) Gates were used to discriminate cell types. Top row: WT animals are shown with red gates. Middle row: PLP;Nf1fl+ animals are shown with blue gates. Bottom row: DCF-DA fluorescence intensities per cell type with WT (red) and PLP;Nf1fl+ (blue) lines.
(C) Cell Rox Orange fluorescence in GFP− and GFP+ cells.
The Antioxidant N-Acetyl Cysteine Rescues Myelin and Vascular Phenotypes in PLP;Nf1floxed and CNP-HRas Mice
Available inhibitors of NOS are broad spectrum and/or affect subsets of synthases. We tested a broad-spectrum antioxidant that is not specific for NOS, but can be used in vivo for prolonged periods. We administered the antioxidant N-acetyl cysteine (NAC; 0.001% in drinking water) to PLP;Nf1fl/+, PLP;Nf1fl/fl, and CNP-HRas animals. In the PLP models, NAC was administered 6–8 months after tamoxifen injection. In CNP-HRas mice, NAC was administered beginning at 10 weeks of age. In each case, phenotypes were rescued by 6 weeks of NAC exposure— completely in CNP-HRas mice and to a lesser extent in Nf1 mutants. Optic-nerve diameter was rescued (Figure 7A) and g-ratios normalized in all strains (Figure 7B). Perivascular space was rescued (Figure 7D), as were GJs in astrocyte endfeet (Figure 7E). Myelin compaction was also rescued in all strains (Figure S7). Changes in axon diameter (Figure 7C) and TJ gaps (Figure 7F) varied among the animals and were not significant when compiled for PLP;Nf1fl/+ or PLP;Nf1fl/fl mice; however, Evans blue staining showed no BBB leak in the optic nerve in any mutant model after NAC administration (not shown).
Figure 7. The Antioxidant NAC Rescues Myelin and Vascular Phenotypes in PLP;Nf1floxed and CNP-HRas Mice.

Quantification of phenotypes in WT, PLP;Nf1fl+, PLP;Nf1fl/fl, and CNP-HRas animals after 6 weeks of vehicle or NAC treatment, all in optic nerve 1 mm rostral to the chiasm.
(A) Optic-nerve diameter quantified from semithin cross-sections.
(B and C) Quantification of g-ratio (B) and axon diameter (C) of >1,000 axons/genotype measured by electron microscopy.
(D) Quantification of % perivascular area normalized to blood vessel area.
(E) Percentage of astrocyte endfeet with visible GJs (~300 GJs/animal).
(F) Percentage of endothelial TJs with gaps (~50–60 TJs/animal); n = 3–5 animals/genotype.
CNP-HRas Animals Have Hyperactive Locomotion and Hypersensitivity to Startle
Changes in myelin have recently been correlated with changes in behavior, and NF1 and Costello syndrome patients are known to display frequent behavioral deficits; therefore, we tested whether behavior was altered in mice with elevated Ras-GTP in oligodendrocytes. Because the PLP;Nf1flox;eGFP mouse lines were on a mixed strain background, we focused behavioral experiments on the CNP-HRas animals on a pure C57Bl/6 background. CNP-HRas animals were hyperactive in a locomotor task (Figure 8A, p = 0.045) and swam faster in the cued Morris water maze (Figure 8B, p = 0.01) as compared with littermate controls. They also showed a trend toward a hyperreactive startle response (Figure 8C, p < 0.07). No significant differences were noted in parallel bars, tremor, or in the learning and memory phases of the Morris water maze (not shown). NAC exposure increased locomotor activity in the WT mice, correlating with myelin decompaction, GJ and TJ changes, and Evans blue BBB leak (not shown), indicating that high antioxidant exposure in normal animals without high ROS levels can be detrimental. In contrast, 6 weeks of NAC treatment decreased locomotor activity in the CNP-HRas mice by 30.8%, bringing them below control levels (p < 0.01). NAC normalized swim speed in the cued Morris maze, but did not modify the startle response in these mice. Thus, behavioral changes induced by Ras upregulation in oligodendrocytes are partially reversible by antioxidant therapy.
Figure 8. CNP-HRas Animals Have Hyperactive Locomotion and Hypersensitivity to Startle Behaviors.
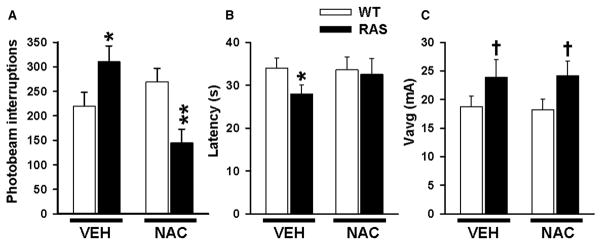
Quantification of behavior in CNP-HRas mice after 6 weeks of vehicle or NAC treatment.
(A) Peripheral beam interruptions on locomotor behavioral test. *Vehicle p < 0.05; **NAC p < 0.01.
(B) Mouse swim latency to get to the cued platform during day 1 of the Morris water maze task. *Vehicle p < 0.05; NAC p > 0.08.
(C) Average startle Vavg. † Vehicle p = 0.07; NAC p < 0.07; n = 15/genotype/treatment.
DISCUSSION
We generated a CNP-HRasG12V mouse model to examine the role of HRas activation in oligodendrocytes. A striking gross abnormality in Ras mutant brain was enlargement of optic nerves. This finding extended to the PLPCreERT;Nf1floxed mouse models, consistent with the idea that the cellular effects of Nf1 loss of function in adult myelin are mediated through Ras activation. This enlargement of white matter is consistent with previously reported white matter enlargement and macrocephaly in NF1 patients, which lacked a cellular or molecular explanation (Pride et al., 2010; Karlsgodt et al., 2012). We find that Ras pathway activation in oligodendrocytes upregulates NOS and elevates oligodendrocyte ROS, including NO. NO modulates TJ and GJ proteins in oligodendrocytes and in surrounding astrocytes and endothelial cells, affecting brain permeability and contributing to behavioral abnormalities. These data provide a potential cellular and molecular mechanism of Rasopathy brain abnormalities. It will be of interest to closely examine the brains of Rasopathy patients for white matter enlargement and the cellular features we have identified.
Using inducible Plp-Cre, we targeted loss of Nf1 to mature adult oligodendrocytes. Similar phenotypes developed as compared with the CNP-HRas model in which oligodendrocytes were affected beginning during development. Given our ability to rescue phenotypes in both models during adulthood, the data argue that these brain defects are not developmental in origin. These data are consistent with findings that learning defects can be rescued in adult mice with Nf1 mutations (Li et al., 2005). Wang et al. (2012) rescued enlarged corpus callosum size with MEK inhibitors administered from birth to postnatal day 18. Our data support the idea that critical defects can be rescued after they form, even into adulthood.
Some differences between the Plp-Cre;Nf1fl/fl and CNP-HRas models were observed. Although all cellular phenotypes were detected in both models, the corpus callosum was not significantly enlarged in the CNP-HRas mice. In Costello syndrome, the brain can atrophy. It remains possible that the size of the corpus callosum in our mouse model changed with the age of animals studied. Also, although NAC exposure rescued g-ratios, GJs, and perivascular abnormalities in both models, axon diameter was rescued in the CNP-HRas model but not in the Plp-Cre;Nf1 model. These differences may be caused by the fact that H-Ras is constitutively GTP loaded in CNP-HRas oligodendrocytes, whereas Ras loading in Nf1 mutants, including oligodendrocyte lineage cells, can have elevated basal Ras-GTP yet also maintain cytokine/growth factor responsiveness (Bennett et al., 2003). In addition, loss of Nf1 protein is predicted to activate all Ras proteins, whereas only H-Ras should be activated in CNP-HRasG12V mice.
Patients with NF1 are predisposed to develop grade 1 pilocytic optic-nerve gliomas. In humans, and especially in NF1 patients, some pilocytic tumors grow while others do not. At present, MRI optic-nerve enlargement alone is diagnostic for optic glioma in NF1 patients (Perilongo et al., 2012). Our results identify a potential mechanism that may underlie optic-nerve enlargement in some patients who do not progress to tumors, and suggest that optic-nerve enlargement may not be sufficient for glioma diagnosis. The use of an antioxidant might provide therapeutic options to these patients and at least partially reduce nerve size.
Nf1 loss or HRas activation in oligodendrocytes did not cause optic glioma, and the mice did not display cytological atypia or increased astrocyte proliferation characteristic of pilocytic astrocytoma. NG2-Cre-mediated inactivation of Nf1 also did not cause mouse optic glioma (Solga et al., 2013). Our PLPCre; Nf1floxed and CNP-HRas mouse models were similar to GFAP-Cre; Nf1fl/− mice, with optic-nerve enlargement and myelin disorganization (Kim et al., 2010). GFAP-Cre;Nf1fl/− mice have loss of Nf1 in most or all of their brain cells. The enlarged optic nerve and disruption of myelin sheaths that are features of all three models are likely caused by defects in oligodendrocytes. Our identification of cell-autonomous Nf1/Ras contributions in oligodendrocytes represents a first step in defining how specific cell types contribute to optic-nerve enlargement in NF1 patients.
Changes in the brain structure of NF1 patients can be global, and possibly caused by mutation in a single Nf1 allele (van Engelen et al., 2008; Karlsgodt et al., 2012). It is therefore relevant that myelin decompaction, swollen perivascular astrocyte endfeet, and TJ integrity phenotypes were identified in PLPCre;Nf1fl/+ and PLPCre;Nf1fl/fl mice. Nf1+/− mice also showed these phenotypes, although they were less frequent than in PLPCre;Nf1fl/+, PLPCre;Nf1fl/fl, or CNP-HRasG12V mice. Nf1+/− optic nerves also did not show significant enlargement. We speculate that Nf1+/− cells outside the oligodendrocyte lineage limit these phenotypes, possibly by scavenging excess extracellular reactive oxygen.
Cell-autonomous myelin decompaction correlated with a reduction in the TJ protein claudin-11 and mislocalization of the GJ protein Cx32. We identified Cx32 band shifts characteristic of phosphorylated and dimerized Cx32 proteins, which target Cx32 into endosomes and decrease GJ assembly (Segretain and Falk, 2004). Because claudin-11-KO alone is insufficient for myelin decompaction, our data support a role for the combined loss of claudin-11 and Cx32 in myelin decompaction.
Rasopathy patients, including those with Costello, Noonan, LEOPARD, and cardiofaciocutaneous (CFC) syndromes and NF1, can have heart and/or bone abnormalities (Tidyman and Rauen, 2008). Connexins are vital for normal heart and bone function (Radosinska et al., 2011; Saura et al., 2010; Zhang et al., 2006), and can regulate ROS transfer (Taniguchi Ishikawa et al., 2012). NO regulates Cx43 through transcriptional modulation and phosphorylation (Radosinska et al., 2011; Zhang et al., 2006). For example, NOS inhibition alters Cx43 concentration and GJ function in cardiomyocytes (Dlugosova et al., 2009), and NOS (eNOS and iNOS)-KO mice show bone and heart abnormalities (Afzal et al., 2004; Saura et al., 2010). Ras regulation of NOS (with changes in both connexins and claudins) may be relevant in multiple organ systems in Rasopathy patients.
TJs are present in compact myelin and between brain endothelial cells, where they form the BBB. We focused on the claudin family of TJ proteins in part because of their expression in peripheral nerve tumors from NF1 patients (Pummi et al., 2006). Claudins determine the selectivity of paracellular transport, and the barrier properties of claudins are regulated by environmental cues. NO can modulate claudin expression and subcellular targeting, and assembly of claudin-containing TJs (Wolburg and Lippoldt 2002; reviewed in Angelow et al., 2008). The specific properties of claudins modulated by Ras and Nf1 in oligodendrocytes and endothelial cells remain to be studied.
By using a new method to dissociate living brain cells and analyze them by fluorescence-activated cell sorting (FACS), we showed that only GalC+ oligodendrocytes had elevated levels of ROS in mutant brains. The oligodendrocyte ROS likely contains NO, because L-NAME rescued DCF-DA reactivity in tissue sections and myelin compaction in vivo. L-NAME is an L-arginine analog, a competitive inhibitor of NOS that is widely used as a NO inhibitor in cell and animal studies. As with any inhibitor, off-target effects may limit interpretation. For L-arginine analogs, the described off-target effects are inhibition of L-arginine transport, resulting in NOS inhibition due to substrate depletion, and interaction with cellular iron complexes, as in NOS enzymes, which also result in NO depletion (Robertson et al., 1993). Finally, regarding specificity, we note that hyperoxia rescued L-NAME-induced limb deficits in an animal model, limb defects that can be mimicked by eNOS knockout (Tiboni et al., 2003). In this study, we were able to block DCF-DA fluorescence (which reads out reactive oxygen, NO, and reactive nitrogen species) using L-NAME in tissue sections from mutant mice, supporting our hypothesis that NOS and NO are relevant to the phenotypes described. However, roles for other ROS cannot be excluded by these studies. How oligodendrocyte ROS affects astrocytes and endothelial cells (which lack detectable increases in ROS) also remains unclear. Yet, L-NAME reversed GJ and TJ phenotypes in astrocytes and endothelial cells in vivo, indicating that blocking NO is sufficient to rescue these phenotypes. Extracellular NO can alter GJ function in astrocytes in vitro in an L-NAME-dependent manner (Gandhi et al., 2010). ROS may diffuse from oligodendrocytes to affect other cell types, although it is likely to diffuse only short distances before being reduced by contact with proteins and lipids. Alternatively, NO may diffuse from oligodendrocytes through GJs to neighboring astrocytes, yet remain below our level of detection in an astrocyte population analysis.
Viosca et al. (2009) found that mice with germline G12VH-Ras are hyperactive and show hypersensitivity. We found that CNP-HRas mice also show locomotor hyperactivity that can be rescued with antioxidants. Elevation of oxidative stress is known to cause locomotor hyperactivity in mice (Chen et al., 2012; Dumont et al., 2011). Increased reactive oxygen and impaired oxidative balance occur in patients with attention deficit hyperactivity disorder (Selek et al., 2012), suggesting that ROS may play a role in human hyperactivity. NO may also play a role in epileptiform hyperactivity, as anticonvulsants diminish NO levels (Vega Rasgado et al., 2011). It is therefore relevant that up to 60% of NF1 and Rasopathy patients present with hyperactivity (Acosta et al., 2012; Tidyman and Rauen, 2008).
Six weeks of NAC treatment increased locomotor activity in WT mice. Antioxidant treatment in WT mice also opened the BBB to Evans blue dye and caused some myelin decompaction with GJ and TJ changes (not shown), indicating that high antioxidant treatment in animals without high ROS levels can be detrimental. These data support our finding that reactive oxygen balance is important for the cellular phenotypes identified, and suggest that antioxidant treatment could be used to temporarily open the BBB.
In summary, we have identified a pathway in which increased Ras-GTP in oligodendrocytes, through NOS/ROS, disrupts myelin compaction, TJ and GJs, and BBB permeability, with behavioral consequences. The relationship among these phenotypes and the potential for antioxidant therapies for Rasopathy patients will be important subjects for future studies.
EXPERIMENTAL PROCEDURES
Mice
PlpCreERT; Nf1fl/+; eGFP and PlpCreERT; Nf1fl/fl; eGFP mouse husbandry, tamoxifen injections, tissue processing, histology, and electron microscopy were performed as previously described (Mayes et al., 2011). WT and Nf1+/− were mice backcrossed for >30 generations onto a C57Bl6 background and genotyped by PCR (Brannan et al., 1994). Transgenic HRASG12V mice were created using a promoter from the CNP gene (Patel et al., 2012). Mice were backcrossed for more than eight generations onto a C57Bl/6 background and maintained on the male.
Antibodies
Cryostat sections were processed for immunohistochemistry and imaged as previously described (Mayes et al., 2011) with markers for EGFP (GFP 1:2,000; Millipore), oligodendrocytes (Olig2 1:500, Millipore #AB9610; CC1 1:2,000, Calbiochem), progenitor cells (NG2 1:500, Millipore #AB5320), astrocytes (GFAP 1:500, Millipore #MAB360 or 1:1,000 DAKO), microglia (Iba1 1:2,000, Wako #019-19741), and neurons (NeuN 1:500, Chemicon #MAB377). Anti-Ki67 (1:250, Leica Novocastra #KI67P-CE) was used to determine cell proliferation. For HA staining, we used an anti-HA-epitope tag (1:200, Cell Signaling #2350S).
g-Ratio Analysis
g-Ratios were determined by dividing the diameter of each axon by the diameter of the same axon together with its myelin sheath in 1,000–2,000 axons per animal (n = 3–5 per genotype) using ImageJ software.
Western Blots
Optic nerves (n = 3–5 animals/genotype) were individually lysed and sonicated in 200 μl lysis buffer on ice and then clarified by centrifugation. Protein (30–50 μg) was separated by electrophoresis on SDS-polyacrylamide gradient gels (4%–20%; ISC BioExpress) and transferred to polyvinylidene difluoride membrane (BioRad). Membranes were probed with antibodies against myelin basic protein (SMI-99, 1:2,000, Calbiochem #NE1019), CNP (1:1,000, Cell Signaling Technologies 5664), PLP (1:2,000, Aves Labs), eNOS (1:1,000, Cell Signaling Technologies #9586S), iNOS (1:1,000, Cell Signaling Technologies #2977S), nNOS (1:1,000, Cell Signaling Technologies #4231S), connexin 32 (1:500, Invitrogen #138200), connexin 43 (1:100, Invitrogen #710700), claudin-1 (1:200, Invitrogen #71-7800), claudin-5 (1:1,000, Invitrogen #34-1600), and claudin-11 (1:1,000, Invitrogen #36-4500). They were then reprobed with anti-β-actin (1:5,000, Cell Signaling Technologies #4967) or MEK1/2 (1:1,000, Cell Signaling Technologies #4694S) as loading controls. Digitized blots were inverted and band intensities were quantified using ImageJ software.
Ras Activation Assay
Adult brains were homogenized on ice and levels of activated Ras were determined using a Ras activation assay kit (Upstate Biotech) in which Ras-GTP was assayed using the GST-tagged Ras-binding domain of Raf1 (Raf-RBD) as an affinity reagent.
Myelin Fractionation
The animals were euthanized and fresh brains were dissected immediately on ice, weighed, finely minced, and homogenized (1 g tissue/10 ml buffer: 0.32 M sucrose, 1 mM EDTA, 8.5 μM leupeptin, 1 μM phenylmethyl sulfonyl fluoride) with a dounce homogenizer (seven strokes each, with first a loose and then a tight pestle). Homogenates were spun in an Eppendorf 5702R centrifuge at 1,000 g for 15 min at 4°C. This total lysate was spun in a BeckmanCoulter Optima L-look ultracentrifuge at 10,000 g for 30 min at 4°C, and the supernatant from this spin was respun at 100,000 g for 1 hr at 4°C to generate cytosol. Total lysate was layered over steps of 0.32, 0.85 M, and 1.2 M sucrose, and spun in a BeckmanCoulter Optima L-look ultracentrifuge at 75,000 g for 30 min at 4°C. Myelin membranes were collected at the 0.32 M/0.85Msucrose interface with a Pasteur pipette. Plasma membrane was collected at the 0.85 M/1.2 M sucrose interface, and 30 μg of protein was loaded per lane for western blot analysis.
ROS
Unfixed optic nerves were frozen in optimal cutting temperature (OCT) medium, and 12 μmcryostat sections cut and stored at −80°C. After air drying and rinsing, we incubated sections in 4 μM DCF-DA (5-(and-6)-chloromethyl-DCF-DA, acetyl ester, Invitrogen/Molecular Probes, #C6827) for 30 min at 37°C in PBS in a 5% CO2 incubator. Some sections were incubated with NOS inhibitor L-NAME (Sigma; 100 μMin PBS) for 60 min at room temperature before incubation with DCF-DA. Slides were rinsed with PBS and coverslipped. Green fluorescence was captured on a Zeiss Axiovert 200M microscope using a 40× Plan-Neofluar objective, Hamumamatsu Orca ER camera, and ImageJ software.
Evans Blue Stain for BBB Function
Mice were given 4 ml/kg i.p. Evans blue (2% in PBS). After 24 hr, the mice were perfused with 100 ml ice-cold PBS and their brains were dissected. Tissues were fixed in 4% paraformaldehyde overnight and then placed into 20% sucrose for cryostat sectioning and imaging.
Flow Cytometry
Brains were perfused with 30 ml PBS and then dissected, roughly chopped, and incubated in 1 ml Accutase (Millipore) for 30 min at 37°C. After addition of 10% fetal bovine serum (FBS) in Hank’s balanced salt solution (2 ml), the brains were manually triturated with a transfer pipette (~20×), transferred to cell strainers (100 μm; BD), and gently processed through the filter using 3 ml syringe plungers. Cell suspensions were centrifuged (3 min × 480 g), washed with 10 ml buffer (DPBS, 2% FBS, 2 mM EDTA), and recentrifuged. To purify cells from myelin debris, cells were resuspended in 40% Percoll (Amersham) and centrifuged at 650 g for 25 min at room temperature. The myelin top layer was aspirated and mononuclear cells were resuspended in buffer. Fc receptors were blocked by incubation with anti-mouse CD16/32 (1 μg/sample; eBioscience) on ice for 10 min. After washing (2×) in buffer and incubation in primary antibodies for 1 hr at 4°C, the cells were washed (3×) in buffer and resuspended in 200 μl buffer for analysis. Flow cytometry was performed on a FACS Cantos II flow cytometer using violet (405 nm), red (633 nm), and blue (488 nm) lasers. Antibodies for oligodendrocytes (GalC 1:200; Millipore), progenitor cells (PDGFRα 1:100 and NG2 1:400; Millipore), astrocytes (GFAP 1:200; BD Biosciences), endothelial cells (ICAM-1/CD54 1:400; Biolegend), and blood/microglia (CD45 1:200; BD Biosciences) were used. DCF-DA Fitc (1:200; Invitrogen) and Cell ROX Orange (1:1,000; Invitrogen) stained for ROS. Fixable dead cell stain (1:1,000; Invitrogen) was also used.
Behavior
Behavioral assessments were completed on 3- to 4-month-old male CNP-HRas animals. Locomotor, startle, Morris water maze, and parallel bar tasks were assessed as previously described (Skelton et al., 2011; Vorhees and Williams, 2006; Kamens and Crabbe, 2007). Tremor was assessed in a San Diego Instruments SR-LAB apparatus with optional tremor detection capability for 20 min.
NAC
NAC (1 g/l = 0.001%) was made fresh every other day in water and provided in the animals’ drinking water.
Statistical Analyses
Counting was performed on 150–300 EGFP+ cells/area/animal in three to five animals/genotype. Single comparisons between littermates were done via Student’s t tests. For comparisons of groups, one-way ANOVAs followed by Tukey post hoc tests were performed using a significance cutoff of p < 0.05. Locomotor activity, Morris maze, and acoustic startle were initially analyzed by mixed linear ANOVA with factors of genotype and interval (for activity), day (for Morris maze), or trial (for acoustic startle). Follow-up comparisons for genotype differences averaged across interval, day, and trial were compared by t test for independent samples (two-tailed).
Supplementary Material
Acknowledgments
We thank Brian Popko (University of Chicago) for providing the inducible Plp-Cre-ERT mice, and Luis Parada (UTSW) for the Nf1fl/fl mice. We also thank Nathan Kalasinski for carrying out some of the mouse genotyping for this project, and Peter Pytel (University of Chicago) for performing the autopsy on the NF1 patient studied. This work was supported by grants from the DAMD Program on Neurofibromatosis (W81XWH-06-1-0114 and W81XWH-10-1-0116 to N.R.) and a Drug Discovery Initiative Award from the Children’s Tumor Foundation. D.A.M. was partially supported by grants from the NIH NRSA (T32CA117846) and the National Multiple Sclerosis Society (FG1762A1/1). D.A.M. performed all animal work and experiments, analyzed and interpreted data, identified the phenotypes and developed the mechanism, created the figures, and wrote and edited the paper. T.A.R. performed the Ras activation assay, characterized cells affected by the HRas mutation in the CNP-HRas animals, and performed the NOS stain on sections. G.C. prepared sections for electron microscopy. R.O. helped in animal behavior experiments and C.V. analyzed animal behavior. H.T.M. and J.C. performed the flow cytometry and interpreted the results. A.P.R. and S.D.M. provided the mature oligodendrocyte dissociation protocol for flow cytometry. A.O.S. analyzed stained brain and optic-nerve section histology and pathology. N.R. conceptualized the original experimental plan, aided in data analysis and interpretation, and edited the paper and figures.
Footnotes
Supplemental Information includes seven figures and can be found with this article online at http://dx.doi.org/10.1016/j.celrep.2013.08.011.
References
- Acosta MT, Bearden CE, Castellanos FX, Cutting L, Elgersma Y, Gioia G, Gutmann DH, Lee YS, Legius E, Muenke M, et al. The Learning Disabilities Network (LeaDNet): using neurofibromatosis type 1 (NF1) as a paradigm for translational research. Am J Med Genet A. 2012;158A:2225–2232. doi: 10.1002/ajmg.a.35535. [DOI] [PMC free article] [PubMed] [Google Scholar]
- Afzal F, Polak J, Buttery L. Endothelial nitric oxide synthase in the control of osteoblastic mineralizing activity and bone integrity. J Pathol. 2004;202:503–510. doi: 10.1002/path.1536. [DOI] [PubMed] [Google Scholar]
- Ahn M, Lee J, Gustafsson A, Enriquez A, Lancaster E, Sul JY, Haydon PG, Paul DL, Huang Y, Abrams CK, Scherer SS. Cx29 and Cx32, two connexins expressed by myelinating glia, do not interact and are functionally distinct. J Neurosci Res. 2008;86:992–1006. doi: 10.1002/jnr.21561. [DOI] [PMC free article] [PubMed] [Google Scholar]
- Angelow S, Ahlstrom R, Yu AS. Biology of claudins. Am J Physiol Renal Physiol. 2008;295:F867–F876. doi: 10.1152/ajprenal.90264.2008. [DOI] [PMC free article] [PubMed] [Google Scholar]
- Bennett MR, Rizvi TA, Karyala S, McKinnon RD, Ratner N. Aberrant growth and differentiation of oligodendrocyte progenitors in neurofibromatosis type 1 mutants. J Neurosci. 2003;23:7207–7217. doi: 10.1523/JNEUROSCI.23-18-07207.2003. [DOI] [PMC free article] [PubMed] [Google Scholar]
- Beutheu YS, Belmonte L, Galas L, Boukhettala N, Bôle-Feysot C, Déchelotte P, Coëffier M. Methotrexate modulates tight junctions through NF-κB, MEK, and JNK pathways. J Pediatr Gastroenterol Nutr. 2012;54:463–470. doi: 10.1097/MPG.0b013e318247240d. [DOI] [PubMed] [Google Scholar]
- Brannan CI, Perkins AS, Vogel KS, Ratner N, Nordlund ML, Reid SW, Buchberg AM, Jenkins NA, Parada LF, Copeland NG. Targeted disruption of the neurofibromatosis type-1 gene leads to developmental abnormalities in heart and various neural crest-derived tissues. Genes Dev. 1994;8:1019–1029. doi: 10.1101/gad.8.9.1019. [DOI] [PubMed] [Google Scholar]
- Chen Y, Curran CP, Nebert DW, Patel KV, Williams MT, Vorhees CV. Effect of chronic glutathione deficiency on the behavioral phenotype of Gclm−/− knockout mice. Neurotoxicol Teratol. 2012;34:450–457. doi: 10.1016/j.ntt.2012.04.009. [DOI] [PMC free article] [PubMed] [Google Scholar]
- Chow E, Mottahedeh J, Prins M, Ridder W, Nusinowitz S, Bronstein JM. Disrupted compaction of CNS myelin in an OSP/Claudin-11 and PLP/DM20 double knockout mouse. Mol Cell Neurosci. 2005;29:405–413. doi: 10.1016/j.mcn.2005.03.007. [DOI] [PubMed] [Google Scholar]
- Daston MM, Scrable H, Nordlund M, Sturbaum AK, Nissen LM, Ratner N. The protein product of the neurofibromatosis type 1 gene is expressed at highest abundance in neurons, Schwann cells, and oligodendrocytes. Neuron. 1992;8:415–428. doi: 10.1016/0896-6273(92)90270-n. [DOI] [PubMed] [Google Scholar]
- DiPaolo DP, Zimmerman RA, Rorke LB, Zackai EH, Bilaniuk LT, Yachnis AT. Neurofibromatosis type 1: pathologic substrate of high-signal-intensity foci in the brain. Radiology. 1995;195:721–724. doi: 10.1148/radiology.195.3.7754001. [DOI] [PubMed] [Google Scholar]
- Dlugosova K, Okruhlicova L, Mitasikova M, Sotnikova R, Bernatova I, Weismann P, Slezak J, Tribulova N. Modulation of connexin-43 by omega-3 fatty acids in the aorta of old spontaneously hypertensive rats. J Physiol Pharmacol. 2009;60:63–69. [PubMed] [Google Scholar]
- Doerflinger NH, Macklin WB, Popko B. Inducible site-specific recombination in myelinating cells. Genesis. 2003;35:63–72. doi: 10.1002/gene.10154. [DOI] [PubMed] [Google Scholar]
- Dumont M, Stack C, Elipenahli C, Jainuddin S, Gerges M, Starkova NN, Yang L, Starkov AA, Beal F. Behavioral deficit, oxidative stress, and mitochondrial dysfunction precede tau pathology in P301S transgenic mice. FASEB J. 2011;25:4063–4072. doi: 10.1096/fj.11-186650. [DOI] [PMC free article] [PubMed] [Google Scholar]
- Ferro E, Goitre L, Retta SF, Trabalzini L. The interplay between ROS and Ras GTPases: physiological and pathological implications. J Signal Transduct. 2012;2012:365769. doi: 10.1155/2012/365769. [DOI] [PMC free article] [PubMed] [Google Scholar]
- Gandhi GK, Ball KK, Cruz NF, Dienel GA. Hyperglycaemia and diabetes impair gap junctional communication among astrocytes. ASN Neuro. 2010;2:e00030. doi: 10.1042/AN20090048. [DOI] [PMC free article] [PubMed] [Google Scholar]
- Gysin S, Salt M, Young A, McCormick F. Therapeutic strategies for targeting ras proteins. Genes Cancer. 2011;2:359–372. doi: 10.1177/1947601911412376. [DOI] [PMC free article] [PubMed] [Google Scholar]
- Hegedus B, Dasgupta B, Shin JE, Emnett RJ, Hart-Mahon EK, Elghazi L, Bernal-Mizrachi E, Gutmann DH. Neurofibromatosis-1 regulates neuronal and glial cell differentiation from neuroglial progenitors in vivo by both cAMP- and Ras-dependent mechanisms. Cell Stem Cell. 2007;1:443–457. doi: 10.1016/j.stem.2007.07.008. [DOI] [PubMed] [Google Scholar]
- Heimfarth L, Loureiro SO, Pierozan P, de Lima BO, Reis KP, Torres EB, Pessoa-Pureur R. Methylglyoxal-induced cytotoxicity in neonatal rat brain: a role for oxidative stress and MAP kinases. Metab Brain Dis. 2013;28:429–438. doi: 10.1007/s11011-013-9379-1. [DOI] [PubMed] [Google Scholar]
- Hyman SL, Gill DS, Shores EA, Steinberg A, North KN. T2 hyperintensities in children with neurofibromatosis type 1 and their relationship to cognitive functioning. J Neurol Neurosurg Psychiatry. 2007;78:1088–1091. doi: 10.1136/jnnp.2006.108134. [DOI] [PMC free article] [PubMed] [Google Scholar]
- Kamens HM, Crabbe JC. The parallel rod floor test: a measure of ataxia in mice. Nat Protoc. 2007;2:277–281. doi: 10.1038/nprot.2007.19. [DOI] [PubMed] [Google Scholar]
- Karlsgodt KH, Rosser T, Lutkenhoff ES, Cannon TD, Silva A, Bearden CE. Alterations in white matter microstructure in neurofibromatosis-1. PLoS ONE. 2012;7:e47854. doi: 10.1371/journal.pone.0047854. [DOI] [PMC free article] [PubMed] [Google Scholar]
- Kim KY, Ju WK, Hegedus B, Gutmann DH, Ellisman MH. Ultrastructural characterization of the optic pathway in a mouse model of neurofibromatosis-1 optic glioma. Neuroscience. 2010;170:178–188. doi: 10.1016/j.neuroscience.2010.06.017. [DOI] [PMC free article] [PubMed] [Google Scholar]
- Komatsu T, Ireland DD, Chung N, Doré A, Yoder M, Reiss CS. Regulation of the BBB during viral encephalitis: roles of IL-12 and NOS. Nitric Oxide. 1999;3:327–339. doi: 10.1006/niox.1999.0237. [DOI] [PubMed] [Google Scholar]
- Lee KM, Kwon JY, Lee KW, Lee HJ. Ascorbic acid 6-palmitate suppresses gap-junctional intercellular communication through phosphorylation of connexin 43 via activation of the MEK-ERK pathway. Mutat Res. 2009;660:51–56. doi: 10.1016/j.mrfmmm.2008.10.012. [DOI] [PubMed] [Google Scholar]
- Li W, Cui Y, Kushner SA, Brown RA, Jentsch JD, Frankland PW, Cannon TD, Silva AJ. The HMG-CoA reductase inhibitor lovastatin reverses the learning and attention deficits in a mouse model of neurofibromatosis type 1. Curr Biol. 2005;15:1961–1967. doi: 10.1016/j.cub.2005.09.043. [DOI] [PubMed] [Google Scholar]
- Li X, Newbern JM, Wu Y, Morgan-Smith M, Zhong J, Charron J, Snider WD. MEK is a key regulator of gliogenesis in the developing brain. Neuron. 2012;75:1035–1050. doi: 10.1016/j.neuron.2012.08.031. [DOI] [PMC free article] [PubMed] [Google Scholar]
- Magnotti LM, Goodenough DA, Paul DL. Deletion of oligodendrocyte Cx32 and astrocyte Cx43 causes white matter vacuolation, astrocyte loss and early mortality. Glia. 2011;59:1064–1074. doi: 10.1002/glia.21179. [DOI] [PMC free article] [PubMed] [Google Scholar]
- Mayes DA, Rizvi TA, Cancelas JA, Kolasinski NT, Ciraolo GM, Stemmer-Rachamimov AO, Ratner N. Perinatal or adult Nf1 inactivation using tamoxifen-inducible PlpCre each cause neurofibroma formation. Cancer Res. 2011;71:4675–4685. doi: 10.1158/0008-5472.CAN-10-4558. [DOI] [PMC free article] [PubMed] [Google Scholar]
- Patel AV, Eaves D, Jessen WJ, Rizvi TA, Ecsedy JA, Qian MG, Aronow BJ, Perentesis JP, Serra E, Cripe TP, et al. Ras-driven transcriptome analysis identifies aurora kinase A as a potential malignant peripheral nerve sheath tumor therapeutic target. Clin Cancer Res. 2012;18:5020–5030. doi: 10.1158/1078-0432.CCR-12-1072. [DOI] [PMC free article] [PubMed] [Google Scholar]
- Perilongo G, Opocher E, Viscardi E. Optic, hypothalamic, and thalamic tumors. Handb Clin Neurol. 2012;105:607–613. doi: 10.1016/B978-0-444-53502-3.00011-2. [DOI] [PubMed] [Google Scholar]
- Pride N, Payne JM, Webster R, Shores EA, Rae C, North KN. Corpus callosum morphology and its relationship to cognitive function in neurofibromatosis type 1. J Child Neurol. 2010;25:834–841. doi: 10.1177/0883073809350723. [DOI] [PubMed] [Google Scholar]
- Pummi KP, Aho HJ, Laato MK, Peltonen JT, Peltonen SA. Tight junction proteins and perineurial cells in neurofibromas. J Histochem Cytochem. 2006;54:53–61. doi: 10.1369/jhc.5A6671.2005. [DOI] [PubMed] [Google Scholar]
- Radosinska J, Bacova B, Bernatova I, Navarova J, Zhukovska A, Shysh A, Okruhlicova L, Tribulova N. Myocardial NOS activity and connexin-43 expression in untreated and omega-3 fatty acids-treated spontaneously hypertensive and hereditary hypertriglyceridemic rats. Mol Cell Biochem. 2011;347:163–173. doi: 10.1007/s11010-010-0625-0. [DOI] [PubMed] [Google Scholar]
- Robertson CA, Green BG, Niedzwiecki L, Harrison RK, Grant SK. Effect of nitric oxide synthase substrate analog inhibitors on rat liver arginase. Biochem Biophys Res Commun. 1993;197:523–528. doi: 10.1006/bbrc.1993.2510. [DOI] [PubMed] [Google Scholar]
- Saura M, Tarin C, Zaragoza C. Recent insights into the implication of nitric oxide in osteoblast differentiation and proliferation during bone development. ScientificWorldJournal. 2010;10:624–632. doi: 10.1100/tsw.2010.58. [DOI] [PMC free article] [PubMed] [Google Scholar]
- Segretain D, Falk MM. Regulation of connexin biosynthesis, assembly, gap junction formation, and removal. Biochim Biophys Acta. 2004;1662:3–21. doi: 10.1016/j.bbamem.2004.01.007. [DOI] [PubMed] [Google Scholar]
- Selek S, Bulut M, Ocak AR, Kalenderoğlu A, Savaş HA. Evaluation of total oxidative status in adult attention deficit hyperactivity disorder and its diagnostic implications. J Psychiatr Res. 2012;46:451–455. doi: 10.1016/j.jpsychires.2011.12.007. [DOI] [PubMed] [Google Scholar]
- Skelton MR, Schaefer TL, Graham DL, Degrauw TJ, Clark JF, Williams MT, Vorhees CV. Creatine transporter (CrT; Slc6a8) knockout mice as a model of human CrT deficiency. PLoS ONE. 2011;6:e16187. doi: 10.1371/journal.pone.0016187. [DOI] [PMC free article] [PubMed] [Google Scholar]
- Simard M, Arcuino G, Takano T, Liu QS, Nedergaard M. Signaling at the gliovascular interface. J Neurosci. 2003;23:9254–9262. doi: 10.1523/JNEUROSCI.23-27-09254.2003. [DOI] [PMC free article] [PubMed] [Google Scholar]
- Solga AC, Gianino SM, Gutmann DH. NG2-cells are not the cell of origin for murine neurofibromatosis-1 (Nf1) optic glioma. Oncogene. 2013 doi: 10.1038/onc.2012.580. Published online January 14, 2013 http://dx.doi.org/10.1038/onc.2012.580. [DOI] [PMC free article] [PubMed]
- Taniguchi Ishikawa E, Gonzalez-Nieto D, Ghiaur G, Dunn SK, Ficker AM, Murali B, Madhu M, Gutstein DE, Fishman GI, Barrio LC, Cancelas JA. Connexin-43 prevents hematopoietic stem cell senescence through transfer of reactive oxygen species to bone marrow stromal cells. Proc Natl Acad Sci USA. 2012;109:9071–9076. doi: 10.1073/pnas.1120358109. [DOI] [PMC free article] [PubMed] [Google Scholar]
- Tiboni GM, Giampietro F, Di Giulio C. The nitric oxide synthesis inhibitor Nomega-nitro-L-arginine methyl ester (L-NAME) causes limb defects in mouse fetuses: protective effect of acute hyperoxia. Pediatr Res. 2003;54:69–76. doi: 10.1203/01.PDR.0000069840.78984.76. [DOI] [PubMed] [Google Scholar]
- Tidyman WE, Rauen KA. Noonan, Costello and cardio-faciocutaneous syndromes: dysregulation of the Ras-MAPK pathway. Expert Rev Mol Med. 2008;10:e37. doi: 10.1017/S1462399408000902. [DOI] [PubMed] [Google Scholar]
- Tong JJ, Schriner SE, McCleary D, Day BJ, Wallace DC. Life extension through neurofibromin mitochondrial regulation and antioxidant therapy for neurofibromatosis-1 in Drosophila melanogaster. Nat Genet. 2007;39:476–485. doi: 10.1038/ng2004. [DOI] [PubMed] [Google Scholar]
- van Engelen SJ, Krab LC, Moll HA, de Goede-Bolder A, Pluijm SM, Catsman-Berrevoets CE, Elgersma Y, Lequin MH. Quantitative differentiation between healthy and disordered brain matter in patients with neurofibromatosis type I using diffusion tensor imaging. AJNR Am J Neuroradiol. 2008;29:816–822. doi: 10.3174/ajnr.A0921. [DOI] [PMC free article] [PubMed] [Google Scholar]
- Vega Rasgado LA, Ceballos Reyes GM, Vega-Diaz MF. Anticonvulsant drugs, oxidative stress and nitric oxide. Proc West Pharmacol Soc. 2011;54:41–48. [PubMed] [Google Scholar]
- Viosca J, Schuhmacher AJ, Guerra C, Barco A. Germline expression of H-Ras(G12V) causes neurological deficits associated to Costello syndrome. Genes Brain Behav. 2009;8:60–71. doi: 10.1111/j.1601-183X.2008.00443.x. [DOI] [PubMed] [Google Scholar]
- Vorhees CV, Williams MT. Morris water maze: procedures for assessing spatial and related forms of learning and memory. Nat Protoc. 2006;1:848–858. doi: 10.1038/nprot.2006.116. [DOI] [PMC free article] [PubMed] [Google Scholar]
- Wang Y, Kim E, Wang X, Novitch BG, Yoshikawa K, Chang LS, Zhu Y. ERK inhibition rescues defects in fate specification of Nf1-deficient neural progenitors and brain abnormalities. Cell. 2012;150:816–830. doi: 10.1016/j.cell.2012.06.034. [DOI] [PMC free article] [PubMed] [Google Scholar]
- Williams VC, Lucas J, Babcock MA, Gutmann DH, Korf B, Maria BL. Neurofibromatosis type 1 revisited. Pediatrics. 2009;123:124–133. doi: 10.1542/peds.2007-3204. [DOI] [PubMed] [Google Scholar]
- Wolburg H, Lippoldt A. Tight junctions of the blood-brain barrier: development, composition and regulation. Vascul Pharmacol. 2002;38:323–337. doi: 10.1016/s1537-1891(02)00200-8. [DOI] [PubMed] [Google Scholar]
- Zatorre RJ, Fields RD, Johansen-Berg H. Plasticity in gray and white: neuroimaging changes in brain structure during learning. Nat Neurosci. 2012;15:528–536. doi: 10.1038/nn.3045. [DOI] [PMC free article] [PubMed] [Google Scholar]
- Zeger M, Popken G, Zhang J, Xuan S, Lu QR, Schwab MH, Nave KA, Rowitch D, D’Ercole AJ, Ye P. Insulin-like growth factor type 1 receptor signaling in the cells of oligodendrocyte lineage is required for normal in vivo oligodendrocyte development and myelination. Glia. 2007;55:400–411. doi: 10.1002/glia.20469. [DOI] [PMC free article] [PubMed] [Google Scholar]
- Zhang JH, Kawashima S, Yokoyama M, Huang P, Hill CE. Increased eNOS accounts for changes in connexin expression in renal arterioles during diabetes. Anat Rec A Discov Mol Cell Evol Biol. 2006;288:1000–1008. doi: 10.1002/ar.a.20369. [DOI] [PubMed] [Google Scholar]
Associated Data
This section collects any data citations, data availability statements, or supplementary materials included in this article.