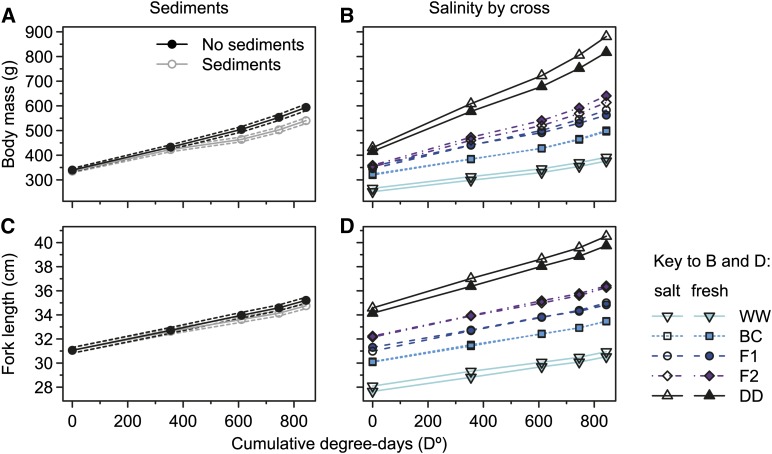
Figure 4.
Effects of environments on growth trajectories for body mass and fork length. Marginal predictions for growth trajectories of retransformed body mass (A) and fork length (C) are shown in the absence and presence of a daily pulse of suspended sediments, differentiated by line color as indicated in the key of A. Dashed lines represent ∼95% confidence intervals. Predicted average growth for each of the five crosses is shown for retransformed body mass (B) and fork length (D) in fresh water and salt water, differentiated by symbols and line colors and types as indicated in the key. All cross abbreviations are as in Figure 1.

