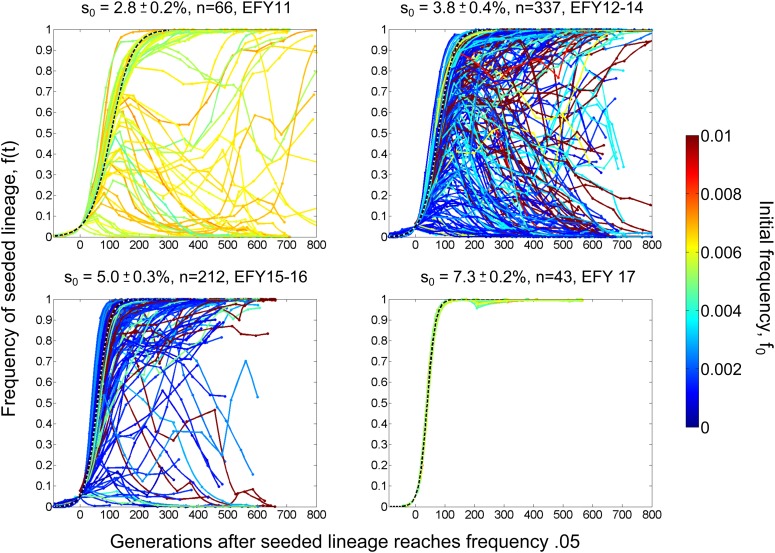
Figure 1.
Trajectories of seeded lineages. Each line represents the frequency over time of a marked lineage with fitness advantage s0 seeded into a replicate resident population. Colors correspond to the initial frequency f0 of the seeded lineage according to the legend at right. Time is measured in generations, with t = 0 defined as the time at which each trajectory reached frequency 0.05. The dashed curves show the expected trajectories in the absence of new beneficial mutations (i.e., without clonal interference). (Note that the seeded lineages for s0 ≈ 4 and 5% consisted of multiple strains; see Materials and Methods.)

