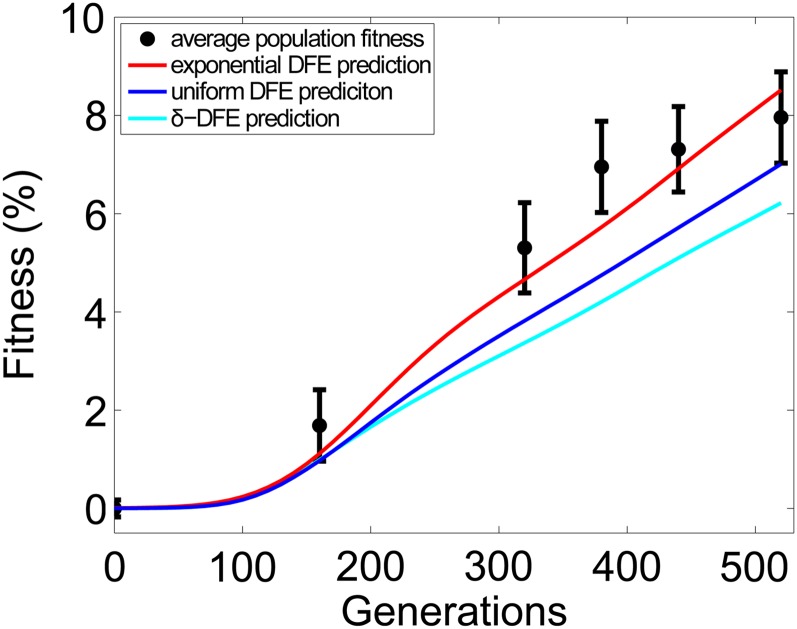
Figure 6.
The rate of adaptation. The average fitness over time of 16 experimental control populations (± 1 SEM) is shown in black. Solid curves are the predictions of these data given the most-likely exponential, uniform, and δ-function DFEs. The fitnesses of individual populations are shown in Figure S4.

