A terahertz measurement setup precisely monitors changes in the water status of multiple plants in experiments under controlled environmental conditions.
Abstract
We present a novel measurement setup for monitoring changes in leaf water status using nondestructive terahertz time-domain spectroscopy (THz-TDS). Previous studies on a variety of plants showed the principal applicability of THz-TDS. In such setups, decreasing leaf water content directly correlates with increasing THz transmission. Our new system allows for continuous, nondestructive monitoring of the water status of multiple individual plants each at the same constant leaf position. It overcomes previous drawbacks, which were mainly due to the necessity of relocating the plants. Using needles of silver fir (Abies alba) seedlings as test subjects, we show that the transmission varies along the main axis of a single needle due to a variation in thickness. Therefore, the relocation of plants during the measuring period, which was necessary in the previous THz-TDS setups, should be avoided. Furthermore, we show a highly significant correlation between gravimetric water content and respective THz transmission. By monitoring the relative change in transmission, we were able to narrow down the permanent wilting point of the seedlings. Thus, we established groups of plants with well-defined levels of water stress that could not be detected visually. This opens up the possibility for a broad range of genetic and physiological experiments.
Climate change simulations predict an increase in the occurrence of drought events in the Mediterranean area and in central Europe due to smaller amounts of precipitation, especially during summer periods (IPCC, 2007). With the exception of the boreal zone, this leads to an increase in drought risks for every region on the European continent (Iglesias et al., 2007). Water availability is very important for a variety of plant species. Trees and crops play major roles regarding ecosystem stability and food supply. Forest trees are keystone elements in shaping long-term, regional ecosystem composition and stability and are, like most forest species, highly vulnerable to increases in drought severity (Breshears et al., 2005; Choat et al., 2012). Drought-induced forest die-offs thereby directly reduce ecosystem services such as carbon sequestration and timber supply (Allen et al., 2010). Further research is clearly necessary to elucidate the physiological traits and responses of plants regarding their water status.
European silver fir (Abies alba) is an important forest tree species of ecological and economic relevance. This study is embedded in the European project LinkTree, “linking genetic variability with ecological responses to environmental changes: forest trees as model systems.” Our group is concerned with the identification of genes involved in the water stress response of silver fir. This species is of special interest because of its lower water-use efficiency compared with other conifer species (Guehl and Aussenac, 1987; Guehl et al., 1991).
For this purpose, monitoring plant water status without inducing other forms of stress is instrumental in order to apply well-defined levels of water stress. Obtaining information regarding the water status of a plant is highly problematic without using invasive and destructive methods that usually only allow a retrospective assessment. These include commonly established methods, such as the gravimetric water content and pressure chamber techniques, most notably Scholander’s pressure bomb (Scholander et al., 1965).
Chlorophyll fluorescence, stomatal conductance, and visual assessment are examples of nondestructive and noninvasive measurement techniques. The former two only provide indirect information about the plant stress status and, therefore, the water content via photosynthetic activity (Lichtenthaler and Rinderle, 1988; Tardieu and Davies, 1993). The latter is difficult to standardize and highly dependent on the morphology of the studied plant species. Conifers especially are challenging subjects for visually assessing drought stress. Due to their needle morphology, it is nearly impossible to detect early signs of dehydration.
Measurement techniques using electromagnetic radiation in the terahertz (THz) regime have shown promising results, due to the nondestructive nature and high sensitivity of THz waves to water. With THz waves, we refer to frequencies in the electromagnetic spectrum between 0.1 and 1 THz, corresponding to wavelengths between 3 and 0.3 mm, which are located between infrared light (thermal radiation) and microwave radiation (used in common wireless data communication systems). In the last decade, terahertz time-domain spectroscopy (THz-TDS) has proven to be a very strong and accurate tool for characterizing and imaging various materials (for review, see Jepsen et al., 2011). Crucial for our study is the remarkably high absorption coefficient of water in this part of the electromagnetic spectrum. Thus, it is a robust technique hardly affected by physiological concentrations of soluble substances. Using transmission geometry, the resulting absorption by plant tissues directly reflects the quantity of water molecules.
Furthermore, THz-TDS does not suffer from the disadvantages of other radiation-based techniques. These are mainly focused on the infrared or microwave spectrum but either lack the sensitivity for small changes in leaf water status or are affected by the plant’s inorganic salt content, leading to significant disturbances (Ulaby and Jedlicka, 1984). Moreover, the applicability of emitting microwave radiation is limited to minimal wavelengths of approximately 2.5 mm. The Abbe diffraction limit, therefore, restricts the minimum diameter of a measurable object to approximately 1.25 mm. In order to measure small leaves, such as coniferous needles, electromagnetic radiation with shorter wavelengths is necessary.
Although presenting a useful alternative, THz-TDS was not feasible until recently, due to the difficulty of generating and detecting electromagnetic radiation with wavelengths in the THz spectrum. Despite its promising applicability in plant sciences, until now this relatively novel method relied exclusively on measurement setups that allowed only a single measurement per alternating plant (Hadjiloucas et al., 1999; Jördens et al., 2009; Breitenstein et al., 2012; Castro-Camus et al., 2013; Gente et al., 2013). For the purpose of continuously monitoring multiple plants, these setups are only of limited use, since the plants must be relocated for every measurement. This results in two problems: (1) an increase in possible disturbances (e.g. mechanical), influencing the plant’s stress response, and (2) the necessity to precisely target the same measurement spot on every analyzed plant at every consecutive measurement. The latter is of crucial importance for the exact monitoring of any individual plant’s water status because, as we will show in this study, the transmission varies substantially across the area of plant leaf tissue.
We present a novel measurement procedure that overcomes the drawbacks of previously proposed methods. Our approach enables us to precisely monitor changes in the water content of multiple plants simultaneously.
In the course of this study, three different experiments were performed. The profile measurement and the rehydration experiment were preliminary investigations to examine the influences of needle and tissue thickness and to define a nonlethal stress level. The main experiment established groups of plants with comparable levels of water stress.
RESULTS
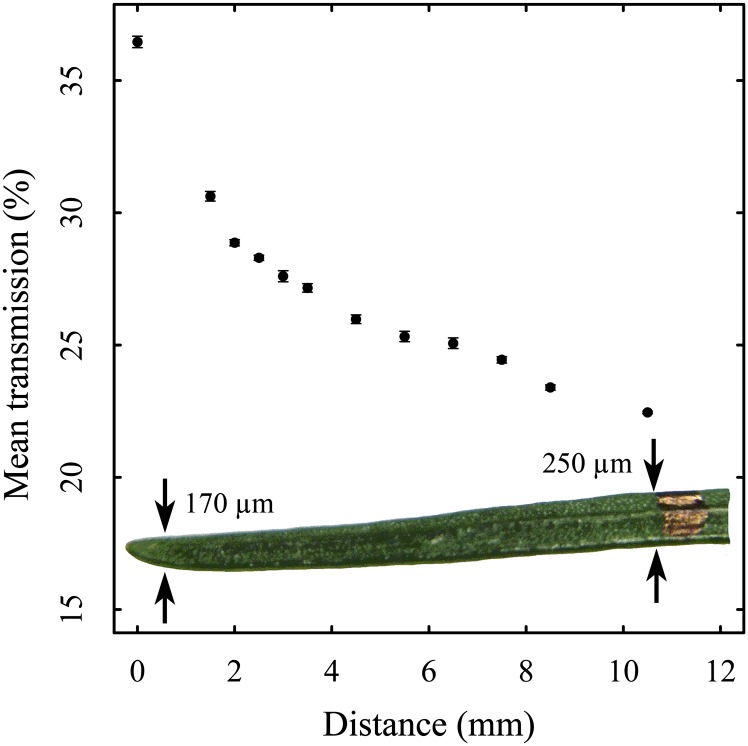
The THz transmission is a measure for the proportion of radiation reaching the detector. Without any absorbing or reflecting materials, the transmission is defined as 100%. When monitoring plant leaves, the measured transmission is always a result of the volume of water at the measurement spot. A lower transmission, therefore, might be due to higher water content and/or leaf thickness. Accordingly, every individual needle produces an individual transmission baseline, which does not precisely translate into specific water content. Increase or decrease of transmission (ΔT), instead, is comparable and directly attributable to changes in the water content. The profile measurements of the needle showed a general decrease in transmission along its main axis (Fig. 1). Correspondingly, the highest transmission of 36% was measured at the tip and the lowest transmission of 22% was measured near the base of the needle. The transmission correlated with the difference in needle thickness of the tip and base, 170 and 250 µm, respectively. The repeated measurements of every position along the needle showed highly reproducible values, leading to very low sd values ranging at maximum up to 4% for five consecutive measurements.
Figure 1.
Transmission profile of a silver fir needle along the main axis, with the thickness of the needle at the outermost points of the profile. Each point represents the mean over five measurements. The sd is given for every point but sometimes is smaller than the pixel of the point (Supplemental Table S1). [See online article for color version of this figure.]
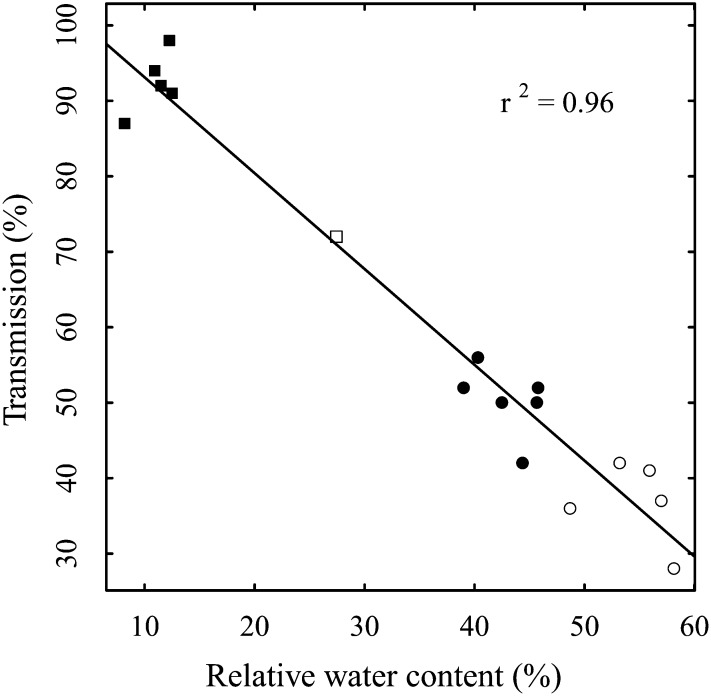
At the time of harvesting, a statistically significant negative correlation between transmission and relative water content for all measured seedlings was evident (r = −0.98, P < 0.001; Fig. 2).
Figure 2.
Correlation between THz transmission and gravimetric water content of the respective irrigated (white circles; I1–I5), stressed (black circles; S1–S6), relatively desiccated (white square; S7), and completely desiccated (black squares; D1–D5) seedlings, with the linear regression line and the corresponding coefficient of determination (r2).
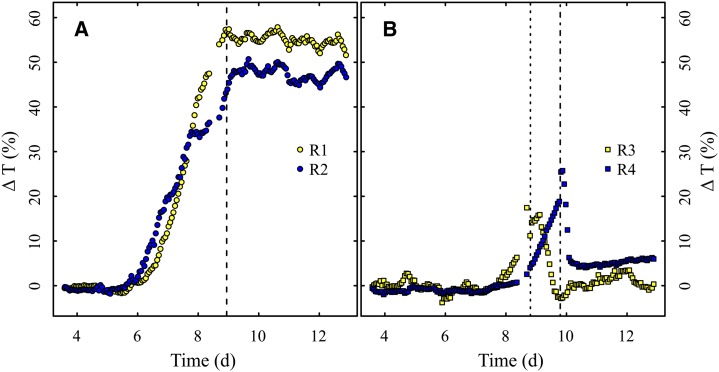
In the rehydration experiment, irrigation after drought treatment was conducted for seedlings R1 and R2 after reaching a ΔT of 58% and 43%, respectively (Fig. 3A). Correspondingly, R3 and R4 were irrigated after reaching a ΔT of 11% and 19%, respectively (Fig. 3B). Thus, the permanent wilting point (PWP) of the seedlings was narrowed down to a ΔT between 19% and 43% at 1.5 to 3 d after the onset of increased transmission. While R1 and R2 did not show any signs of recovery from drought and instead remained on high transmission levels, transmission in R3 and R4 dropped quickly after rehydration to levels close to the initial baselines.
Figure 3.
Monitoring ΔT over time to narrow down the PWP. A, Seedlings R1 and R2 irreversibly passed the PWP (the dashed line shows the beginning of regular irrigation). B, Seedlings R3 and R4 recovered from drought treatment after irrigation (the dotted and dotted-dashed lines show the time of needle extraction and the beginning of regular irrigation, respectively). [See online article for color version of this figure.]
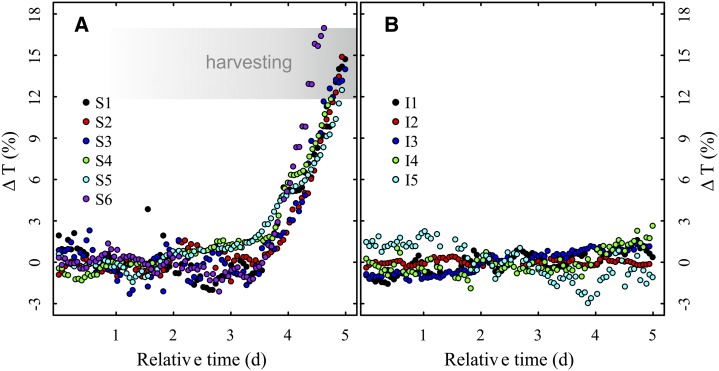
The stressed group of seedlings in the main experiment showed an increase in transmission similar to each other, while the irrigated control seedlings remained at relatively constant levels (Fig. 4; for further information regarding the overall drought period, see Supplemental Table S2). Transmission at harvesting varied from 42% to 56% within the stressed group. ΔT, however, only showed a slight variation of 5% (Table I). Seedling S7 showed a relatively high ΔT of 24% and, accordingly, a very low gravimetric water content of 27.44%. Normalization of the data revealed that the respective pinhole was not properly adjusted, leading to a reflection of THz radiation. Hence, seedling S7 was too desiccated and, therefore, was removed from the stressed group as an artifact.
Figure 4.
ΔT over a relative time for the six water-stressed seedlings S1 to S6 (A) and the five irrigated control seedlings I1 to I5 (B). The transmission curves of the stressed seedlings were aligned at their respective baselines, and the range of ΔT at harvesting is shown. While the stressed seedlings show a relatively uniform increase in transmission and therefore a decrease in water content, the irrigated seedlings remain at a relatively constant level of transmission and therefore show no signs of dehydration. [See online article for color version of this figure.]
Table I. Fresh weight, dry weight, relative water content, and transmission at harvesting for each seedling with its respective plant and treatment group.
For each stressed seedling, the difference in transmission between the respective baseline and the point of harvesting (ΔT) is given. –, ΔT was not calculated for the irrigated and desiccated seedlings.
| Plant | Treatment | Fresh Weight | Dry Weight | Relative Water Content | Transmission at Harvesting | ΔT |
|---|---|---|---|---|---|---|
| mg | % | |||||
| S1 | Stressed | 117.0 | 67.3 | 42.48 | 50 | 15 |
| S2 | Stressed | 102.7 | 61.3 | 40.31 | 56 | 15 |
| S3 | Stressed | 129.0 | 70.1 | 45.66 | 50 | 14 |
| S4 | Stressed | 171.8 | 104.8 | 39.00 | 52 | 12 |
| S5 | Stressed | 140.7 | 76.3 | 45.77 | 52 | 13 |
| S6 | Stressed | 126.0 | 70.1 | 44.37 | 42 | 17 |
| S7 | Stresseda | 102.4 | 74.3 | 27.44 | 72 | 24 |
| I1 | Irrigated | 261.6 | 122.4 | 53.21 | 42 | – |
| I2 | Irrigated | 287.1 | 147.3 | 48.69 | 36 | – |
| I3 | Irrigated | 243.3 | 107.3 | 55.90 | 41 | – |
| I4 | Irrigated | 141.9 | 59.4 | 58.14 | 28 | – |
| I5 | Irrigated | 142.0 | 61.1 | 56.97 | 37 | – |
| D1 | Desiccated | 54.4 | 47.6 | 12.50 | 91 | – |
| D2 | Desiccated | 81.8 | 72.4 | 11.49 | 92 | – |
| D3 | Desiccated | 60.5 | 53.9 | 10.91 | 94 | – |
| D4 | Desiccated | 66.0 | 60.6 | 8.18 | 87 | – |
| D5 | Desiccated | 25.3 | 61.1 | 12.25 | 98 | – |
Seedling S7 was considered desiccated.
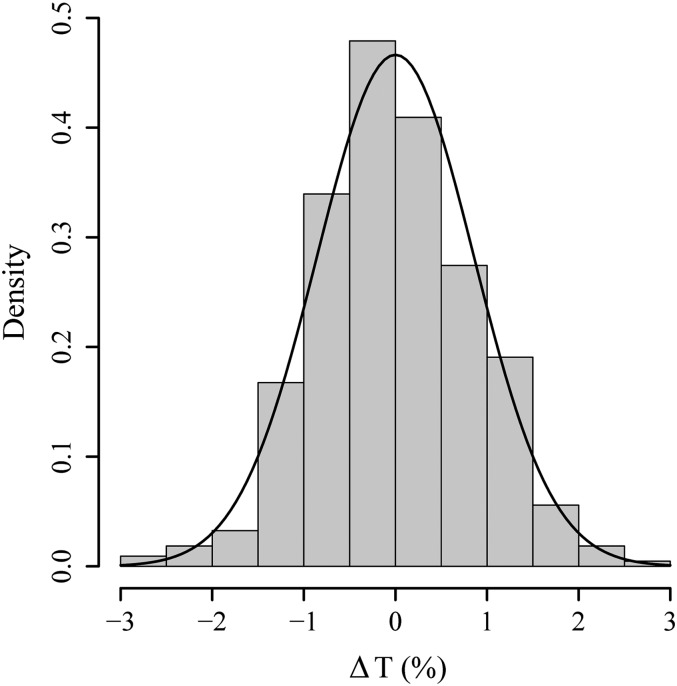
The transmission of all irrigated control seedlings exhibited a very low sd of 0.86%. The accuracy of the control measurements is illustrated by the shape of the probability-density function (Fig. 5). The differences in relative water content were highly significant between the stressed group and the irrigated control group (Student's t test, P < 0.001).
Figure 5.
Histogram of ΔT for all irrigated control seedlings I1 to I5 with the corresponding probability-density function. The course of transmission for each seedling was set to a mean of 0% prior to the analysis.
Room temperature fluctuated regularly during the whole measurement period around 20.3°C, with maximum values up to 21.4°C during the day and minimum values down to 19.6°C at night. Relative humidity showed strong fluctuations ranging from 44.8% to 16.8%, not following any recognizable pattern. Both temperature and relative humidity did not correlate with the fluctuations in transmission (Supplemental Figs. S1–S3). Illumination intensity during the day was 3,500 lux on average.
DISCUSSION
In this paper, we introduce a newly developed THz-TDS setup that was thoroughly validated. The main goal of our study was to provide a sensitive tool for monitoring the reaction of plants in an in vivo drought stress experiment by using ΔT. Before discussing the main results, we address the outcome of the preliminary validation steps. These were performed to demonstrate the accuracy of the experiment and to identify factors that influenced the measurements.
To better understand the results, we emphasize the fact that THz transmission is expected to be influenced not only by the water content but also by the measurement spot (Mittleman et al., 1996). We demonstrated this by moving the measurement spot along the axis of a needle (Fig. 1). Thus, the variation of transmission along the axis can be attributed mainly to leaf thickness/composition. Using broad-leafed specimens, we observed similar variation when moving the measurement spot across the surface of a leaf (data not shown). Therefore, repeated measurements of plants at different spots introduce a variation in transmission even without a change in water content. We could demonstrate, however, that repeated measurements at the same spot are highly accurate and reproducible (see error bars in Fig. 1).
In the next step, we observed a high correlation between transmission and water content and, thus, a high sensitivity of THz radiation to the water content (Fig. 2). This correlation could be used for establishing a species- and setup-specific standard curve as a proxy for water content. The remaining variation, however, indicates that the use of absolute values is not straightforward for studying the response of plants in such an experiment, at least without knowledge of the exact thickness or composition.
This is exactly where our system was meant to provide a solution. As we discuss below, the continuous monitoring of the drought stress response clearly overcomes previous shortcomings. In advance of the main experiment, we performed a rehydration experiment, which already confirmed the advantages of our setup but still served as a preliminary step for the main experiment. To be more specific, we were interested in determining the point at which drought stress affects the plants but is not yet lethal. Thus, a rough estimation of the PWP was sufficient in this case (Fig. 3). With the appropriate experimental design, our THz-TDS setup will allow for a much more precise determination of a species’ or ecotype’s specific PWP. Exact knowledge about the ΔT threshold, at which the PWP is reached, could provide valuable phenotypic information about a plant.
In addition, the rehydration experiment again provided evidence for variation introduced by moving the measurement spot. Prior to the irrigation, one needle was harvested from seedling R3 and one from R4, leading to an unavoidable shift in the position of the measured needle over the pinhole. Therefore, directly after remounting the needles, the transmission shifted for both samples, which corresponded precisely with the elevation of the baseline after recovery. From this evidence, we conclude that, in order to successfully monitor changes in plant water status, repeated measurements have to be performed at the exact same spot. Our novel measurement setup provides this basic ability.
In the main experiment, we observed that the stressed group of seedlings reacted in a similar way by losing water at similar rates after the onset of dehydration (Fig. 4A). This could be expected from seedlings originating from the same mother tree. Further experiments with seedlings from different genetic and geographic backgrounds are necessary to provide an assessment of the variation of the stress response within silver fir. The irrigated control group showed only slight variation (Figs. 4B and 5), demonstrating that our measurements were not significantly influenced by sources other than irrigation. This was confirmed by the recorded data for temperature and humidity, which showed no signs of correlation with the transmission of any individual seedling.
For our purpose of defining plants with nearly identical levels of water stress, the presented setup was fully sufficient. As a novelty, it enabled us to apply a level of stress that was traceable in the seedling’s physiological response (i.e. water content) but not in its visual appearance (i.e. wilting).
Both the rehydration and the main experiment revealed that, instead of using absolute measures of transmission, continuously monitoring plants provides the key information, ΔT. Since this value is corrected for by the individual transmission prior to dehydration, it is possible to compare all plants in the experiment independently of tissue thickness and composition. This is applicable to both broad-leafed and coniferous plants.
Although our novel setup provides precise continuous measurements at the same spot, growing plant tissue might introduce additional variation. While this was not relevant in our specific case, this should be considered when adapting the system to fast-growing plant species.
Previous studies using THz-TDS showed that the method works in principle and is applicable to different plant taxa. Yet, these setups are limited in experimental design (Jördens et al., 2009; Castro-Camus et al., 2013). Here, we present a setup suitable for a broad range of applications in ecophysiology and genetics. This is mainly due to three features: (1) high accuracy and reproducibility of the measurements, (2) multiple samples studied in parallel, with the ability for legitimate comparison between test subjects, and (3) the possibility to manipulate selected environmental conditions while reducing handling stress to a minimum.
PERSPECTIVE
In this study, we established an accurate tool for measuring effects directly related to water deficiency. This opens up the possibility for a broad range of experiments studying cause-effect relationships. By monitoring the reaction of an array of plants to defined levels of stress, groups exhibiting similar responses can be identified and selected for in-depth study of the underlying causes. Beyond the focus of our exemplary study, our ΔT approach allows the comparison of genotypes or accessions regarding their specific stress response. This response can be further characterized in terms of delay time until the onset of the stress reaction as well as the intensity of the response, which is defined by the variation of transmission over time (ΔT/∆t).
MATERIALS AND METHODS
Plant Material
Silver fir (Abies alba) seeds were collected from the female cones of a single seed tree in a forest stand near Hagenbach, in the Black Forest region of southwestern Germany.
The seeds were cleaned, soaked in cold water for 24 h, and put into germination trays. For the stratification process, the germination trays were stored in a cooling chamber at 5°C for 6 weeks. Afterward, they were relocated to a thermal chamber that was adjusted to 28°C and moved to a greenhouse after 1 week. The germinated seedlings were individually planted into identical pots containing peat soil and kept in a greenhouse for 6 months. The positions of the single pots in the greenhouse were randomized to avoid the effects of a heterogenous environment and were irrigated three times per week. In preparation for the THz measurements, the seedlings were repotted into smaller clay pots containing slightly sandy topsoil 2 months prior to the experiments.
In the first step, we used one seedling to measure a needle profile to demonstrate the influence of varying the measurement spot. Subsequently, four seedlings (R1–R4) were chosen for a rehydration experiment. The aim was to determine the PWP. Another 12 seedlings were chosen for the main water stress experiment. The seedlings were assigned to two groups, one water-stressed group of seven seedlings, labeled S1 to S7, and one irrigated control group of five seedlings, labeled I1 to I5. Additionally, five completely desiccated seedlings (D1–D5) were chosen to be included in a correlation analysis.
THz-TDS Setup
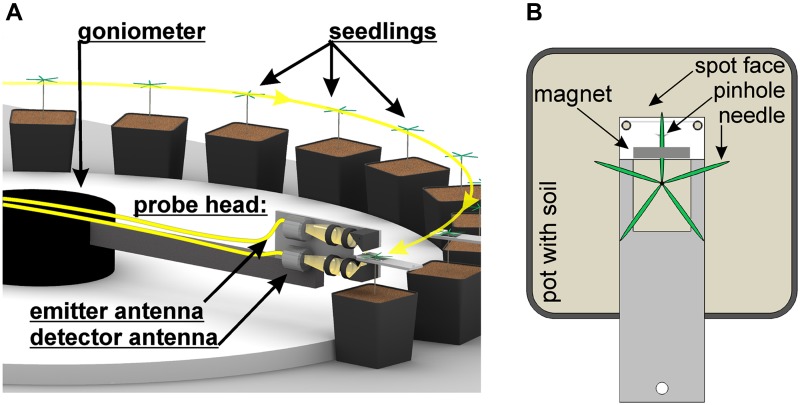
The setup consisted of an erbium fiber laser (C-Fiber; Menlo Systems), which generated infrared light pulses at a wavelength of 1,550 nm with pulse lengths of 66 fs and a fiber length of 36 m. These laser pulses were split into two arms and guided through an optical fiber to two THz antennas (low-temperature molecular beam epitaxy-grown beryllium-doped indium-gallium-arsenide/indium-aluminium-arsenide multinanolayer; commercially available at Menlo Systems). These antennas were mounted on a probe head that was fixed on a movable goniometer arm (Fig. 6A; Supplemental Video S1). The upper antenna acted as an emitter and the lower one as a detector. The radiated THz beam was guided through the probe head via four high-density polyethylene lenses and two plane metallic mirrors, thus focusing the beam on a fir needle. Metallic holding devices were used to define a fixed measurement spot for every probed needle (Fig. 6B). These holding devices were designed to minimize any disturbances that could negatively affect plant growth. Hence, plant shading was reduced to a minimum. With a small and weak magnet, the probed needles were gently attached to a metallic spot face above a pinhole with 1.5 mm in diameter. The pinhole defined the focal spot of the THz radiation and was used to properly adjust the needle position in the optical path. In addition, the pinhole avoided spatial overexposure of the needle by blocking any radiation not guided through the pinhole, which would have led to a degradation of the measured data.
Figure 6.
Measurement setup with the goniometer rotating the THz antennas in a precise angle along the positioned silver fir seedlings (A), which each have one needle clamped with a small magnet onto a holding device that positions the needle directly above a pinhole through which the THz radiation passes (B). [See online article for color version of this figure.]
Up to 12 seedlings were measured automatically over several weeks, with each measuring cycle lasting 1.5 h. Furthermore, we applied a simulated day/night cycle with 10-h days and 14-h nights. Illumination was provided by a Philips bulb with an average of 3,500 lux at approximately 2 m distance from each holding device. During the measurement period, the facilities were monitored by an air conditioning system, which constantly adjusted the temperature within 21°C ± 0.5°C.
The data for a single measurement were acquired as a function of time by varying the spatial length of the optical paths through the detector antenna. Hence, it was possible to detect the time-resolved electrical field of a THz pulse. Fast Fourier transformation allowed calculating the frequency components comprising the THz pulse. By measuring a probe signal and comparing it with a reference signal, the frequency-resolved transmission was calculated in a frequency window ranging from 150 to 300 GHz, without any system-specific characteristics (for further information, see Koch et al., 1998).
Every third measurement was a reference MR (i.e. one holding device without a needle). This was necessary to minimize systematic errors caused by changes in the room temperature or the humidity. This reference was used to adjust the transmission Ta of each measured needle MN using the following equation:
 |
Simultaneously, fluctuations in room temperature and humidity were recorded using a data logger (LOG 32; Dostmann Electronic), which was placed in a shady position on the measuring table adjacent to the holding devices. Illumination intensity during the daytime was measured at several spots on the height and position of the holding devices using a conventional lux meter (LM-1010; Elvos).
To exclude possible variations in transmission attributable to physical causes, two blank holding devices were placed among the others. By measuring those blank controls, variation in transmission of the probed needles could be separated between “real” biological changes in water status and “concealed” fluctuations caused by (long-term) systematic errors. Therefore, the transmission for each seedling was individually corrected by an adjustment function, based on the variation of the control measurements. To be more precise, we subtracted the transmission of the blank controls from the sample transmissions in order to exclude the concealed errors (e.g. proximity to the air conditioning system or the entrance). Finally, each curve was normalized to the determined maximum transmission of the respective holding device without the needle.
THz-TDS Measurements
Initially, one needle of a seedling was cut off and fixed to an adjustable device that allowed moving the needle in parallel above a pinhole. By measuring points along its axis, a transmission profile was obtained. Directly after the measurements, the thickness of the needle at the outermost points of the profile was measured using a digital micrometer screw (Mitutoyo).
To establish a nonlethal stress level by narrowing down the PWP, seedlings R1 and R2 were irrigated after approximately 3 d of transmission increase and seedlings R3 and R4 after 1 and 1.5 d, respectively. Directly prior to the irrigation, one needle was cut off from both R3 and R4 and stored in liquid nitrogen for future genetic analysis. Afterward, the measured needles had to be relocated above the respective pinhole.
In order to establish plants with comparable levels of water stress, seedlings I1 to I5 were irrigated every 2 d with 25 mL of tap water, while S1 to S7 were not irrigated at all. After an increase in transmission from the respective baseline (ΔT) of approximately 14%, two needles of each seedling were cut off. Needles from the irrigated control group were cut off matching the harvesting time of the stressed seedlings. All harvested needles were stored in liquid nitrogen for future genetic analyses.
Gravimetric Water Content
To evaluate the accuracy of the THz measurements, each seedling was stored in a plastic bag directly after the measurement was finished, and the fresh weight (FW) was determined. After drying the seedlings at 110°C to the point of brittleness for 4 to 8 h, depending on the water content and dimensions of the individual seedling, the corresponding dry weights (DW) were determined, and the relative water content (RWC) was calculated for each seedling using the following equation:
 |
Statistical Analysis
To test for a significant correlation between the gravimetric water content and the respective transmission of all measured seedlings, the Pearson product-moment correlation coefficient was calculated. A significant difference in gravimetric water content between the water-stressed group (S1–S6) and the irrigated control group (I1–I5) was tested for with Student’s two-sample t test after confirming the necessary assumptions.
For illustration purposes, the relative transmission over time of each stressed seedling was plotted in one graph. This was done by aligning the baselines of each seedling, although the individual courses had different baselines and were monitored at different times (Supplemental Figs. S1 and S2). The irrigated control seedlings were treated similarly, but in order to determine the variation of the measurement values around the mean, the respective values were set to the same mean transmission of 0%. Based on this new data set, the sd of all irrigated seedlings was calculated. All statistical analyses were carried out using version 2.13.1 of the statistical software R (R Development Core Team, 2011).
Supplemental Data
The following materials are available in the online version of this article.
Supplemental Figure S1. Monitoring of water-stressed seedlings with the corresponding data for temperature and humidity.
Supplemental Figure S2. Monitoring of irrigated seedlings with the corresponding data for temperature and humidity.
Supplemental Figure S3. Monitoring of the seedlings during the rehydration experiment with the corresponding data for temperature and humidity.
Supplemental Table S1. Data for the transmission profile measurements.
Supplemental Table S2. Times of final irrigation, harvesting, and total duration of the drought period for all water-stressed seedlings and the seedlings used in the rehydration experiment.
Supplemental Video S1. Video of THz measurement setup with probe head in motion and closeup of holding device with seedling.
Supplementary Material
Acknowledgments
We thank Hans Lehmann (from the forestry district Oberharmersbach) for providing the seeds within the ERA-Net BiodivERsA project LinkTree, Christina Mengel (Conservation Biology group, Philipps-University Marburg) for helping with the laboratory work, Stefan Busch (Faculty of Physics and Material Sciences Center, Philipps-University Marburg) for assisting with problems regarding software, and Ben Liepelt (Port Royal Films, Großhansdorf, Germany) for editing the video. We also acknowledge the valuable comments of two anonymous reviewers.
Glossary
- THz
terahertz
- THz-TDS
terahertz time-domain spectroscopy
- ΔT
increase or decrease of transmission
- PWP
permanent wilting point
Footnotes
Some figures in this article are displayed in color online but in black and white in the print edition.
The online version of this article contains Web-only data.
References
- Allen CD, Macalady AK, Chenchouni H, Bachelet D, McDowell N, Vennetier M, Kitzberger T, Rigling A, Breshears DD, Hogg EH, et al (2010) A global overview of drought and heat-induced tree mortality reveals emerging climate change risks for forests. For Ecol Manage 259: 660–684 [Google Scholar]
- Breitenstein B, Scheller M, Shakfa MK, Kinder T, Müller-Wirts T, Koch M, Selmar D. (2012) Introducing terahertz technology into plant biology: a novel method to monitor changes in leaf water status. J Appl Bot Food Qual 84: 158–161 [Google Scholar]
- Breshears DD, Cobb NS, Rich PM, Price KP, Allen CD, Balice RG, Romme WH, Kastens JH, Floyd ML, Belnap J, et al. (2005) Regional vegetation die-off in response to global-change-type drought. Proc Natl Acad Sci USA 102: 15144–15148 [DOI] [PMC free article] [PubMed] [Google Scholar]
- Castro-Camus E, Palomar M, Covarrubias AA. (2013) Leaf water dynamics of Arabidopsis thaliana monitored in-vivo using terahertz time-domain spectroscopy. Scientific Reports 3: 2910. [DOI] [PMC free article] [PubMed] [Google Scholar]
- Choat B, Jansen S, Brodribb TJ, Cochard H, Delzon S, Bhaskar R, Bucci SJ, Feild TS, Gleason SM, Hacke UG, et al. (2012) Global convergence in the vulnerability of forests to drought. Nature 491: 752–756 [DOI] [PubMed] [Google Scholar]
- Gente R, Born N, Voß N, Sannemann W, Léon J, Koch M, Castro-Camus E. (2013) Determination of leaf water content from terahertz time-domain spectroscopic data. J Infrared Milli Terahz Waves 34: 316–323 [Google Scholar]
- Guehl JM, Aussenac G. (1987) Photosynthesis decrease and stomatal control of gas exchange in Abies alba Mill. in response to vapor pressure difference. Plant Physiol 83: 316–322 [DOI] [PMC free article] [PubMed] [Google Scholar]
- Guehl JM, Aussenac G, Bouachrine J, Zimmermann R, Pennes JM, Ferhi A, Grieu P. (1991) Sensitivity of leaf gas exchange to atmospheric drought, soil drought, and water-use efficiency in some Mediterranean Abies species. Can J Res 21: 1507–1515 [Google Scholar]
- Hadjiloucas S, Karatzas LS, Bowen JW. (1999) Measurements of leaf water content using terahertz radiation. IEEE Trans Microw Theory Tech 47: 142–149 [Google Scholar]
- Iglesias A, Avis K, Benzie M, Fisher P, Harley M, Hodgson N, Horrocks L, Moneo M, Webb J (2007) Adaptation to Climate Change in the Agricultural Sector. AEA Energy & Environment and Universidad de Politécnica de Madrid, Madrid
- IPCC (2007) Climate Change 2007: The Physical Basis. Cambridge University Press, Cambridge, UK [Google Scholar]
- Jepsen PU, Cooke DG, Koch M. (2011) Terahertz spectroscopy and imaging: modern techniques and applications. Laser & Photonics Reviews 5: 124–166 [Google Scholar]
- Jördens C, Scheller M, Breitenstein B, Selmar D, Koch M. (2009) Evaluation of leaf water status by means of permittivity at terahertz frequencies. J Biol Phys 35: 255–264 [DOI] [PMC free article] [PubMed] [Google Scholar]
- Koch M, Hunsche S, Schumacher P, Nuss MC, Feldmann J, Fromm J. (1998) THz-imaging: a new method for density mapping of wood. Wood Sci Technol 32: 421–427 [Google Scholar]
- Lichtenthaler HK, Rinderle U. (1988) The role of chlorophyll fluorescence in the detection of stress conditions in plants. Crit Rev Anal Chem 19: 29–85 [Google Scholar]
- Mittleman DM, Jacobsen RH, Nuss MC. (1996) T-ray imaging. IEEE J Sel Top Quantum Electron 2: 679–692 [Google Scholar]
- R Development Core Team (2011) R: A Language and Environment for Statistical Computing. R Foundation for Statistical Computing, Vienna
- Scholander PF, Bradstreet ED, Hemmingsen EA, Hammel HT. (1965) Sap pressure in vascular plants: negative hydrostatic pressure can be measured in plants. Science 148: 339–346 [DOI] [PubMed] [Google Scholar]
- Tardieu F, Davies WJ. (1993) Integration of hydraulic and chemical signalling in the control of stomatal conductance and water status of droughted plants. Plant Cell Environ 16: 341–349 [Google Scholar]
- Ulaby FT, Jedlicka RP. (1984) Microwave dielectric properties of plant materials. IEEE Trans Geosci Rem Sens GE-22: 406–415 [Google Scholar]
Associated Data
This section collects any data citations, data availability statements, or supplementary materials included in this article.


