

Abstract
Background
Previous studies showed that endocardial activation during long-duration ventricular fibrillation (VF) exhibits organized activity. We identified and quantified the different types of organized activity.
Methods and Results
Two 64-electrode basket catheters were inserted, respectively, into the left ventricle and right ventricle of dogs to record endocardial activation from the endocardium during 7 minutes of VF (controls, n=6). The study was repeated with the KATP channel opener pinacidil (n=6) and the calcium channel blocker flunarizine (n=6). After 2 minutes of VF without drugs, 2 highly organized left ventricular endocardial activation patterns were observed: (1) ventricular electric synchrony pattern, in which endocardial activation arose focally and either had a propagation sequence similar to sinus rhythm or arose near papillary muscles, and (2) stable pattern, in which activation was regular and repeatable, sometimes forming a stable re-entrant circuit around the left ventricular apex. Between 3 and 7 minutes of VF, the percent of time ventricular electric synchrony was present was control=25%, flunarizine=24% (P=0.44), and pinacidil=0.1% (P<0.001) and the percent of time stable pattern was present was control=71%, flunarizine=48% (P<0.001), and pinacidil=56% (P<0.001). The remainder of the time, nonstable re-entrant activation with little repeatability was present.
Conclusions
After 3 minutes, VF exhibits 2 highly organized endocardial activation patterns 96% of the time, one potentially arising focally in the Purkinje system that was prevented with a KATP channel opener but not a calcium channel blocker and the other potentially arising from a stable re-entrant circuit near the apical left ventricular endocardium.
Keywords: arrhythmias, cardiac, ventricular fibrillation
In the industrialized world, sudden cardiac arrest is a leading cause of death.1 Many sudden cardiac arrests are caused by ventricular fibrillation (VF).1 In the prehospital environment, the mean time from collapse until defibrillation is several minutes.2,3 Knowledge of the mechanisms responsible for the maintenance of long-duration VF (LDVF; duration >1 minute4) is important for the improvement of therapies for out-of-hospital cardiac arrests. However, until recently, most studies have dealt with VF shorter than 1 minute.
In previous studies, we have demonstrated that during LDVF, an organized activation pattern later named ventricular electric synchrony (VES)5 was observed in the canine anterior left ventricle (LV).6 During VES, the endocardium was excited almost simultaneously, with activations then propagating to the epicardium. The VES pattern was observed during LDVF over most of the LV endocardium.5 Both studies5,6 suggested that VES activation began in the Purkinje fiber (PF) system.
In this study, we aimed to answer several questions raised by these previous studies. (1) What other type of activation pattern is present during LDVF except for VES? (2) Are the sites of origin of the VES cycles related to any specific anatomic landmarks? (3) Do KATP channel openers or calcium channel blockers, which can inhibit early afterdepolarizations or delayed afterdepolarizations, influence the incidence VES? To answer these questions, recordings were made from the LV and the right ventricular (RV) endocardium. New algorithms were developed to detect different types of activation patterns during LDVF. To enhance our understanding of the mechanisms of these patterns, LDVF episodes were compared after administration of the KATP channel opener pinacidil or the calcium channel blocker flunarizine with those in control animals.
Methods
All studies were performed in accordance with the American Physiology Society's guiding principles in the care and use of animals. The protocol was approved by the Institutional Animal Care and Use Committee at the University of Alabama at Birmingham.
Animal Preparation
Eighteen mongrel dogs (20.7±1.5 kg, mean±SD) of either sex were anesthetized and divided into 3 groups of 6 animals. For the details of animal preparation, see the online-only Data Supplement. Two basket catheters with 38 and 32 mm diameters (Constellation, Boston Scientific Corp, Natick, MA) were positioned in the LV and RV separately. Each catheter contained 8 splines with 8 unipolar electrodes on each spline. See online-only Data Supplement for how the locations of the electrodes in the cavity were determined.
The 6 control/pinacidil-treated/flunarizine-treated animals were labeled as C1-C6/P1-P6/F1-F6. In the control group, 500 to 1000 mL of normal saline solution was infused intravenously. In the pinacidil group, pinacidil (loading dose 0.5 mg/kg in saline for 10 minutes, maintenance 0.5 mg/kg per hour) was given intravenously. In the flunarizine group, flunarizine (loading dose 2 mg/kg in saline for 10 minutes, maintenance 4 mg/kg per hour) was given intravenously. Thirty minutes after the intravenous injection, VF was induced by 60Hz electric stimulation through a bipolar catheter in the RV. The first 7 minutes of VF were recorded with a 256-channel, 4-kHz sampling rate mapping system filtered between 0.5 and 500 Hz.
Data Analysis
The 7 minutes of VF were divided into 210 2-second episodes. For each episode, activation was identified as the 9-point dV/dt7 of the recordings, reaching a minimum more negative than −0.3 mV/ms. A refractory period ≥50 ms was assumed between successive activations. To quantify the organization level of the LDVF, we defined a synchronicity index (syn-idx) and a regularity index (reg-idx) for each 2-second episode. For algorithm details, see Figure I in the online-only Data Supplement. Syn-idx is an inverse measure of the synchronicity of activation times. When the activations in all channels are simultaneous, syn-idx is 0. With less synchronous activation times, syn-idx becomes larger. Reg-idx is an inverse measure of the regularity of activation times. When the cycle length is constant in each channel, reg-idx is 0. With less regular activation times, reg-idx becomes larger.
All 2-second episodes were divided into 3 patterns according to syn-idx and reg-idx: (1) VES pattern, when syn-idx was ≤0.1, regardless of reg-idx (the pattern of high synchronicity); (2) stable pattern, when syn-idx was >0.1 and reg-idx was ≤0.1 (the pattern of high regularity of nonsynchronous activation); and (3) nonstable pattern, when syn-idx was >0.1 and reg-idx was >0.1 (the fibrillatory pattern of nonsynchronous activation with irregular cycle lengths).
Because of the low spatial resolution of the recordings, we could not construct detailed isochronal maps. We designed algorithms to detect relatively simple endocardial propagation patterns: unidirectional propagation along the splines and re-entrant circuits around the long axis of the LV. There were 2 types of unidirectional propagations along the splines: from the apex to the base (apex–base propagation) and in the reverse direction (base–apex propagation), and 2 types of re-entrant circuits around the LV long axis: from septum to anterior to lateral (sep–ant re-entry) and in the reverse direction (ant–sep reentry). The algorithms are described in detail in Figures III and IV in the online-only Data Supplement.
VES cycles were recognized using the same algorithm as previously described.6 Similar to previously described,5 VES cycles were divided into different groups with similar activation sequences inside 1 group (see online-only Data Supplement for details on statistical methods).
Results
The mean activation rates for all 3 treatment groups were higher during 0 to 3 minutes of VF than during 3 to 7 minutes of VF (see Table I and Figure V in the online-only Data Supplement). Pinacidil had a higher activation rate than control during 3 to 7 minutes of VF, whereas flunarizine did not have an activation rate different from control.
VES, stable, and nonstable patterns were observed on the endocardium during LDVF. Figure 1 shows representative examples. During 0 to 1 minute of VF, endocardial activations were nonstable for animals C1, C2, and P3 (Figure 1A–1C, second column). As VF continued, activations developed into the stable pattern for animals C1 and C2 (Figure 1A and 1B, third column). The activations continued to stay in stable pattern for animal C2 (Figure 1B, fourth column), whereas animal C1 suddenly entered into the VES pattern at 4.2 minutes of VF (Figure 1A, fourth column). In pinacidil-treated animal P3, the activations switched briefly to the stable pattern at ≈1 minute of VF. However, the activations quickly became irregular and redeveloped the nonstable pattern (Figure 1C, third and fourth columns). In general, VF began in the nonstable pattern after which reg-idx frequently decreased, and VF entered the stable pattern. The stable pattern could then either persist or switch to VES or back to the nonstable pattern. During early VF, with the endocardium in nonstable pattern, body surface ECG was similar to that during type I VF.8 During later VF, no matter whether the endocardium was in VES, stable, or non-stable pattern, ECG was similar to that during type II VF8 (see Figure VI in the online-only Data Supplement).
Figure 1.

Examples of synchronicity index (syn-idx) and regularity index (reg-idx) as ventricular fibrillation (VF) progressed. A–C, Left ventricular data from animals C1, C2 and P3. The first columns of A, B, and C show syn-idx and reg-idx every 2 s during the 7 minutes of VF. The horizontal line indicates 0.1 threshold. The vertical dashed lines indicate 0.3, 2.1, and 5.0 minutes of VF. Activation plots of 2 s at these moments are displayed in the second, third, and fourth columns of A, B, and C, in which activation times of the 64 electrodes are represented by short vertical lines. Horizontal lines separate the 8 splines. For each spline, the order of the 8 electrodes is from apex (top) to base (bottom). Above the activation plot, syn-idx, reg-idx, and activation pattern of the 2-s episode are shown from left to right. C indicates control; P, pinacidil; and VES, ventricular electric synchrony.
For control, pinacidil, and flunarizine groups, the average LV incidence of the 3 patterns throughout 7-minute VF is shown in Figure 2. During 0 to 1 minute of VF, endocardial activations were either in the nonstable or stable patterns. The incidence of the nonstable pattern during 0 to 1 minute was 74% in control, 63% in pinacidil, and 41% in flunarizine groups. Between 3 and 7 minutes of VF, VES was present 25% of the time in control and 24% of the time in flunarizine (P=0.44, control versus flunarizine) but only 0.1% of the time in pinacidil (P<0.001, control versus pinacidil) groups. For the same period, the stable pattern was present 71% of the time in control, 56% of the time in pinacidil (P<0.001, control versus pinacidil), and 48% of the time in flunarizine (P<0.001, control versus flunarizine) groups. In control animals, during VES, endocardial activations had a reg-idx >0.1 76% of the time. In flunarizine animals, during VES, endocardial activations had a reg-idx >0.1 82% of the time.
Figure 2.

Left ventricular incidence of ventricular electric synchrony (VES; black bars), stable (white bars), and nonstable (gray bars) patterns every minute during 7 minutes of ventricular fibrillation (VF) in (A) control, (B) pinacidil, and (C) flunarizine animals.
For RV recordings, after 2 minutes of VF, the incidence of the VES pattern was 2.8% in control, 0.1% in pinacidil, and 2.5% in flunarizine groups, much lower than for LV recordings (see online-only Data Supplement). When VES was simultaneously present in the RV and LV, activation in the 2 ventricles seemed independent and asynchronous (Figure VII in the online-only Data Supplement).
The results of apex–base/base–apex propagation and sep– ant/ant–sep re-entry are summarized in Tables II and III in the online-only Data Supplement. Generally, apex–base propagations were more frequently observed during the stable pattern, whereas base–apex propagations were more frequently observed during the VES pattern. Sep–ant re-entry was more frequently observed than ant–sep re-entry.
During the stable pattern, 2 typical endocardial propagation sequences were observed, which are illustrated in Figures 3 and 4. Figure 3 shows an example of highly repeatable global re-entry. Re-entrant circuits were observed on most transverse electrode planes perpendicular to the LV long axis (Figure 3A; for definition of planes see Figure III in the online-only Data Supplement). Apex–base propagation along most splines (Figure 3B; for definition of propagation along splines, see Figure III in the online-only Data Supplement) indicates that the re-entry core was located near the apex. Figure 4 shows an example of highly repeatable breakthrough on endocardium. The breakthrough sites were the same throughout each 1-second recording but varied at different stages of LDVF. At 3.5 minutes of LDVF, breakthrough initiated from spline 3 (Figure 4A). At 5.0 and 6.7 minutes, breakthrough initiated from spline 5 (Figure 4B and 4C) but with different propagation patterns. Apex–base propagation is observed in Figure 4A, 4B, and 4C.
Figure 3.

Example of left ventricular (LV) endocardial re-entry during the stable pattern. A and B, The same 1-s, 64-electrode recordings from animal P4 at 4.6 minutes of long-duration ventricular fibrillation (LDVF) with different orders of the electrodes. In the first column of A, recordings from the 8 transverse planes of electrodes perpendicular to the LV long axis (see Figure III in the online-only Data Supplement for details) are displayed from top (plane 1, toward the apex) to bottom (plane 8, toward the base). For each plane, the order of the 8 electrodes is from spline 1 (s1) to spline 8 (s8). In the first column of B, recordings from splines 1 to 8 are displayed from top to bottom. For each spline, the order of the 8 electrodes is from apex to base. In A and B, the second column shows the amplification of the first column, plane 2 (A) or spline 2 (B), near the blue rectangles I and II. Red dots represent activations, and black arrowhead lines represent the activation propagation direction. Isochronal activation maps from blue rectangles I and II are shown in C. Deep red/blue region represents the location of the re-entrant wavehead at the beginning/end of the isochronal window. Geometric orientation of the isochronal maps is illustrated in the first column of C. Each trapezoid with black boundary lines represents an electrode. The trapezoids representing electrodes from the same spline are aligned along a straight line from the center of the isochronal map to its perimeter. On each spline, the electrode closest to the apex is located at the center of the map, and the electrode closest to the base is located at the perimeter. The locations of 8 splines, spline 2 (area surrounded by the magenta trapezoid), and plane 2 (area between the 2 green octagons) are illustrated in the second column of C. The time scale is shown below each isochronal map. D and E, Isochronal maps of plane 2 and spline 2 during time windows I and II with the same time scale as C. Arrowhead lines indicate the activation propagation direction. p1–p8 indicates plane 1 to plane 8.
Figure 4.

Examples of left ventricular (LV) endocardial breakthrough during the stable pattern. The first columns of A, B and C show 1-s activation plots from animal P5 at 3.5, 5.0, and 6.7 minutes of long-duration ventricular fibrillation. Each short vertical line represents an activation. Horizontal lines separate the 8 splines. For each spline, the order of the 8 electrodes is from apex (top) to base (bottom). At the bottom of each activation plot, the activations for all 64 electrodes are shown on a single line. Isochronal activation maps from blue polygons I, II, and III are shown in the second column of A, B, and C. Geometric orientation of all isochronal maps is shown in the second column of A. The locations of splines 1 to 8 are shown in the second column of B. The time scale is shown below each isochronal map. The earliest activation sites during I, II, and III are shown in red (also indicated by red arrow) in the first column and with white asterisks in the second column. s indicates spline.
The results of classifying the VES cycles into groups with similar activation patterns inside 1 group are shown in Figure 5. There were many different activation patterns during the VES pattern, with different origin sites of the VES cycles (Figure 5A, 5B, 5C, and 5D, first row, first column). In animals C1, C4, and F4, the VES cycles in the largest group were similar as during sinus rhythm, with almost the same origination site, propagation sequence, and propagation speed (Figure 5A–5C, second row, first and second columns). In animal F2, the VES cycles in the largest group had exactly the same origination site and similar propagation speed but a different activation sequence compared with sinus rhythm (Figure 5D, second and fourth columns).
Figure 5.
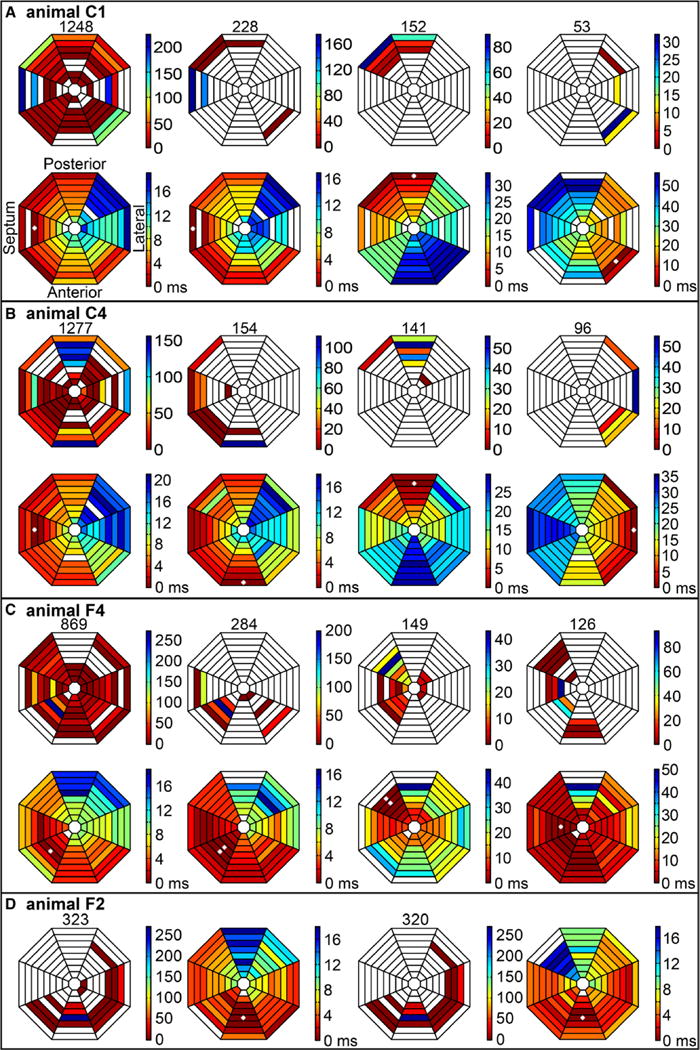
Earliest left ventricular (LV) endocardial activation sites in different activation sequence groups during the ventricular electric synchrony (VES) pattern. A–D, The results from animals C1, C4, F4, and F2. All octagonal maps in A have the same geometric orientation as shown in second row, first column of A. Distribution of earliest sites of all VES cycles during 7 minutes of long-duration ventricular fibrillation (LDVF) is shown in first row, first column of A. Colors represent how many VES cycles originated from that electrode according to the scale bar at the right side. Empty area indicates no VES cycle origination. Total number of VES cycles is shown on top. Also shown are distributions of earliest activation sites of all VES cycles in the group with the largest number of cycles with similar activation sequences (second column), the second largest group (third column), and the third largest group (group 3, fourth column). Total number of VES cycles in each group is shown on the top. Second row shows isochronal maps of representative propagation patterns during 1 cycle for sinus rhythm, the largest VES group, the second largest group, and the third largest group from left to right. Empty areas indicate no activation recorded. Time scale is at the right of each isochronal map. White asterisk indicates the electrode recording earliest activation during the cycle. B and C have the same data presentation as A. D, Distribution of earliest sites of all VES cycles, typical sinus propagation sequence, distribution of earliest sites, and typical propagation sequence of the largest VES group from left to right.
In animal F4, the VES cycles in the third largest group had a similar origination site and activation sequence as during sinus rhythm but with a much slower propagation speed (Figure 5C, second row, first and fourth columns). Another frequent site of origination of VES cycles was the base region near the posterior papillary muscle as in the second largest groups for animals C1, C4, and F4 (Figure 5A–5C, third column). The base near the anterior papillary muscle was a third region where VES cycles frequently originated as in the third largest groups for animals C1 and C4 (Figure 5A and 5B, fourth column).
Discussion
The major findings of this study were as follows: (1) After 2 minutes of VF, 2 highly organized activation patterns were observed on the canine LV endocardium, the stable pattern (71%), and the VES pattern (25%); (2) with application of the KATP opener pinacidil, the VES pattern dropped to 0.1% after 2 minutes of LDVF with endocardial activation either in the stable pattern (56%) or in the nonstable pattern (44%); (3) with the calcium channel blocker flunarizine, all 3 activation patterns were observed after 2 minutes of LDVF (VES pattern 24%, stable pattern 48%, and nonstable pattern 28%); (4) during the stable pattern, highly repeatable global re-entry or breakthrough was frequently observed on the endocardium. In both cases, activation frequently propagated from the apex to the base; (5) during the VES pattern, focal activations originated from multiple endocardial sites. Some focal beats had a propagation sequence similar to sinus rhythm. Other focal cycles originated near the papillary muscles; (6) after 2 minutes of VF, the VES pattern was rare in the RV (0.1%–2.8% for 3 groups).
In previous studies,5,6 periods of organization during LDVF were observed, in which the wavefront first activated the mapped endocardial region almost simultaneously and then propagated toward the epicardium with large temporal gaps between successive wavefronts,6 which was named the VES pattern.5 VES beats were probably maintained by a mechanism other than re-entry.5,6 During the VES pattern, PF activations preceded and maintained a relatively consistent relationship with the following working myocardium activation similar as during sinus rhythm,6 which implied that VES activation might initiate inside the PF network and then propagate into working myocardium. This study adds new knowledge about the mechanisms of VES. In all 4 animals with LV VES, VES cycles have the same or similar endocardial initiation sites, endocardial propagation sequences, and endocardial propagation speed as during sinus rhythm (Figure 5). It is likely that during these VES cycles, activation propagated from PF to working myocardium through the same or similar PF network as during sinus rhythm.
Pinacidil is a KATP channel opener that has the effect of shortening action potential duration (APD) and refractory period, increases VF activation rate, and lowers early afterdepolarization incidence.9–11 Flunarizine is a calcium channel blocker that reduces VF activation rate, reduces delayed afterdepolarization incidence, and has also been reported to inhibit early afterdepolarization incidence.8,12,13 During LDVF, VES was almost eliminated by pinacidil (0.1% versus 25%, pinacidil versus control, P<0.001), whereas flunarizine had no effect on VES incidence (24% versus 25%, flunarizine versus control, P=0.44). Previously, we reported that the VF cycle length increases significantly during VES initiation from 159±11 to 235±32 ms (mean±SD of 10 cycles before and after VES initiation).6 One possible explanation is that the VES pattern is overdriven suppressed when the faster activation rates associated with the nonstable and stable patterns are present. Pinacidil increases VF activation rate11 and may cause the nonstable and stable patterns to persist longer than control and flunarizine, thus delaying the onset of VES.
In addition to the VES pattern and consistent with triggered activity within the PF system,6 stable and nonstable patterns were frequently observed, which is more likely maintained by re-entry. Wu et al8 proposed 2 types of VF. Type I VF is associated with a steep APD restitution and flat conduction velocity (CV) restitution, and type II VF is associated with a flattened APD restitution and broad CV restitution, possibly resulting from low tissue excitability during later VF.8,14 With a flat APD restitution and a still flat CV restitution, there will be ventricular tachycardia instead of VF.8,14 In this study, we found that in early VF, the nonstable pattern has an ECG similar to that of type I VF8 (Figure VI in the online-only Data Supplement). However, during later VF, no matter whether it was VES, stable, or nonstable pattern on endocardium, the ECG always has the appearance of type II VF8 (Figure VI in the online-only Data Supplement). Previously, we proposed possible explanations why ECG is VF-like when an organized endocardial activation exists in canine LV during later VF6: (1) many wavefronts blocked when propagating intramurally toward the epicardium, and the block sites might vary continuously, which should be more obvious on bigger animals with greater ventricular wall thickness, and (2) other portions of the heart might not have been in an organized pattern when VES or stable pattern was observed on endocardium. We suppose that the nonstable pattern during early VF with low ischemic level is probably type I VF. Nonstable pattern during later VF is more likely a type II VF, an unstable re-entrant pattern caused by flattened APD restitution and broad CV restitution caused by global ischemia. The stable pattern during later VF is in fact similar to the specific ventricular tachycardia pattern with flattened APD restitution and still flat CV restitution. Interestingly, during later VF, there is almost no nonstable pattern (4%) but frequent stable pattern (71%) on endocardium in control animals, which are physiologically normal before the VF starts.
A large, stable mother rotor15 rotating around the LV apex would yield propagation sequences similar to those during the stable pattern. During the stable pattern, breakthroughs on the endocardium were frequently observed (Figure 4), which may have been generated by a re-entrant circuit located intramurally rather than by a focal source because regular cycle lengths and highly repeatable pathways were observed. During the stable pattern, apex–base propagation was also frequently observed, whereas base–apex propagation was rare (Table II in the online-only Data Supplement), indicating the existence of a driving source closer to the apex than to the base of the LV.
The nonstable pattern during later LDVF was rarely observed in control (4%) but was frequently observed in pinacidil (44%) or flunarizine (28%) group. Pinacidil has no significant influence on tissue excitability.10,16 However, increased APD restitution slope was observed with pinacidil,17 which can transform stable ventricular tachycardia into nonstable VF. Increased incidence of VF was observed with pinacidil,10,18 sometimes with pre-existing ischemia.10 In the pinacidil group, the increase in nonstable pattern incidence during later VF is likely caused by the increased APD restitution slope because of pinacidil application. Generally, blocking calcium channels flattens APD restitution curve8,19,20 and prevents spiral wave breakup,8,19,20 which is contradictory to what we observed in the flunarizine group. However, flunarizine also blocks sodium channels21 and slows down conduction time,22 which we suspect broadens CV restitution during ischemia and increases the incidence of nonstable pattern.
The limitations of this study were as follows: (1) Transmural and epicardial activations during the stable and nonstable patterns, especially near the apex region, which might be the location of a mother rotor, were not recorded; (2) the resolution of the 64-electrode basket catheter with interelectrode spacing of 4 mm does not allow quantitative wavefront analysis and limits the recognition of small re-entry circuits; (3) the study was conducted on normal heart. The mechanism of VF induction and the condition of the heart may play a significant role in the incidence of the described activation patterns. Re-evaluation of the results under conditions such as infarct, reperfusion, or heart failure may lead to further understanding of the clinical implications of these activation patterns. (4) The technical difficulty in obtaining good quality signals from the RV made it impossible to calculate the exact incidences of 3 patterns on RV endocardium or to quantitatively analyze the propagation directions and re-entry pathways.
Supplementary Material
Supplement Table 1. Mean activation rates during various time periods for treatment groups.
Supplement Table 2. The effect of type of LV endocardial activation pattern and drug application on apex-base and base-apex propagation after 2 min of LDVF
Supplement Table 3. The effect of drug application on sep-ant and ant-sep LV endocardial reentry after 2 min of LDVF
Supplement Figure 1. Algorithm for syn-idx and reg-idx calculation. Application of the algorithm to 2-s LV episodes are shown from animal C1 at 6.5 min of VF (A) and animal C2 at 5.8 min of VF (B). In each panel, the 64-unipolar basket recordings are shown in the 1st row. The activation times of the electrodes for the same episode are shown in the 2nd row with each short vertical line representing an activation. The order of 64 electrodes is illustrated in the 2nd row of B. Horizontal lines separate the 8 splines. For each spline, the order of the 8 electrodes is from the apex (top) to the base (bottom). At the bottom of the activation time plot, the activations for all 64 electrodes are shown on a single line. The 2-s episodes are separated into successive cycles by thin vertical lines (cycle dividers). Cycle synchronicity for each cycle is shown in the 3rd row, with the syn-idx for the episode on top. Channel regularity for each channel is shown in the 4th row, with the reg-idx for the episode on top.
Supplement Figure 2. Determining the cycle dividers. A and B show the same examples as in Figure 1, 2-s episodes recorded from the LV endocardium from animal C1 at 6.5 min of VF and animal C2 at 5.8 min of VF. In each panel, the activation times for the electrodes during the same 2-s episode with each short vertical line representing an activation are shown. The order of 64 electrodes is illustrated in the 1st row of A. Horizontal lines separate the 8 splines of electrodes. For each spline, order of the 8 electrodes is from apex (top) to base (bottom). At the bottom of each panel the activations for all 64 electrodes are shown on a single line. In the 1st row, the activations of the landmark channel are red. For A and B, the differences between the EMCL and the mean cycle length of the landmark channel are 0.03 ms and 0.02 ms. In the 2nd row, the positions of the times of the landmark channel activations are red vertical lines. In the 3rd row, the positions of the times of the landmark channel activations minus half of the EMCL, i.e., the cycle dividers, are blue vertical lines.
Supplement Figure 3. Schematic pathways of apex-base propagation, base-apex propagation, sep-ant reentry and ant-sep reentry. A shows 8 splines (black curves) of the basket catheter and the electrodes on the splines (black dots). B shows 8 parallel planes (blue circles) from the apex to the base, the splines (black curves) and the electrodes (black dots). C shows only the 8 planes (blue circles) and the electrodes (black dots). Panels A, B and C are in the same orientation. E shows the same content as B with slightly different orientation in which 8 planes project into 8 horizontal lines. The 8 planes are perpendicular to the LV long axis in the schematic drawing. The 8 electrodes from the 8 splines closest to the apex are located on plane 1. The 8 electrodes from the 8 splines closest to the base are located on plane 8. D shows one spline (black half circle) with its electrodes (black dots). Activation can propagation from the apex to the base along the spline (apex-base propagation, black curve with arrowhead on the left side) or in the reverse direction (base-apex propagation, black curve with arrowhead on the right side). F shows plane 1 viewed from the base along the LV long axis. The blue circle connecting the 8 electrodes (black dots) is the presumable reentry pathway. Sep-ant reentry propagates counterclockwise (black curve with arrowhead outside the blue circle, from septum to anterior, from electrode 1 to 2 to 3). Ant-sep reentry propagates in the reverse direction (black curve with arrow head inside the blue circle). The electrode number inside the blue circle indicates which spline it belongs to. The position of spline 1 / electrode 1 varied from animal to animal. However, with the orientation in F, splines 1-8 were always located counterclockwise around the LV wall.
Supplement Figure 4. Algorithm for detecting apex-base / base-apex propagation and sep-ant / ant-sep reentry. A shows the detection of apex-base propagation during a 2-s episode from animal C2 at 4.4 min of VF. B shows the detection of sep-ant reentry during a 2-s episode from animal P4 at 5.3 min of VF. In A and B, both top and bottom panels show activation times of the 64 electrodes. In A, horizontal lines separate the 8 splines of electrodes. For each spline, the order of the 8 electrodes is from apex (top) to base (bottom). In B, horizontal lines separate the 8 transverse planes perpendicular to the long axis of the LV (see supplement Figure 2). For each plane, the order of the 8 electrodes is from spline 1 (s1, top) to spline 8 (s8, bottom). In the top panels of A and B, different colors represent different activation groups. In the bottom panel of A, activation groups with unidirectional propagation from the apex to the base and length ≥ 5 electrodes are in red and all others are in blue. Filled arrows indicate the splines with apex-base propagation. Empty arrows indicate splines not included in the analysis because they contain no activation groups with length ≥ 5 electrodes. In the bottom panel of B, segments containing reentrant circuits propagating from septum to anterior to lateral are in red and all others are in blue. One activation group can contain reentrant segments and non-reentrant segments simultaneously. Empty arrows indicate planes not included in the analysis because they contain 2 successive electrodes recording no activations. In planes 5 and 7, the successive silent electrodes are from spline 1 and spline 8. Beneath each plane, the horizontal red lines indicate the existence of reentrant circuit on this plane. At the very bottom of the panel, the horizontal red lines indicate the existence of reentrant circuits on any plane during the 2-s episode.
Supplement Figure 5. Mean activation rate from all animals in each of the 3 groups.
Supplement Figure 6. Body surface ECG during three patterns. These are the same 2-s VF episodes as in Figure 1 in manuscript, from animals C1, C2 and P3 at 0.3 min, 2.1 min and 5.0 min of VF. In each sub panel, Activation plot is displayed on top, in which activation times of the 64 electrodes are represented by short vertical lines with horizontal lines separating the 8 splines. Above the activation plot, syn-idx, reg-idx, and activation pattern of the 2-s episode are shown from left to right. Below the activation plot the corresponding body surface ECG from V3 lead is displayed.
Supplement Figure 7. Simultaneous LV and RV basket recordings during different VES patterns. A, B and C show the LV and RV endocardial activation times recorded from animal C1 at 5.0 min of VF, animal C2 at 6.4 min of VF and animal C4 at 2.6 min of VF. In each panel, the activation times for the LV electrodes with each red short vertical line representing an activation are shown on the top half, followed by blue short vertical lines representing RV electrode activation times on the bottom half. The order of the 128 basket electrodes is illustrated in A. Horizontal lines separate different splines of electrodes. For each spline, the order of the 8 electrodes is from apex (top) to base (bottom). Below the activation times for the individual electrodes, the activation times for all 64 LV electrodes are shown in red on a single line, the activations for all 64 RV electrodes are shown in blue on a single line, and the activations for all 128 LV and RV electrodes are shown in green on a single line.
Clinical Perspective.
Defibrillation shocks, the only effective treatment for termination of ventricular fibrillation (VF) causing out-of-hospital cardiac arrest, are often delivered after several minutes of VF. This study of VF in a canine model found that 2 distinct organized activation patterns develop on the left ventricular endocardium as VF progresses. Between 3 and 7 minutes of VF, a time period during which many patients with VF receive initial therapy, these 2 organized patterns are present 96% of the time. One activation pattern is consistent with a dominant, large re-entrant circuit, and the other is consistent with triggered activity, possibly originating in the Purkinje system. These distinct activation patterns may have prognostic value, differing optimal treatment therapies, and may provide insight into the progression of seemingly chaotic activation patterns observed during VF. These organized activation patterns are described and characterized, which is a prerequisite for integrating this information into treatment strategies.
Acknowledgments
F. Vance and S. Melnick provided excellent technical support.
Sources of Funding: This work was supported by National Institutes of Health grants HL-85370 and HL-91138.
Footnotes
Permissions: Requests for permissions to reproduce figures, tables, or portions of articles originally published in Circulation: Arrhythmia and Electrophysiology can be obtained via RightsLink, a service of the Copyright Clearance Center, not the Editorial Office. Once the online version of the published article for which permission is being requested is located, click Request Permissions in the middle column of the Web page under Services. Further information about this process is available in the Permissions and Rights Question and Answer document.
Reprints: Information about reprints can be found online at: http://www.lww.com/reprints
Subscriptions: Information about subscribing to Circulation: Arrhythmia and Electrophysiology is online at: http://circep.ahajournals.org//subscriptions/
Disclosures: None.
References
- 1.Myerburg RJ, Catellanos A. Sudden cardiac death. In: Zopes DP, Jalife J, editors. Cardiac Electrophysiology: From Cell to Bedside. 5th. Saunders Publishing; 2009. pp. 797–808. [Google Scholar]
- 2.Valenzuela TD, Roe DJ, Cretin S, Spaite DW, Larsen MP. Estimating effectiveness of cardiac arrest interventions: a logistic regression survival model. Circulation. 1997;96:3308–3313. doi: 10.1161/01.cir.96.10.3308. [DOI] [PubMed] [Google Scholar]
- 3.Valenzuela TD, Roe DJ, Nichol G, Clark LL, Spaite DW, Hardman RG. Outcomes of rapid defibrillation by security officers after cardiac arrest in casinos. N Engl J Med. 2000;343:1206–1209. doi: 10.1056/NEJM200010263431701. [DOI] [PubMed] [Google Scholar]
- 4.Tabereaux PB, Walcott GP, Rogers JM, Kim J, Dosdall DJ, Robertson PG, Killingsworth CR, Smith WM, Ideker RE. Activation patterns of Purkinje fibers during long-duration ventricular fibrillation in an isolated canine heart model. Circulation. 2007;116:1113–1119. doi: 10.1161/CIRCULATIONAHA.107.699264. [DOI] [PubMed] [Google Scholar]
- 5.Robichaux RP, Dosdall DJ, Osorio J, Garner NW, Li L, Huang J, Ideker RE. Periods of highly synchronous, non-reentrant endocardial activation cycles occur during long-duration ventricular fibrillation. J Cardiovasc Electrophysiol. 2010;21:1266–1273. doi: 10.1111/j.1540-8167.2010.01803.x. [DOI] [PMC free article] [PubMed] [Google Scholar]
- 6.Li L, Jin Q, Dosdall DJ, Huang J, Pogwizd SM, Ideker RE. Activation becomes highly organized during long-duration ventricular fibrillation in canine hearts. Am J Physiol Heart Circ Physiol. 2010;298:H2046–H2053. doi: 10.1152/ajpheart.01196.2009. [DOI] [PMC free article] [PubMed] [Google Scholar]
- 7.Bollacker KD, Simpson EV, Hillsley RE, Blanchard SM, Gerstle RJ, Walcott GP, Callihan RC, King MC, Smith WM, Ideker RE. An automated technique for identification and analysis of activation fronts in a 2-D electrogram array. Comput Biomed Res. 1994;27:229–244. doi: 10.1006/cbmr.1994.1019. [DOI] [PubMed] [Google Scholar]
- 8.Wu TJ, Lin SF, Weiss JN, Ting CT, Chen PS. Two types of ventricular fibrillation in isolated rabbit hearts: importance of excitability and action potential duration restitution. Circulation. 2002;106:1859–1866. doi: 10.1161/01.cir.0000031334.49170.fb. [DOI] [PubMed] [Google Scholar]
- 9.Arena JP, Kass RS. Enhancement of potassium-sensitive current in heart cells by pinacidil. Evidence for modulation of the ATP-sensitive potassium channel. Circ Res. 1989;65:436–445. doi: 10.1161/01.res.65.2.436. [DOI] [PubMed] [Google Scholar]
- 10.Chi L, Uprichard AC, Lucchesi BR. Profibrillatory actions of pinacidil in a conscious canine model of sudden coronary death. J Cardiovasc Pharmacol. 1990;15:452–464. doi: 10.1097/00005344-199003000-00016. [DOI] [PubMed] [Google Scholar]
- 11.Zheng X, Walcott GP, Smith WM, Ideker RE. Evidence that activation following failed defibrillation is not caused by triggered activity. J Cardiovasc Electrophysiol. 2005;16:1200–1205. doi: 10.1111/j.1540-8167.2005.50045.x. [DOI] [PubMed] [Google Scholar]
- 12.Vos MA, Gorgels AP, Leunissen JD, van der Nagel T, Halbertsma FJ, Wellens HJ. Further observations to confirm the arrhythmia mechanism-specific effects of flunarizine. J Cardiovasc Pharmacol. 1992;19:682–690. [PubMed] [Google Scholar]
- 13.Goldhaber JI, Xie LH, Duong T, Motter C, Khuu K, Weiss JN. Action potential duration restitution and alternans in rabbit ventricular myocytes: the key role of intracellular calcium cycling. Circ Res. 2005;96:459–466. doi: 10.1161/01.RES.0000156891.66893.83. [DOI] [PubMed] [Google Scholar]
- 14.Chen PS, Wu TJ, Ting CT, Karagueuzian HS, Garfinkel A, Lin SF, Weiss JN. A tale of two fibrillations. Circulation. 2003;108:2298–2303. doi: 10.1161/01.CIR.0000094404.26004.07. [DOI] [PubMed] [Google Scholar]
- 15.Zaitsev AV, Berenfeld O, Mironov SF, Jalife J, Pertsov AM. Distribution of excitation frequencies on the epicardial and endocardial surfaces of fibrillating ventricular wall of the sheep heart. Circ Res. 2000;86:408–417. doi: 10.1161/01.res.86.4.408. [DOI] [PubMed] [Google Scholar]
- 16.Di Diego JM, Antzelevitch C. Pinacidil-induced electrical heterogeneity and extrasystolic activity in canine ventricular tissues. Does activation of ATP-regulated potassium current promote phase 2 reentry? Circulation. 1993;88:1177–1189. doi: 10.1161/01.cir.88.3.1177. [DOI] [PubMed] [Google Scholar]
- 17.Kijtawornrat A, Panyasing Y, Del Rio C, Hamlin RL. Assessment of ECG interval and restitution parameters in the canine model of short QT syndrome. J Pharmacol Toxicol Methods. 2010;61:231–237. doi: 10.1016/j.vascn.2010.02.001. [DOI] [PubMed] [Google Scholar]
- 18.Fedorov VV, Glukhov AV, Ambrosi CM, Kostecki G, Chang R, Janks D, Schuessler RB, Moazami N, Nichols CG, Efimov IR. Effects of KATP channel openers diazoxide and pinacidil in coronary-perfused atria and ventricles from failing and non-failing human hearts. J Mol Cell Cardiol. 2011;51:215–225. doi: 10.1016/j.yjmcc.2011.04.016. [DOI] [PMC free article] [PubMed] [Google Scholar]
- 19.Riccio ML, Koller ML, Gilmour RF., Jr Electrical restitution and spatiotemporal organization during ventricular fibrillation. Circ Res. 1999;84:955–963. doi: 10.1161/01.res.84.8.955. [DOI] [PubMed] [Google Scholar]
- 20.Qu Z, Weiss JN, Garfinkel A. Cardiac electrical restitution properties and stability of reentrant spiral waves: a simulation study. Am J Physiol. 1999;276(1 Pt 2):H269–H283. doi: 10.1152/ajpheart.1999.276.1.H269. [DOI] [PubMed] [Google Scholar]
- 21.Velly J, Grima M, Marciniak G, Spach MO, Schwartz J. Effects of some antianginal and vasodilating drugs on sodium influx and on the binding of 3H-batrachotoxinin-A 20-alpha-benzoate and 3H-tetracaine. Naunyn Schmiedebergs Arch Pharmacol. 1987;335:176–182. doi: 10.1007/BF00177720. [DOI] [PubMed] [Google Scholar]
- 22.Vitebskiy SA, Khrestian CM, Waldo AL. Termination of a tachyarrhythmia by flunarizine is not a specific marker for a triggered mechanism. Heart Rhythm. 2007;4:1544–1552. doi: 10.1016/j.hrthm.2007.08.018. [DOI] [PMC free article] [PubMed] [Google Scholar]
Associated Data
This section collects any data citations, data availability statements, or supplementary materials included in this article.
Supplementary Materials
Supplement Table 1. Mean activation rates during various time periods for treatment groups.
Supplement Table 2. The effect of type of LV endocardial activation pattern and drug application on apex-base and base-apex propagation after 2 min of LDVF
Supplement Table 3. The effect of drug application on sep-ant and ant-sep LV endocardial reentry after 2 min of LDVF
Supplement Figure 1. Algorithm for syn-idx and reg-idx calculation. Application of the algorithm to 2-s LV episodes are shown from animal C1 at 6.5 min of VF (A) and animal C2 at 5.8 min of VF (B). In each panel, the 64-unipolar basket recordings are shown in the 1st row. The activation times of the electrodes for the same episode are shown in the 2nd row with each short vertical line representing an activation. The order of 64 electrodes is illustrated in the 2nd row of B. Horizontal lines separate the 8 splines. For each spline, the order of the 8 electrodes is from the apex (top) to the base (bottom). At the bottom of the activation time plot, the activations for all 64 electrodes are shown on a single line. The 2-s episodes are separated into successive cycles by thin vertical lines (cycle dividers). Cycle synchronicity for each cycle is shown in the 3rd row, with the syn-idx for the episode on top. Channel regularity for each channel is shown in the 4th row, with the reg-idx for the episode on top.
Supplement Figure 2. Determining the cycle dividers. A and B show the same examples as in Figure 1, 2-s episodes recorded from the LV endocardium from animal C1 at 6.5 min of VF and animal C2 at 5.8 min of VF. In each panel, the activation times for the electrodes during the same 2-s episode with each short vertical line representing an activation are shown. The order of 64 electrodes is illustrated in the 1st row of A. Horizontal lines separate the 8 splines of electrodes. For each spline, order of the 8 electrodes is from apex (top) to base (bottom). At the bottom of each panel the activations for all 64 electrodes are shown on a single line. In the 1st row, the activations of the landmark channel are red. For A and B, the differences between the EMCL and the mean cycle length of the landmark channel are 0.03 ms and 0.02 ms. In the 2nd row, the positions of the times of the landmark channel activations are red vertical lines. In the 3rd row, the positions of the times of the landmark channel activations minus half of the EMCL, i.e., the cycle dividers, are blue vertical lines.
Supplement Figure 3. Schematic pathways of apex-base propagation, base-apex propagation, sep-ant reentry and ant-sep reentry. A shows 8 splines (black curves) of the basket catheter and the electrodes on the splines (black dots). B shows 8 parallel planes (blue circles) from the apex to the base, the splines (black curves) and the electrodes (black dots). C shows only the 8 planes (blue circles) and the electrodes (black dots). Panels A, B and C are in the same orientation. E shows the same content as B with slightly different orientation in which 8 planes project into 8 horizontal lines. The 8 planes are perpendicular to the LV long axis in the schematic drawing. The 8 electrodes from the 8 splines closest to the apex are located on plane 1. The 8 electrodes from the 8 splines closest to the base are located on plane 8. D shows one spline (black half circle) with its electrodes (black dots). Activation can propagation from the apex to the base along the spline (apex-base propagation, black curve with arrowhead on the left side) or in the reverse direction (base-apex propagation, black curve with arrowhead on the right side). F shows plane 1 viewed from the base along the LV long axis. The blue circle connecting the 8 electrodes (black dots) is the presumable reentry pathway. Sep-ant reentry propagates counterclockwise (black curve with arrowhead outside the blue circle, from septum to anterior, from electrode 1 to 2 to 3). Ant-sep reentry propagates in the reverse direction (black curve with arrow head inside the blue circle). The electrode number inside the blue circle indicates which spline it belongs to. The position of spline 1 / electrode 1 varied from animal to animal. However, with the orientation in F, splines 1-8 were always located counterclockwise around the LV wall.
Supplement Figure 4. Algorithm for detecting apex-base / base-apex propagation and sep-ant / ant-sep reentry. A shows the detection of apex-base propagation during a 2-s episode from animal C2 at 4.4 min of VF. B shows the detection of sep-ant reentry during a 2-s episode from animal P4 at 5.3 min of VF. In A and B, both top and bottom panels show activation times of the 64 electrodes. In A, horizontal lines separate the 8 splines of electrodes. For each spline, the order of the 8 electrodes is from apex (top) to base (bottom). In B, horizontal lines separate the 8 transverse planes perpendicular to the long axis of the LV (see supplement Figure 2). For each plane, the order of the 8 electrodes is from spline 1 (s1, top) to spline 8 (s8, bottom). In the top panels of A and B, different colors represent different activation groups. In the bottom panel of A, activation groups with unidirectional propagation from the apex to the base and length ≥ 5 electrodes are in red and all others are in blue. Filled arrows indicate the splines with apex-base propagation. Empty arrows indicate splines not included in the analysis because they contain no activation groups with length ≥ 5 electrodes. In the bottom panel of B, segments containing reentrant circuits propagating from septum to anterior to lateral are in red and all others are in blue. One activation group can contain reentrant segments and non-reentrant segments simultaneously. Empty arrows indicate planes not included in the analysis because they contain 2 successive electrodes recording no activations. In planes 5 and 7, the successive silent electrodes are from spline 1 and spline 8. Beneath each plane, the horizontal red lines indicate the existence of reentrant circuit on this plane. At the very bottom of the panel, the horizontal red lines indicate the existence of reentrant circuits on any plane during the 2-s episode.
Supplement Figure 5. Mean activation rate from all animals in each of the 3 groups.
Supplement Figure 6. Body surface ECG during three patterns. These are the same 2-s VF episodes as in Figure 1 in manuscript, from animals C1, C2 and P3 at 0.3 min, 2.1 min and 5.0 min of VF. In each sub panel, Activation plot is displayed on top, in which activation times of the 64 electrodes are represented by short vertical lines with horizontal lines separating the 8 splines. Above the activation plot, syn-idx, reg-idx, and activation pattern of the 2-s episode are shown from left to right. Below the activation plot the corresponding body surface ECG from V3 lead is displayed.
Supplement Figure 7. Simultaneous LV and RV basket recordings during different VES patterns. A, B and C show the LV and RV endocardial activation times recorded from animal C1 at 5.0 min of VF, animal C2 at 6.4 min of VF and animal C4 at 2.6 min of VF. In each panel, the activation times for the LV electrodes with each red short vertical line representing an activation are shown on the top half, followed by blue short vertical lines representing RV electrode activation times on the bottom half. The order of the 128 basket electrodes is illustrated in A. Horizontal lines separate different splines of electrodes. For each spline, the order of the 8 electrodes is from apex (top) to base (bottom). Below the activation times for the individual electrodes, the activation times for all 64 LV electrodes are shown in red on a single line, the activations for all 64 RV electrodes are shown in blue on a single line, and the activations for all 128 LV and RV electrodes are shown in green on a single line.