ABSTRACT
We have previously suggested that activation of the hypothalamic-pituitary-adrenal (HPA) axis is dependent on cyclooxygenase (COX)-2-related signaling under infectious and restraint stresses, but less dependent on it under hypoglycemic stress. In the present study, we evaluated the neuronal activity in the brain to elucidate the possible mechanisms underlying a stress-specific relevance between COX-2-related signaling and activation of the HPA axis under infectious (lipopolysaccharide, LPS), hypoglycemic (2-deoxy-D-glucose, 2DG) and restraint (1 hr) stress conditions. The number of c-Fos-immunoreactive (IR) cells in several brain regions including the paraventricular nucleus (PVN) and supraoptic nucleus (SON) was increased at 120 min after application of all stress stimuli. The number of c-Fos-IR cells at 30 min was increased only by 2DG in the SON, but not in the PVN. In the PVN, a selective COX-2 inhibitor (NS-398) did not affect the number of c-Fos-IR cells at any time points. On the other hand, in the SON, NS-398 increased c-Fos-IR cells at 30 min after LPS and restraint stresses, but not after 2DG injection. These results suggest that, among the brain regions responding to acute stresses, the PVN and SON are commonly activated under three acute stresses. In addition, it is also suggested that COX-2-related signaling decreases neuronal activity in the SON under infectious and restraint, but not hypoglycemic, stresses, which may be involved in the suppression of the HPA axis.
Keywords: c-Fos, COX-2, hypothalamus, stress
The hypothalamic-pituitary-adrenal (HPA) axis invokes a number of physiological changes that enhance adaptation of the individual in the face of acute stresses [26]. Prostaglandins (PGs) are bioactive lipids derived from arachidonic acid by the sequential actions of phospholipase A, cyclooxygenase (COX) and specific PG synthases [6]. COX exists as the isozymes COX-1, which is constitutively expressed, and COX-2, which is usually expressed at low basal levels and rapidly induced in response to various stimuli [13, 24]. COX [7, 9, 31] and microsomal prostaglandin E synthase-1 (mPGES-1), a terminal PGE2 synthase [7, 8], are involved in the activation of the HPA axis. We have previously demonstrated that selective COX-2 inhibitor NS398 attenuated the increase in serum corticosterone levels at 30 and 120 min after lipopolysaccharide (LPS) and restraint stress stimuli. On the other hand, this inhibitory effect of COX-2 inhibitor was not discernible on the 2-deoxy-D-glucose (2DG)-injected animals. These results suggest that activation of the HPA axis is at least partially dependent on COX-2-related signaling under infectious and restraint stresses, but less dependent on it under hypoglycemic stress [15]. However, the mechanisms underlying a stress-specific relevance between COX-2-related signaling and activation of the HPA axis remain to be elucidated.
The immediate early gene c-Fos is rapidly and transiently expressed in neurons in response to various stimuli [17]. c-Fos expression has been widespreadly used as a marker for neuronal activity to examine networks of neurons within multiple sites in the nervous system and to identify specific neurons that were activated by stimuli [5, 16, 20]. The present study aimed to investigate the relationship between hypothalamic COX-2-related signaling and the neuronal activation under three different acute stress conditions. First, we outlined the stress-induced pattern of neuronal activation by means of immunohistochemistry for the immediate early gene product c-Fos in the brain following infectious (LPS), hypoglycemic (2DG) and restraint stress stimuli. Subsequently, we examined the effect of selective COX-2 inhibitor on c-Fos immunoreactivity to elucidate the possible role of COX-2-related signaling in the neuronal activation.
MATERIALS AND METHODS
Animals: Adult male Wistar-Imamichi strain rats (body weight (BW), 220–250 g) were obtained from the Imamichi Institute for Animal Reproduction (Tsuchiura, Japan). The animals were housed at constant ambient temperature of 24°C with controlled lighting (lights on, 0500–1900 hr) and given free access to food and water. All animals were maintained under constant conditions for 7 days before experiment. The experiments were conducted according to the Guidelines for the Care and Use of Laboratory Animals, Graduate School of Agricultural and Life Sciences, The University of Tokyo.
Stress conditions: On the day of the experiment, the rats were moved to the experimental room and allowed an adaptation period of at least 2 hr. Three different types of stresses, namely infectious (LPS; Sigma, St. Louis, MO, U.S.A.; 100 µg/kg BW, ip), hypoglycemic (2DG; Sigma; 400 mg/kg BW, ip) or restraint (1 hr) stresses were applied to rats. Animals were divided into 2 groups and given a selective COX-2 inhibitor (NS-398; Cayman Chemical, Ann Arbor, MI, U.S.A.; 10 mg/kg BW, ip) or vehicle (DMSO; Sigma) 30 min before stress application. Just before stress application (0 min) and 30 and 120 min after the start of stress application, animals were decapitated, and the whole brain was removed and fixed in cold 4% paraformaldehyde in phosphate-buffered saline (PBS; 0.02 M, pH 7.2).
Immunohistochemistry for c-Fos: Brains were further fixed for 48 hr at 4°C in the fixative paraformaldehyde solution and then submerged in 10% sucrose solution overnight, 20% sucrose solution for 24 hr and 30% sucrose for 48 hr until the brain completely sank. Brain sections of 30 µm thickness were cut using a cryostat (Microm HM550, Thermo Scientific, Waltham, MA, U.S.A.) and collected serially in 24-well plates containing PBS (0.02 M, pH 7.2). One out of every eight slices was used for immunostaining for c-Fos protein. Free-floating sections were rinsed with PBS for 10 min three times. Sections were then incubated with 0.3% H2O2 in PBS for 30 min at room temperature and rinsed with PBS for 10 min three times. Thereafter, sections were incubated in blocking solution (Block Ace, Snow Brand Milk Products Co., Sapporo, Japan) for 2 hr. Tissue sections were incubated in rabbit anti-Fos primary antibody (1:5,000 dilution with 0.02 M PBS containing 1% BSA and 0.3% Triton X-100; Ab-5, Oncogene Research Product, Calbiochem, MA, U.S.A.) at 4°C for 60 hr, washed three times with 0.02 M PBS containing 0.03% Triton X-100 (0.03% PBST), and then, the sections were incubated with the biotinylated goat-anti-rabbit secondary antibody IgG (1:800 dilution with 0.02 M PBS containing 0.3% Triton X-100; Vector Laboratories, Burlingame, CA, U.S.A.) at room temperature for 2 hr. Sections were then rinsed three times with 0.03% PBST and incubated at room temperature for a further 2 hr with an avidin-biotin-horseradish peroxidase complex solution (Vectastain ABC Kit, Vector Laboratories). Finally, sections were treated for approximately 1.5 min in 0.5 mg/ml diaminobenzidine tetrahydrochloride (Sigma,; dissolved in 0.02 M PBS with 0.01% hydrogen peroxide and 0.25% nickel chloride). The sections were mounted on slides, air dried, dehydrated in ethanol solutions and xylene, and coverslipped.
Quantification of c-Fos immunoreactive cells: Brain regions were identified using the rat brain in stereotaxic coordinates [19]. The number of c-Fos-immunoreactive (IR) cells in the PVN and SON was counted using an Olympus Optical System (BX-51, Olympus Optical Co., Tokyo, Japan), and the digitized images were analyzed with IPLab image analyzing software (Scanalytics Corp., Fairfax, VA, U.S.A.). A threshold was set to delineate c-Fos-positive stained nuclei from background, and only cells above the threshold were included. Up to four sections per animal for each region were quantified bilaterally and then averaged.
Statistical analyses: All statistical analyses were performed in SPSS 11.5 Version (SPSS Inc., Chicago, IL, U.S.A.). Data were analyzed with two-way analysis of variance (ANOVA), followed by Tukey’s test. Differences at P<0.05 were considered statistically significant.
RESULTS
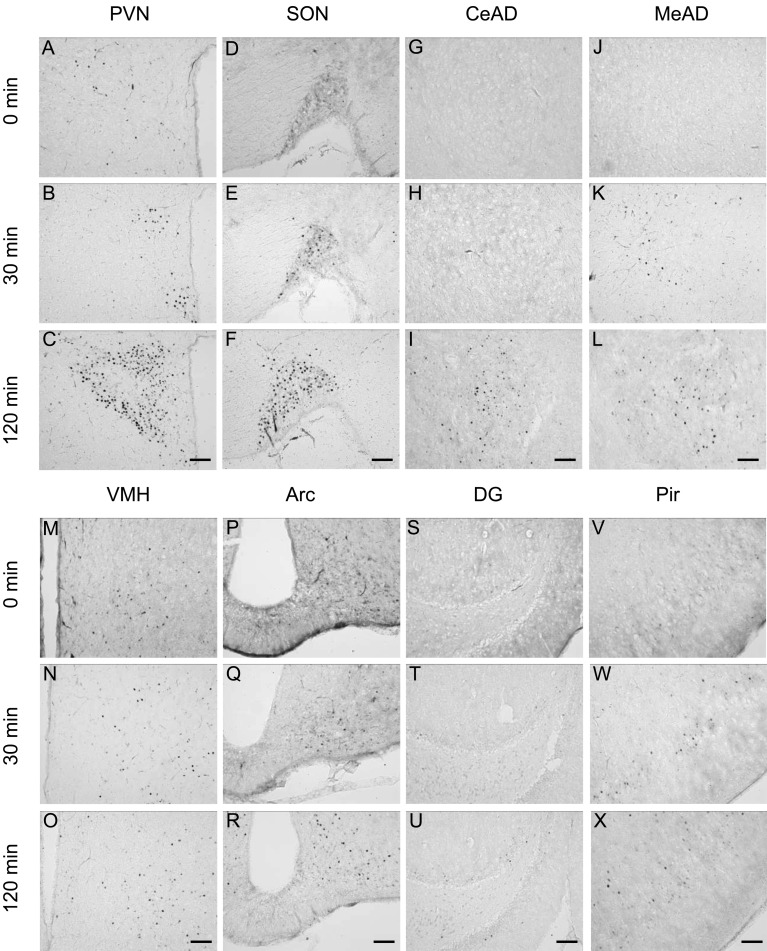
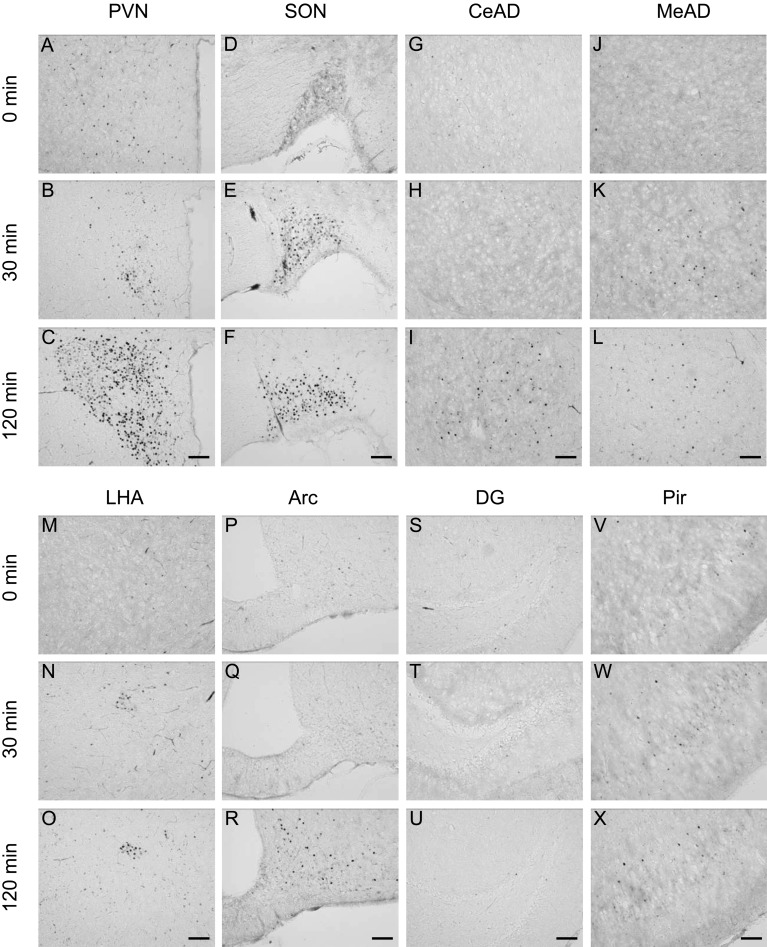
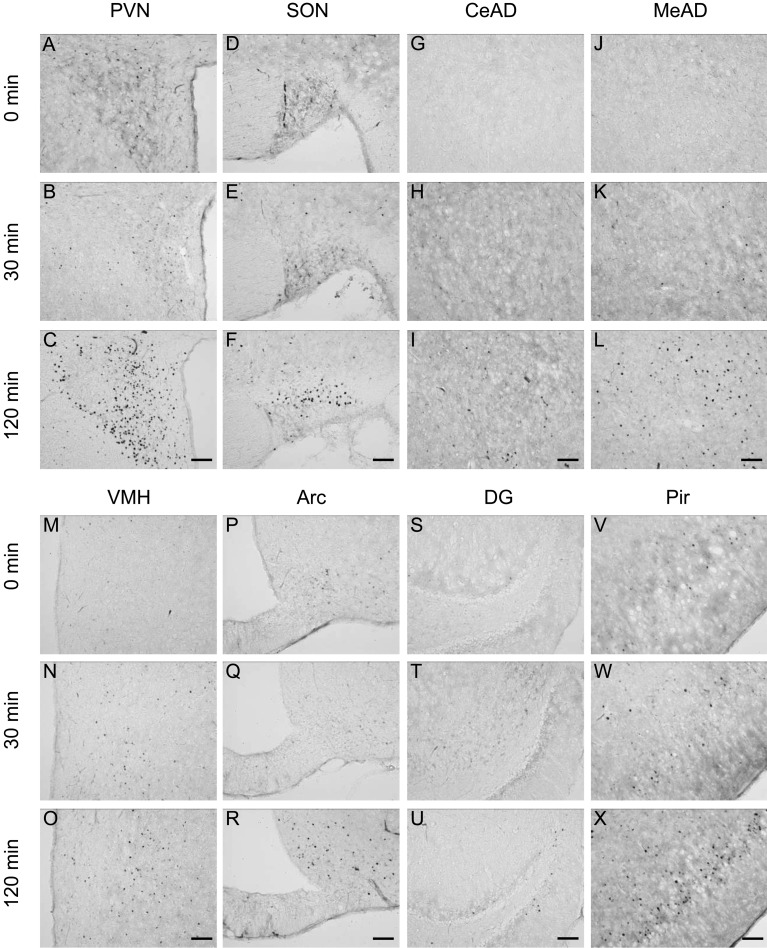
Induction of c-Fos expression in the brain under stress conditions: In order to determine the brain regions responding to acute stress stimuli, immunostaining for c-Fos protein in the forebrain was performed. Before the application of stresses (0 min), almost no c-Fos-immunoreactive (IR) cells were observed, while few scattered c-Fos-IR cells were seen in the paraventricular nucleus (PVN) and the supraoptic nucleus (SON). As shown in Figs. 1, 2, 3, stress stimuli induced c-Fos immunoreactivity in many brain regions. After 30 min of stress stimuli, there was a small increase in the number of c-Fos-IR cells in the PVN, SON, ventromedial hypothalamic nucleus (VMH) and piriform cortex (Pir) in the LPS and restraint stress models, while an increase in c-Fos-IR cell number was found in the PVN, SON and lateral hypothalamic area (LHA) in the 2DG stress model. Strong increases in c-Fos-IR cells were observed in the PVN and SON at 120 min after the application of all the three different acute stresses. Considerable increases in c-Fos-IR cell number were also seen in other brain regions, including the central amygdaloid nucleus, medial amygdaloid nucleus, arcuate nucleus, dentate gyrus and Pir. In addition, LPS and restraint stresses increased c-Fos-IR cells in the VMH, while 2DG injection increased those in the LHA at 120 min as well as 30 min. These results suggest that the two hypothalamic regions, the PVN and SON, have similar expression patterns of neuronal activation in response to all three different acute stresses applied in this study and that the VMH is sensitive to LPS and restraint stresses, while the LHA is sensitive to hypoglycemic stress.
Fig. 1.
Immunohistochemical staining for c-Fos protein in the brain 0, 30 and 120 min after LPS injection (100 µg/kg BW, ip). Representative photomicrographs of c-Fos-immunoreactive cells in the paraventricular nucleus (PVN, A–C), supraoptic nucleus (SON, D–F), central amygdaloid nucleus (CeAD, G–I), medial amygdaloid nucleus (MeAD, J–L), ventromedial hypothalamic nucleus (VMH, M–O), arcuate nucleus (Arc, P–R), dentate gyrus (DG, S–U) and piriform cortex (Pir, V–X). Scale bars: 100 µm.
Fig. 2.
Immunohistochemical staining for c-Fos protein in the brain 0, 30 and 120 min after 2DG injection (400 mg/kg BW, ip). Representative photomicrographs of c-Fos-immunoreactive cells in the paraventricular nucleus (PVN, A–C), supraoptic nucleus (SON, D–F), central amygdaloid nucleus (CeAD, G–I), medial amygdaloid nucleus (MeAD, J–L), lateral hypothalamic area (LHA, M–O), arcuate nucleus (Arc, P–R), dentate gyrus (DG, S–U) and piriform cortex (Pir, V–X). Scale bars: 100 µm.
Fig. 3.
Immunohistochemical staining for c-Fos protein in the brain 0, 30 and 120 min after restraint stress (1 hr). Representative photomicrographs of c-Fos-immunoreactive (c-Fos-IR) cells in the paraventricular nucleus (PVN, A–C), supraoptic nucleus (SON, D–F), central amygdaloid nucleus (CeAD, G–I), medial amygdaloid nucleus (MeAD, J–L), ventromedial hypothalamic nucleus (VMH, M–O), arcuate nucleus (Arc, P–R), dentate gyrus (DG, S–U) and piriform cortex (Pir, V–X). Scale bars: 100 µm.
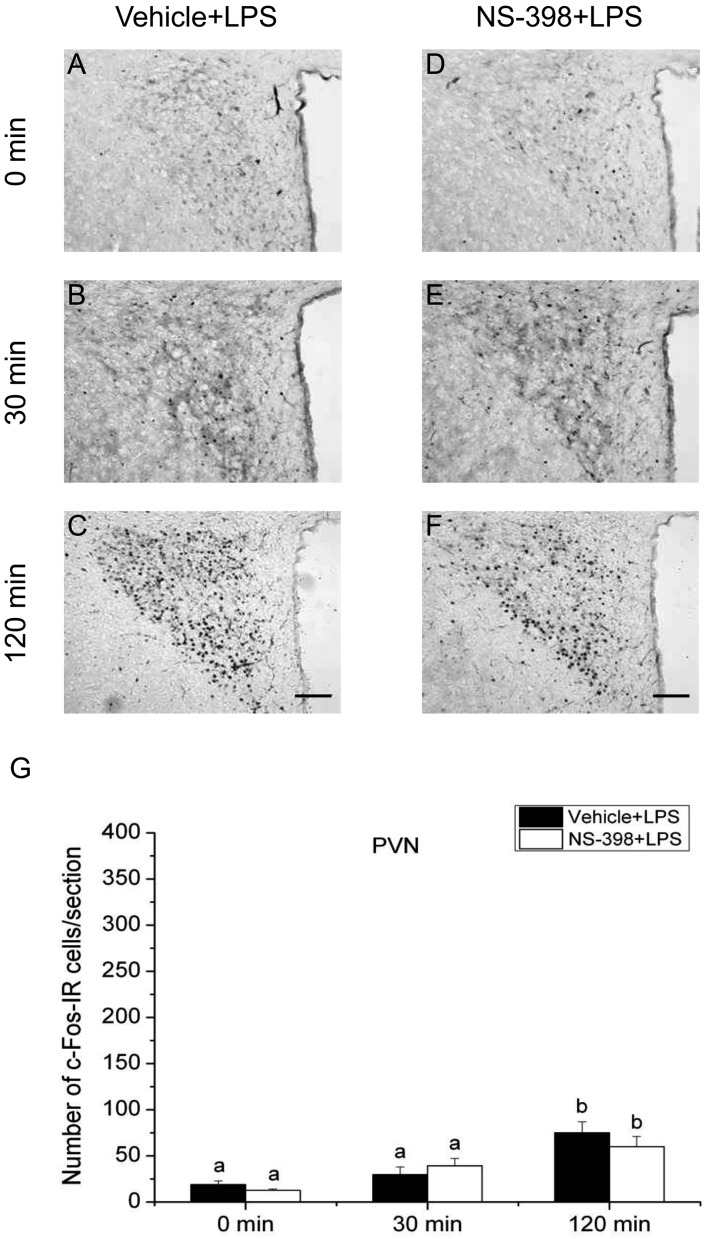
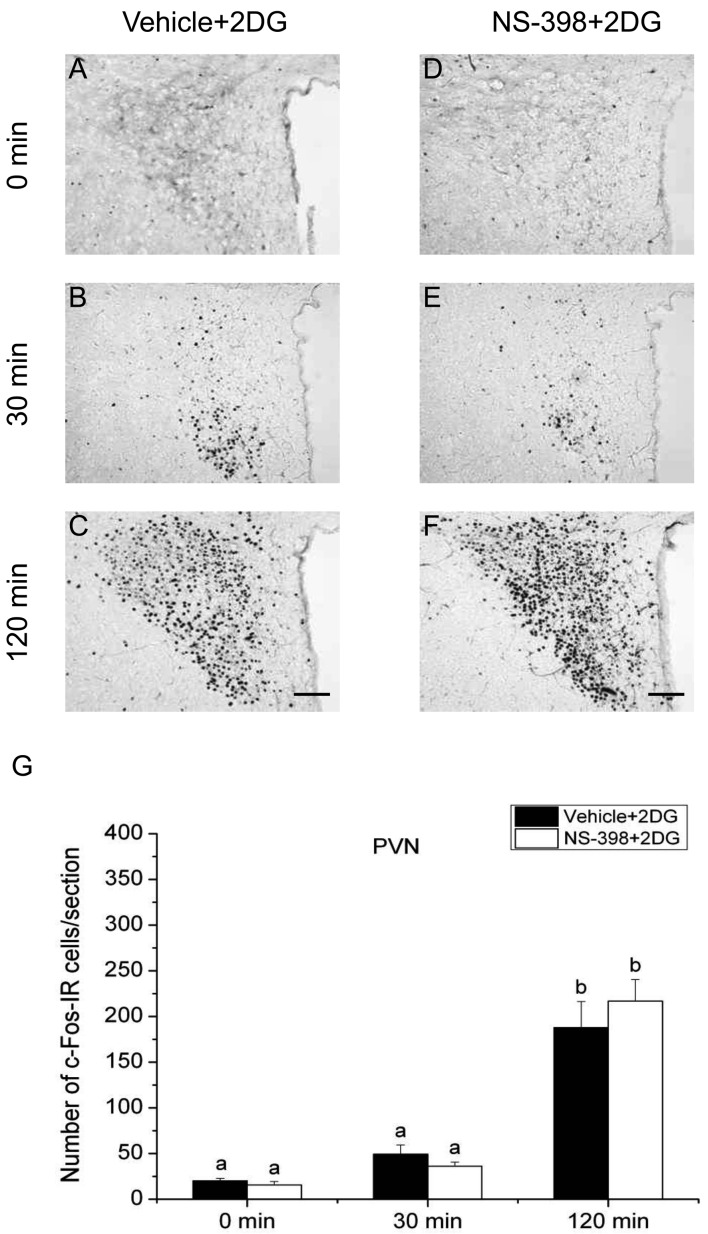
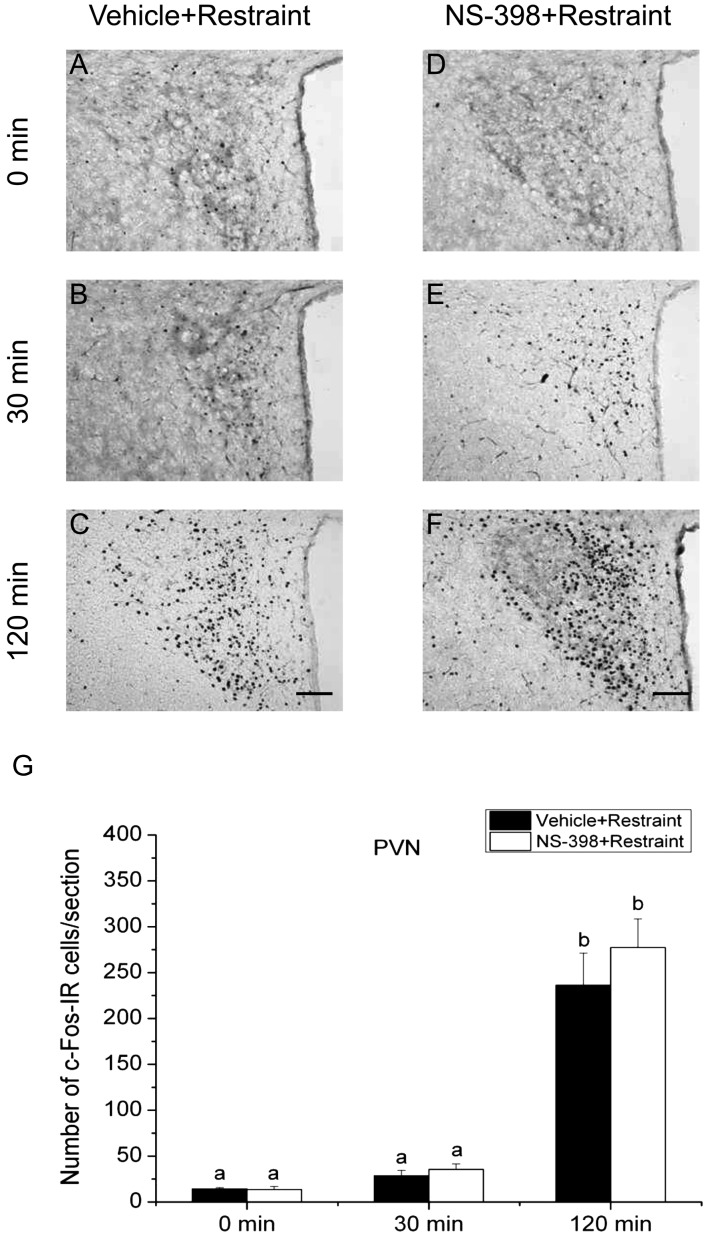
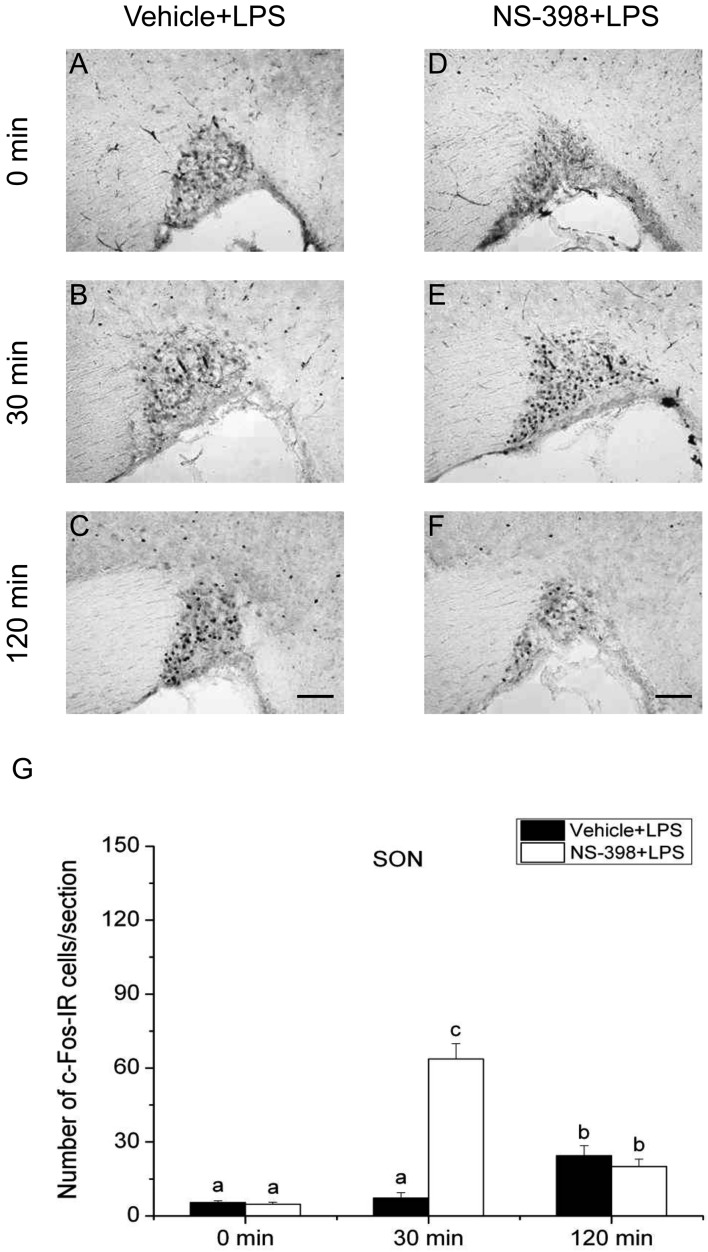
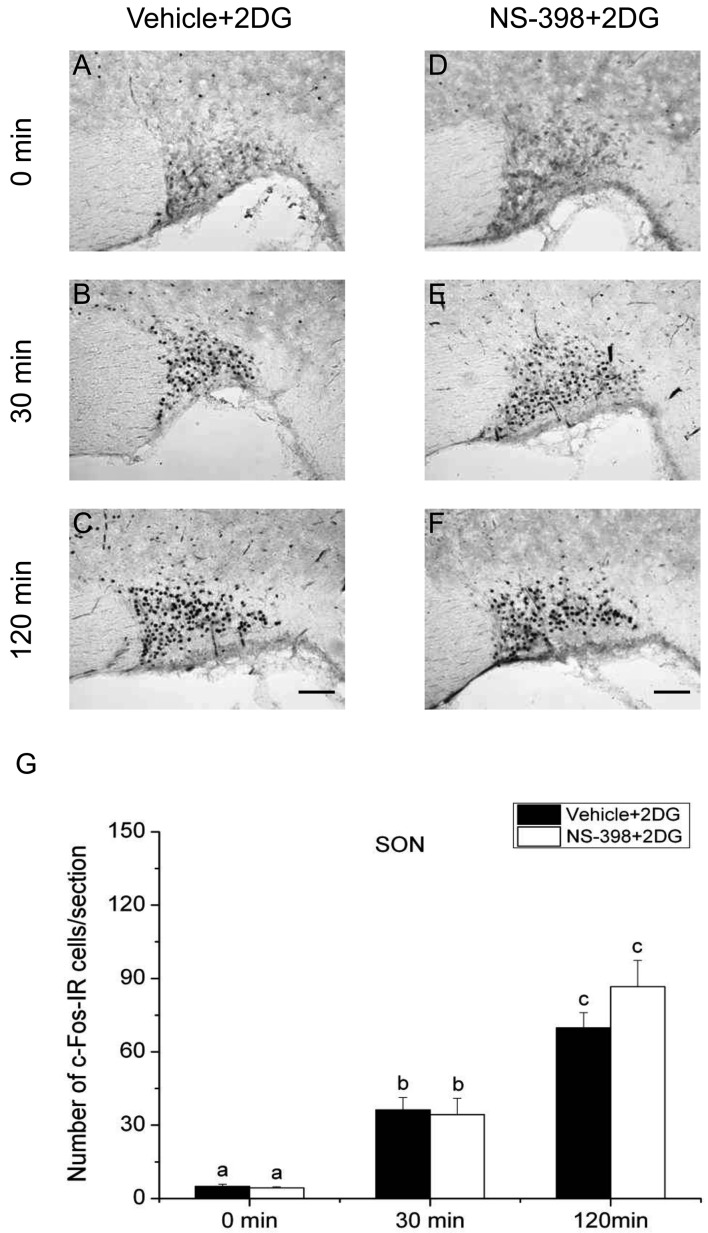
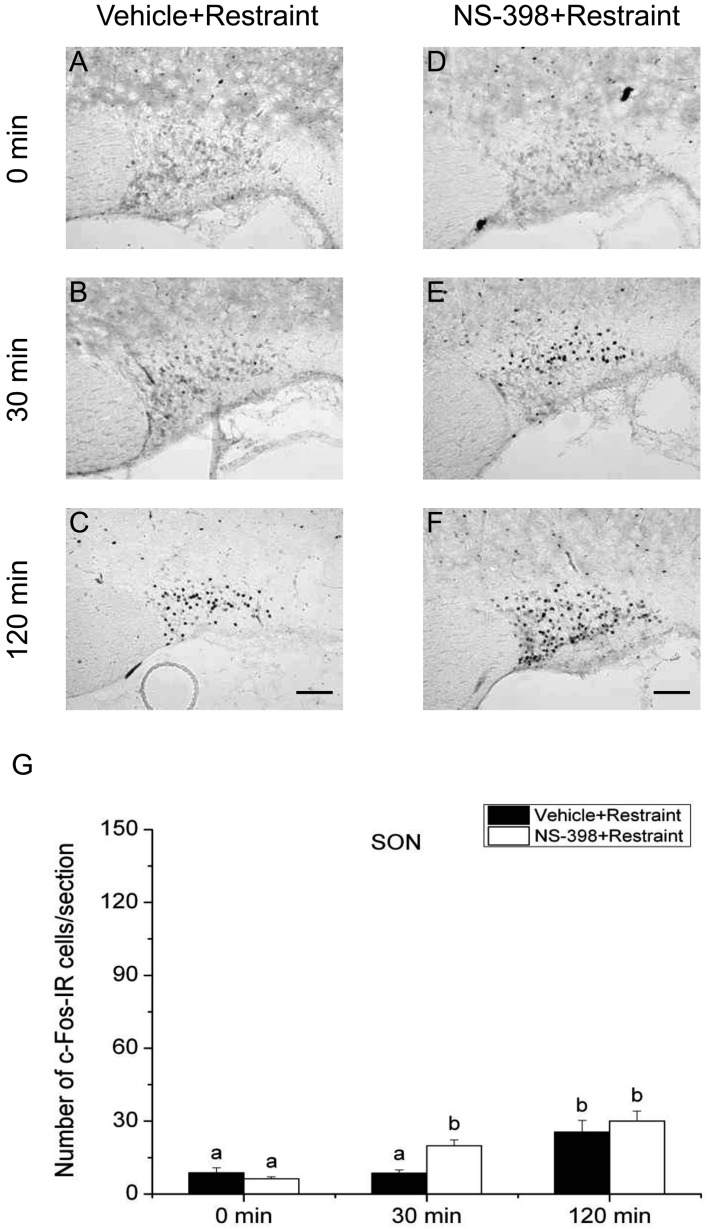
Effects of COX-2 inhibitor on the expression of c-Fos in the PVN and SON: To investigate the involvement of COX-2-related signaling in activation of the HPA axis responding to the acute stress stimuli, we evaluated the effect of COX-2 selective inhibitor NS-398 on the number of c-Fos-IR cells in the PVN and SON under the three different acute stress conditions. c-Fos expression in the PVN is shown in Figs. 4, 5, 6, and that in the SON is illustrated in Figs. 7, 8, 9. Quantitative analysis showed that the interaction of time and treatment significantly affected the number of c-Fos-IR cells in both the PVN [LPS, (F(2,24)=8.606, P<0.01); 2DG, (F(2,24)=9.865, P<0.001); restraint, (F(2,24)=6.938, P<0.01)] and SON [LPS, (F(2,24)=94.371, P<0.001; restraint, F(2,24)=6.522, P<0.01)], except for 2DG (F(2,24)=0.231, P>0.05). In the PVN of vehicle-injected animals, the numbers of c-Fos-IR cells at 120 min after stress stimuli were significantly larger than those of other 2 time points under all three acute stress conditions. There was no significant difference between the numbers of c-Fos-IR cells in the PVN in vehicle- and NS-398-treated rats at any time points under three different stress conditions. These results suggest that all three acute stress conditions induce the neuronal activation in the PVN and COX-2-related signaling does not affect the total number of neurons activated in this nucleus.
Fig. 4.
Effect of COX-2 selective inhibitor NS-398 on the expression of c-Fos protein in the paraventricular nucleus (PVN) after LPS injection. Vehicle (A–C) or COX-2 selective inhibitor NS-398 (10 mg/kg BW, ip, D–F) was injected to male rats 30 min before applying LPS (100 µg/kg BW, ip). Scale bars: 100 µm. Quantification of the number of c-Fos-IR cells in the PVN of vehicle-treated (closed column) or NS-398-treated (open column) rats after an injection of LPS (G). Each column with a vertical bar represents the mean ± SEM (n=5). Values with different letters are significantly different (P<0.05, two-way ANOVA followed by Tukey’s test).
Fig. 5.
Effect of COX-2 selective inhibitor NS-398 on the expression of c-Fos protein in the paraventricular nucleus (PVN) after 2DG injection. Vehicle (A–C) or COX-2 selective inhibitor NS-398 (10 mg/kg BW, ip, D–F) was injected to male rats 30 min before applying 2DG (400 mg/kg BW, ip). Scale bars: 100 µm. Quantification of the number of c-Fos-IR cells in the PVN of vehicle-treated (closed column) or NS-398-treated (open column) rats after an injection of 2DG (G). Each column with a vertical bar represents the mean ± SEM (n=5). Values with different letters are significantly different (P<0.05, two-way ANOVA followed by Tukey’s test).
Fig. 6.
Effect of COX-2 selective inhibitor NS-398 on the expression of c-Fos protein in the paraventricular nucleus (PVN) after restraint stress. Vehicle (A–C) or COX-2 selective inhibitor NS-398 (10 mg/kg BW, ip, D–F) was injected to male intact rats 30 min before applying restraint (1 hr) stress. Scale bars: 100 µm. Quantification of the number of c-Fos-IR cells in the PVN of vehicle-treated (closed column) or NS-398-treated (open column) rats after restraint stress. Each column with a vertical bar represents the mean ± SEM (n=5). Values with different letters are significantly different (P<0.05, two-way ANOVA followed by Tukey’s test).
Fig. 7.
Effect of COX-2 selective inhibitor NS-398 on the expression of c-Fos protein in the supraoptic nucleus (SON) after LPS injection. Vehicle (A–C) or COX-2 selective inhibitor NS-398 (10 mg/kg BW, ip, D–F) was injected to male intact rats 30 min before applying LPS (100 µg/kg BW, ip). Scale bars: 100 µm. Quantification of the number of c-Fos-IR cells in the SON of vehicle-treated (closed column) or NS-398-treated (open column) rats after an injection of LPS (G). Each column with a vertical bar represents the mean ± SEM (n=5). Values with different letters are significantly different (P<0.05, two-way ANOVA followed by Tukey’s test).
Fig. 8.
Effect of COX-2 selective inhibitor NS-398 on the expression of c-Fos protein in the supraoptic nucleus (SON) after 2DG injection. Vehicle (A–C) or COX-2 selective inhibitor NS-398 (10 mg/kg BW, ip, D–F) was injected to male intact rats 30 min before applying 2DG (400 mg/kg BW, ip). Scale bars: 100 µm. Quantification of the number of c-Fos-IR cells in the SON of vehicle-treated (closed column) or NS-398-treated (open column) rats after an injection of 2DG (G). Each column with a vertical bar represents the mean ± SEM (n=5). Values with different letters are significantly different (P<0.05, two-way ANOVA followed by Tukey’s test).
Fig. 9.
Effect of COX-2 selective inhibitor NS-398 on the expression of c-Fos protein in the supraoptic nucleus (SON) after restraint stress. Vehicle (A–C) or COX-2 selective inhibitor NS-398 (10 mg/kg BW, ip, D–F) was injected to male intact rats 30 min before applying restraint (1 hr) stress. Scale bars: 100 µm. Quantification of the number of c-Fos-IR cells in the SON of vehicle-treated (closed column) or NS-398-treated (open column) rats after restraint stress (G). Each column with a vertical bar represents the mean ± SEM (n=5). Values with different letters are significantly different (P<0.05, two-way ANOVA followed by Tukey’s test).
On the other hand, the number of c-Fos-IR cells in the SON of vehicle-injected animals was significantly larger at 30 min compared with that at 0 min only in 2DG-injected animals, but not in LPS-injected or restraint-stressed ones. The number of c-Fos-IR cells in the SON at 120 min was significantly larger than those of other 2 time points under all three acute stress conditions. Treatment with NS-398 significantly increased the number of c-Fos-IR cells at 30 min, but not at 0 and 120 min, under both LPS and restraint stresses, while the effect of NS-398 was not discernible under 2DG stress at any time points. These results suggest that all the three different acute stresses induce the neuronal activation of the SON, on which COX-2-related signaling has a negative effect at least at 30 min under infectious and restraint stress conditions, but not under hypoglycemic stress condition.
DISCUSSION
The present study showed that all the three acute stresses applied, namely infectious, hypoglycemic and restraint stresses, induced neuronal activation in some restricted populations of neurons in the brain, especially in the PVN and SON. In addition, activation of the SON was significantly enhanced by COX-2 inhibitor under the infectious and restraint stress conditions, but not under the hypoglycemic stress condition. These results appear to have some relationship with the data of our previous study, which suggests that activation of the HPA axis is dependent on COX-2-related signaling under infectious and restraint stresses, but less dependent on it under hypoglycemic stress [15].
In the parvocellular region of the PVN, there is a population of neuropeptide-secretory neurons synthesizing corticotrophin-releasing hormone (CRH) or both CRH and arginine vasopressin (AVP) [3, 27], while AVP and oxytocin (OXT) neurons are mainly located in the magnocellular regions of the PVN and SON [11, 12]. A previous research showed that acute stresses increased c-Fos-IR cells, which were mainly colocalized with CRH-IR perikarya in the PVN [20]. In addition, c-Fos-IR nuclei were also increased in both AVP- and OXT-containing neurons of the PVN and SON after acute stresses [16, 20, 32]. The present study demonstrated that many regions of the brain respond to acute stresses and especially, the PVN and SON have similar expression patterns of neuronal activation in response to three different acute stresses, which are consistent with these previous reports. It is well known that CRH and AVP play a key role in mediating activation of the HPA axis [18, 21], while some researches suggested that intracerebroventricular infusion of OXT suppresses stress-induced activation of the HPA axis [28, 29]. In the present study, there was no significant difference between the number of c-Fos-IR cells in the PVN between vehicle-injected and NS-398-treated animals at any time points under three different acute stress conditions, suggesting that COX-2-related signaling is not directly involved in stress responses in the PVN. This is consistent with a previous report showing that COX-2- or mPGES-1-deficient mice did not show any attenuation of the c-Fos expression in the PVN after LPS administration [7], though the other research group reported that LPS strongly reduced the number of c-Fos positive nuclei in the PVN in mPGES-1-deficient mice [4]. As to the SON, on the other hand, the numbers of c-Fos-IR cells in NS-398-treated animals were significantly higher than those in vehicle-injected animals at 30 min under LPS and restraint stresses, but not under 2DG stress condition. Lacroix et al. [14] reported that injection of PGE2 induced c-Fos expression in the PVN and SON. In the parvocellular division of the PVN, c-Fos was mainly expressed in CRH- and OXT-IR neurons and very rarely expressed in AVP-IR neurons, while in the magnocellular part of the PVN and SON, c-Fos was mainly colocalized in OXT-IR neurons and some expression was also detected in AVP-IR neurons. It is therefore likely that, in the present study, c-Fos-IR neurons in the PVN are mainly CRH and OXT neurons, and those in the SON are mainly OXT neurons. Taken together, it is suggested that, in the SON, NS-398 increased the number of OXT neurons expressing c-Fos and thereby decreased serum corticosterone levels under infectious and restraint stress conditions as observed in our previous study [15]. This may at least partially account for the differences in COX-2-dependency of the activation of the HPA axis among stresses.
Interestingly, in the present study, infectious and restraint stresses increased c-Fos expression levels in the VMH, while hypoglycemic stress increased those in the LHA, which are consistent with previous researches reported separately [1, 2, 10, 22]. Bilateral electrolytic lesions of the VMH or LHA were reported to inhibit corticosteroid feedback or extinguish the role of serotonin (5-HT) on activity in the HPA axis [25]. In addition, involvement of the VMH and LHA in the regulation of energy metabolism has been well documented [30]. The VMH and the LHA have been regarded as the ‘satiety center’ and ‘hunger center’, respectively [23]. Infectious stress is known to induce anorexic symptoms, in which condition the satiety center should be activated, while 2DG as an inhibitor of glucose uptake would stimulate the hunger center. Taken together, these results suggest that infectious and restraint stresses or hypoglycemic stress differently activates neurons in the VMH or LHA mediating the regulation of not only the HPA axis activity but also food intake.
In conclusion, the present study demonstrated that many regions of the brain, especially the PVN and SON, respond to acute stresses and work as common mediators that generate potent autonomic and neuroendocrine responses. In addition, it is also suggested that COX-2-related signaling decreases neuronal activity in the SON under infectious and restraint, but not hypoglycemic, stresses, which may be involved in the suppression of the HPA axis. This difference in the role of COX-2-related signaling in inhibiting SON neurons among stresses may at least partially account for the difference in the role of COX-2-related signaling in activating the HPA axis among stresses observed in our previous study [15].
ACKNOWLEDGMENTS
This work was supported in part by JSPS KAKENHI Grant Number 23228004 and 22780260.
REFERENCES
- 1.Abizaid A., Woodside B.2002. Food intake and neuronal activation after acute 2DG treatment are attenuated during lactation. Physiol. Behav. 75: 483–491. doi: 10.1016/S0031-9384(02)00658-3 [DOI] [PubMed] [Google Scholar]
- 2.Chagra S. L., Zavala J. K., Hall M. V., Gosselink K. L.2011. Acute and repeated restraint differentially activate orexigenic pathways in the rat hypothalamus. Regul. Pept. 167: 70–78. doi: 10.1016/j.regpep.2010.11.006 [DOI] [PMC free article] [PubMed] [Google Scholar]
- 3.Charmandari E., Tsigos C., Chrousos G.2005. Endocrinology of the stress response. Annu. Rev. Physiol. 67: 259–284. doi: 10.1146/annurev.physiol.67.040403.120816 [DOI] [PubMed] [Google Scholar]
- 4.Dallaporta M., Pecchi E., Jacques C., Berenbaum F., Jean A., Thirion S., Troadec J. D.2007. c-Fos immunoreactivity induced by intraperitoneal LPS administration is reduced in the brain of mice lacking the microsomal prostaglandin E synthase-1 (mPGES-1). Brain Behav. Immun. 21: 1109–1121. doi: 10.1016/j.bbi.2007.05.003 [DOI] [PubMed] [Google Scholar]
- 5.Dragunow M., Faull R.1989. The use of c-fos as a metabolic marker in neuronal pathway tracing. J. Neurosci. Methods 29: 261–265. doi: 10.1016/0165-0270(89)90150-7 [DOI] [PubMed] [Google Scholar]
- 6.Dubois R. N., Abramson S. B., Crofford L., Gupta R. A., Simon L. S., Van De Putte L. B., Lipsky P. E. 1998. Cyclooxygenase in biology and disease. FASEB J. 12: 1063–1073 [PubMed] [Google Scholar]
- 7.Elander L., Engström L., Ruud J., Mackerlova L., Jakobsson P. J., Engblom D., Nilsberth C., Blomqvist A.2009. Inducible prostaglandin E2 synthesis interacts in a temporally supplementary sequence with constitutive prostaglandin-synthesizing enzymes in creating the hypothalamic-pituitary-adrenal axis response to immune challenge. J. Neurosci. 29: 1404–1413. doi: 10.1523/JNEUROSCI.5247-08.2009 [DOI] [PMC free article] [PubMed] [Google Scholar]
- 8.Elander L., Ruud J., Korotkova M., Jakobsson P. J., Blomqvist A.2010. Cyclooxygenase-1 mediates the immediate corticosterone response to peripheral immune challenge induced by lipopolysaccharide. Neurosci. Lett. 470: 10–12. doi: 10.1016/j.neulet.2009.12.036 [DOI] [PubMed] [Google Scholar]
- 9.García-Bueno B., Serrats J., Sawchenko P. E.2009. Cerebrovascular cyclooxygenase-1 expression, regulation, and role in hypothalamic-pituitary-adrenal axis activation by inflammatory stimuli. J. Neurosci. 29: 12970–12981. doi: 10.1523/JNEUROSCI.2373-09.2009 [DOI] [PMC free article] [PubMed] [Google Scholar]
- 10.Gavrilov Y. V., Perekrest S. V., Novikova N. S., Korneva E. A.2008. Stress-induced changes in cellular responses in hypothalamic structures to administration of an antigen (lipopolysaccharide) (in terms of c-Fos protein expression). Neurosci. Behav. Physiol. 38: 189–194. doi: 10.1007/s11055-008-0028-9 [DOI] [PubMed] [Google Scholar]
- 11.Gibbs D. M.1986. Vasopressin and oxytocin: hypothalamic modulators of the stress response: a review. Psychoneuroendocrinology 11: 131–139. doi: 10.1016/0306-4530(86)90048-X [DOI] [PubMed] [Google Scholar]
- 12.Gimpl G., Fahrenholz F.2001. The oxytocin receptor system: structure, function, and regulation. Physiol. Rev. 81: 629–683 [DOI] [PubMed] [Google Scholar]
- 13.Kudo I., Murakami M.2005. Prostaglandin E synthase, a terminal enzyme for prostaglandin E2 biosynthesis. J. Biochem. Mol. Biol. 38: 633–638. doi: 10.5483/BMBRep.2005.38.6.633 [DOI] [PubMed] [Google Scholar]
- 14.Lacroix S., Valliéres L., Rivest S.1996. C-fos mRNA pattern and corticotropin-releasing factor neuronal activity throughout the brain of rats injected centrally with a prostaglandin of E2 type. J. Neuroimmunol. 70: 163–179. doi: 10.1016/S0165-5728(96)00114-2 [DOI] [PubMed] [Google Scholar]
- 15.Ma Y., Matsuwaki T., Yamanouchi K., Nishihara M.2013. Cyclooxygenase-2-related signaling in the hypothalamus plays differential roles in response to various acute stresses. Brain Res. 1508: 23–33. doi: 10.1016/j.brainres.2013.02.042 [DOI] [PubMed] [Google Scholar]
- 16.Matsunaga W., Miyata S., Takamata A., Bun H., Nakashima T., Kiyohara T.2000. LPS-induced Fos expression in oxytocin and vasopressin neurons of the rat hypothalamus. Brain Res. 858: 9–18. doi: 10.1016/S0006-8993(99)02418-X [DOI] [PubMed] [Google Scholar]
- 17.Morgan J. I., Curran T.1991. Stimulus-transcription coupling in the nervous system: involvement of the inducible proto-oncogenes fos and jun. Annu. Rev. Neurosci. 14: 421–451. doi: 10.1146/annurev.ne.14.030191.002225 [DOI] [PubMed] [Google Scholar]
- 18.Ogilvie K. M., Lee S., Rivier C.1997. Role of arginine vasopressin and corticotropin-releasing factor in mediating alcohol-induced adrenocorticotropin and vasopressin secretion in male rats bearing lesions of the paraventricular nuclei. Brain Res. 744: 83–95. doi: 10.1016/S0006-8993(96)01082-7 [DOI] [PubMed] [Google Scholar]
- 19.Paxinos G., Watson C.1986. The Rat Brain in Stereotaxic Coordinates, 2nd ed., Academic Press, San Diego. [Google Scholar]
- 20.Rivest S., Laflamme N.1995. Neuronal activity and neuropeptide gene transcription in the brains of immune-challenged rats. J. Neuroendocrinol. 7: 501–525. doi: 10.1111/j.1365-2826.1995.tb00788.x [DOI] [PubMed] [Google Scholar]
- 21.Rivier C., Vale W.1983. Modulation of stress-induced ACTH release by corticotropin-releasing factor, catecholamines and vasopressin. Nature 305: 325–327. doi: 10.1038/305325a0 [DOI] [PubMed] [Google Scholar]
- 22.Salter-Venzon D., Watts A. G.2008. The role of hypothalamic ingestive behavior controllers in generating dehydration anorexia: a Fos mapping study. Am. J. Physiol. Regul. Integr. Comp. Physiol. 295: R1009–R1019. doi: 10.1152/ajpregu.90425.2008 [DOI] [PMC free article] [PubMed] [Google Scholar]
- 23.Schwartz M. W., Woods S. C., Porte D., Jr, Seeley R. J., Baskin D. G.2000. Central nervous system control of food intake. Nature 404: 661–671 [DOI] [PubMed] [Google Scholar]
- 24.Smith W. L., DeWitt D. L., Garavito R. M.2000. Cyclooxygenases: structural, cellular, and molecular biology. Annu. Rev. Biochem. 69: 145–182. doi: 10.1146/annurev.biochem.69.1.145 [DOI] [PubMed] [Google Scholar]
- 25.Suemaru S., Darlington D. N., Akana S. F., Cascio C. S., Dallman M. F.1995. Ventromedial hypothalamic lesions inhibit corticosteroid feedback regulation of basal ACTH during the trough of the circadian rhythm. Neuroendocrinology 61: 453–463. doi: 10.1159/000126868 [DOI] [PubMed] [Google Scholar]
- 26.Tsigos C., Chrousos G. P.2002. Hypothalamic-pituitary-adrenal axis, neuroendocrine factors and stress. J. Psychosom. Res. 53: 865–871. doi: 10.1016/S0022-3999(02)00429-4 [DOI] [PubMed] [Google Scholar]
- 27.Vale W., Spiess S., Rivier C., Rivier J.1981. Characterization of a 41-residue ovine hypothalamic peptide that stimulates secretion of corticotrophin an β-endorphin. Science 213: 1394–1397. doi: 10.1126/science.6267699 [DOI] [PubMed] [Google Scholar]
- 28.Windle R. J., Shanks N., Lightman S. L., Ingram C. D.1997. Central oxytocin administration reduces stress-induced corticosterone release and anxiety behavior in rats. Endocrinology 138: 2829–2834. doi: 10.1210/en.138.7.2829 [DOI] [PubMed] [Google Scholar]
- 29.Windle R. J., Kershaw Y. M., Shanks N., Wood S. A., Lightman S. L., Ingram C. D.2004. Oxytocin attenuates stress-induced c-fos mRNA expression in specific forebrain regions associated with modulation of hypothalamo-pituitary-adrenal activity. J. Neurosci. 24: 2974–2982. doi: 10.1523/JNEUROSCI.3432-03.2004 [DOI] [PMC free article] [PubMed] [Google Scholar]
- 30.Wolfgang M. J., Lane M. D.2006. Control of energy homeostasis: role of enzymes and intermediates of fatty acid metabolism in the central nervous system. Annu. Rev. Nutr. 26: 23–44. doi: 10.1146/annurev.nutr.25.050304.092532 [DOI] [PubMed] [Google Scholar]
- 31.Yamaguchi N., Ogawa S., Okada S.2010. Cyclooxygenase and nitric oxide synthase in the presympathetic neurons in the paraventricular hypothalamic nucleus are involved in restraint stress-induced sympathetic activation in rats. Neuroscience 170: 773–781. doi: 10.1016/j.neuroscience.2010.07.051 [DOI] [PubMed] [Google Scholar]
- 32.Zhao D. Q., Ai H. B.2011. Oxytocin and vasopressin involved in restraint water-immersion stress mediated by oxytocin receptor and vasopressin 1b receptor in rat brain. PLoS One 6: e23362. doi: 10.1371/journal.pone.0023362 [DOI] [PMC free article] [PubMed] [Google Scholar]


