

Abstract
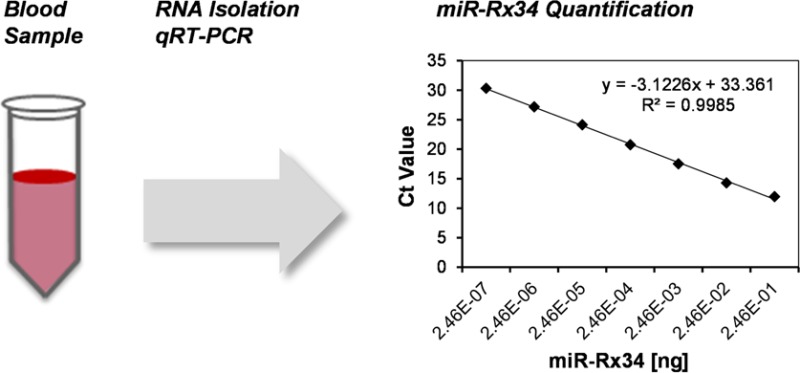
MRX34, a microRNA (miRNA)-based therapy for cancer, has recently entered clinical trials as the first clinical candidate in its class. It is a liposomal nanoparticle loaded with a synthetic mimic of the tumor suppressor miRNA miR-34a as the active pharmaceutical ingredient. To understand the pharmacokinetic properties of the drug and to rationalize an optimal dosing regimen in the clinic, a method is needed to quantitatively detect the miRNA mimic. Here, we report the development and qualification of a quantitative reverse transcription-polymerase chain reaction (qRT-PCR) assay in support of pharmacokinetic and toxicokinetic assessments in the nonhuman primate. Detection and quantification were performed on total ribonucleic acid (RNA) isolated from whole blood. The qualified range of the standard curve spans 6 orders of magnitude from 2.5 × 10⁻⁷ to 2.5 × 10⁻¹ ng per reverse transcription (RT) reaction, corresponding to an estimated blood concentration from 6.2 × 10⁻⁵ to 6.2 × 101 ng/mL. Our results demonstrate that endogenous as well as the exogenous miR-34a can be accurately and precisely quantified. The assay was used to establish the pharmacokinetic profile of MRX34, showing a favorable residence time and exposure of the miRNA mimic in whole blood from nonhuman primates.
The use of synthetic microRNA (miRNA) mimics is a new paradigm to treat cancer. These mimics replace the function of natural tumor suppressor miRNAs that are frequently lost or expressed at reduced levels in tumor tissues.1,2 miR-34a is the first in its class and has recently entered clinical testing.3 The therapeutic formulation, MRX34, is a liposomal nanoparticle (SMARTICLES) with a diameter of approximately 120 nm.4 Its cargo, miR-Rx34, is a doublestranded oligonucleotide as the active pharmaceutical ingredient (API), whereby the active strand is identical to human miR-34a. In preclinical animal models, systemic administration of MRX34 inhibited the growth of primary tumors, blocked metastasis, and extended survival.5
To characterize the pharmacokinetic properties of MRX34, a bioanalytical method is required to accurately measure drug concentrations. Several methods have been developed to detect short oligonucleotides such as siRNAs, miRNAs, and locked nucleic acid (LNA) antisense oligonucleotides. These include hybridization assays,6 liquid chromatography–tandem mass spectrometry (LC–MS/MS),7 primer extension quantitative polymerase chain reaction (PCR),8 and various methods based on quantitative reverse-transcription PCR (qRT-PCR).9−11 Several of these methods have been used during the preclinical development of oligotherapeutics; however, an application for miRNA mimics that is suitable for use in an IND program remains absent. Since the active strand of our API is indistinguishable from the endogenous molecule, we sought to employ a method that is (i) sufficiently sensitive to detect miR-34a present at these low, endogenous levels and (ii) has a large dynamic range to accurately quantify the exogenous miR-34a mimic. The quantification of both miR-34a species is necessary to characterize the pharmacokinetic behavior of miR-Rx34.
Here, we describe the qualification of an RNA isolation procedure and a miR-34a-specific stem-loop qRT-PCR assay that was expected to meet the sensitivity and limits of quantitation necessary to support a development program.12 Experimental conditions of the qRT-PCR method were altered to improve the slope and to reduce the noise of the assay. The method involved isolation of total RNA from nonhuman primate blood followed by TaqMan probe-based qRT-PCR detection. Our data show that the RNA isolation method provides consistent recovery of high-quality RNA and can be used to extract miR-Rx34 from fresh blood lysates and lysates stored for up to 45 days at −20 °C. The qRT-PCR method was assessed for the following parameters: range of response, lower and upper limits of quantitation, precision, accuracy, and specificity. The qualified range of the miR-34a qRT-PCR assay spans 6 orders of magnitude, ranging from 2.5 × 10⁻⁷ to 2.5 × 10⁻¹ ng per RT reaction, which corresponds to an estimated blood concentration from 6.2 × 10⁻⁵ to 6.2 × 101 ng/mL. The lower limit of quantitation (LLOQ) was approximately 2 orders of magnitude below the average levels of endogenous miR-34a. Samples containing miR-34a concentrations above the upper limit of quantitation (ULOQ) are diluted accordingly to bring concentrations into the qualified range of the assay. Thus, the assay was deemed suitable for the quantification of endogenous and exogenous miR-34a. The assay provided good specificity with a 0% false-positive rate across the qualified range of the standard curve and above the LLOQ. The method was used to determine the pharmacokinetic profile of MRX34 in nonhuman primates after a single intravenous injection of MRX34 at a dose level of 1 mg/kg.
Materials and Methods
Materials and Reagents
MRX34 is a doublestranded 23-mer mimic of miR-34a (miR-Rx34; MW = 14833.95) encapsulated in a liposomal nanoparticle with an average diameter of 120 nm. The liposome comprises the four lipids POPC, DOPE, CHEMS, and MOCHOL. miR-Rx34 was manufactured by Girindus (Hannover, Germany), and the final MRX34 formulation was prepared by Polymun Scientific (Vienna, Austria) as a 1 mg/mL stock solution in 5% sucrose buffer. Synthetic mimics of miR-34c (miR-Rx34c, MW = 14213) were purchased from Lifetech (Grand Island, NY). Naked miR-Rx34 and miR-Rx34c were used as reference standards and prepared in sterile, nuclease-free water containing 5 ng/μL yeast tRNA (Ambion, Austin, TX).
Equipment
Total RNA yield was determined by absorbance measurement (A260) on the Nanodrop ND-1000 UV spectrometer (Thermo Scientific, Wilmington, DE). All blood samples produced RNA concentrations above the lower detection limit of 2 ng/μL of the NanoDrop instrument. RNA integrity was determined by the Agilent Bioanalyzer utilizing RNA 6000 chips (Agilent, Santa Clara, CA). All PCR runs were performed using the ABI 7900HT SDS (Applied Biosystems, Foster City, CA), and RT reactions were performed using the GeneAmp PCR System 9700 (Applied Biosystems). Capillary gel electrophoresis was done using the Bioanalyzer 2100 instrument (Agilent).
Blood Samples
Whole blood samples from nonhuman primates were obtained from Charles River Laboratories, Preclinical Services (Reno, NV). Blood samples were pooled and divided into 400 μL aliquots to determine qualification specifications of the RNA isolation procedure. For the determination of endogenous miR-34a levels, 175 μL of whole blood from six nonhuman primates were used. Each animal was drawn twice to yield a total of 12 samples.
To establish the pharmacokinetic profile of MRX34, one male and two female nonhuman primates (Macaca fascicularis) was administered MRX34 at a dose level of 1 mg/kg (N = 3/group) via a slow, intravenous bolus injection. Blood samples were taken prior to dosing (predose) and at intervals after dosing as follows: 1, 7.5, 15, 45, 90, 180, 360, 720, and 1440 min postdose. Samples were immediately transferred into an equal volume of RNA isolation buffer and stored frozen at −20 °C until further analysis.
RNA Isolation Procedure
Total RNA from whole blood was isolated using the mirVANA PARIS RNA isolation kit (Ambion) following the manufacturer’s instructions. Briefly, 400 μL of blood lysate (200 μL whole blood + 200 μL RNA isolation buffer) was combined with an equal volume of acid–phenol, vortexed, and centrifuged at 13200g for 15 min. One half of the aqueous phase was transferred to a fresh tube and vortexed with 1.25 × volume of 100% ethanol. Then, samples were applied to glass fiber filter columns and centrifuged for 30 s followed by application of washing buffers provided by the kit and according to the manufacturer’s instructions. A volume of 50 μL of heated (95 °C), nuclease-free water was used to elute the RNA from the column.
miR-34a qRT-PCR Assay
For the detection and quantification of miRNA by qRT-PCR, we developed a novel protocol that uses commercially available reagents. In order to fall within the dynamic range of the standard curve, whole blood total RNA eluent was diluted 1:10–1:100000 for spike-in isolation recovery studies. The diluted RNA, RT primer and water was heat-denatured at 90 °C for 1 min and then cooled to 4 °C. After this initial heat-denaturing step, the remaining RT reagents were added and the RNA was converted to cDNA using MMLV-RT (Invitrogen) under the following conditions: 4 °C for 15 min, 16 °C for 30 min, 42 °C for 30 min, and 85 °C for 5 min. TaqMan microRNA assays were used for expression analysis of hsa-miR-34a and hsa-miR-24 (Applied Biosystems, Foster City, CA). Following cDNA synthesis, qPCR was performed on 2 μL of cDNA on the ABI Prism 7900HT SDS (Applied Biosystems) using Platinum Taq Polymerase (Invitrogen) under the following cycling conditions: 95 °C for 1 min (initial denature) and then 50 cycles of 95 °C for 5 s and 60 °C for 30 s. Additions to the manufacturers’ reagents include DMSO (final concentration of 6%) and tetramethylammoniumchloride (TMAC; final concentration of 50 mM in both RT and PCR) to improve the slope, linearity, and sensitivity of the assay.
Data and Statistical Analysis
All calculations [averages, standard deviations, slopes, coefficients of determination, copy numbers, and % coefficient of variations (CVs)] were calculated using Microsoft Excel (Redmond, WA). Geometric means were generated to analyze cycle threshold (Ct) values; averages were generated to analyze copy numbers and mass values. Raw PCR data (Ct values) were transformed into miR-34a copy numbers per RT reaction by SDS (Applied Biosystems) through extrapolation to the miR-Rx34 standard curve (copies/ng). Copy numbers per milliliters blood (copies/mL) were calculated according to eq 1 in which Vblood is the volume of the blood sample used in the RNA isolation, IF is the RNA isolation factor (typically 2) that accounts for the carry-over of only half of the aqueous phase during the phenol extraction step, VRNA is the volume of the RNA eluate, DF is the dilution factor that accounts for diluting the eluted RNA before use in RT, and VRT is the volume of the diluted RNA eluate used in RT.
| 1 |
Mass of miR-Rx34 per mL blood (ng/mL) was calculated by multiplying the calculated number of copies per milliliters blood with the mass of one miR-Rx34 molecule (2.46323525 × 10⁻¹¹ ng). Standard curve data and data produced with QC and test samples were also presented as the corresponding concentrations in whole blood (ng/mL). These calculations assumed that RNA from blood is extracted in 50 μL of sterile, nuclease-free water (see RNA isolation method).
Qualification End Points for the RNA Isolation Procedure
To determine interexperimental variability, two sets of three blood samples (process samples, P) were isolated by one operator on two separate days, such that samples P1–P3 were isolated on one day, and samples P4–P6 were isolated on another day. In addition, six test samples (T1–T6) were isolated to verify results obtained from process samples. Average yields were determined from replicate samples performed on each isolation day. RNA quality and integrity were determined by capillary gel electrophoresis using the Agilent Bioanalyzer and RNA 6000 chips (Agilent, Santa Clara, CA). An RNA Integrity Number (RIN) was determined for each sample and can range between 1 and 10, whereby a value of 10 represents RNA with the least amount of degradation. RIN values of high quality RNA typically ranges between 7 and 10 (Agilent). The cutoff for normal blood samples was a RIN of 7 or higher. Cutoff values were not applied to samples containing exogenous miR-Rx34 because we expect an increase of the small RNA fraction in these samples that could erroneously impact and lower the RIN value. RNA recovery was determined using a set of blood samples spiked with a known amount of test article (MRX34) in a serial dilution (spike-in samples). The recovery rates of a highly abundant miRNA (exogenous miR-Rx34) and a miRNA present at much lower levels (endogenous house-keeping miRNA, miR-24) were determined by qRT-PCR. RNA stability of the blood lysates frozen at −20 °C was determined using a set of blood samples spiked with MRX34 and stored at −20 °C for up to 45 days (stability samples). This time frame was deemed sufficient for the analysis of samples from good laboratory practices (GLP) toxicity studies. Stability was determined by measuring miR-Rx34 levels by qRT-PCR.
Qualification End Points for the miR-34a qRT-PCR Assay
Acceptance criteria for precision and accuracy were based on inherent variations in the qRT-PCR method and were set at 50% deviation from nominal with ≤50% CV. This variance is due to an inherent error during the RT-PCR amplification that traditionally yields raw Ct values with a standard deviation of up to approximately 0.5 Ct13 and can translate into an approximate 1.5-fold error in concentrations. The lower limit of quantitation (LLOQ) of the assay was defined as the lowest reference standard that (i) is at least 5 times the response of a no-template control (NTC, blank response) and (ii) yields a value with a precision of ≤50% CV and an accuracy of ±50%. The upper limit of quantitation (ULOQ) was defined as the highest reference standard that yields a value with a precision of ≤50% CV and an accuracy of ±50%. Because the background noise of the no-template control is not constant and can vary between experiments, additional PCR-specific detection and quantification limits were calculated for each qRT-PCR run and each standard curve following a recommendation described in an ICH guideline.14 The PCR-specific lower limit of detection, referred to as LLODP, was defined as the highest Ct value that can be confidently distinguished from the background Ct value generated by the no-template-control (NTC). The LLODP was calculated as follows: LLODP = CtNTC – Δ1 in which Δ1 = (3.3 x σ)/–S, σ is the standard deviation of the NTC replicates, and S is the slope of the standard curve. The PCR-specific LLOQ, referred to as LLOQP, was defined as the highest Ct value for which quantitation can be confidently distinguished from the background Ct value generated by a no-template-control. The LLOQP was determined as follows: LLOQP = CtNTC – Δ2 in which Δ2 = (10 x σ)/–S, σ is the standard deviation of the NTC replicates, and S is the slope of the standard curve. Specificity was defined as the % probability (= % false positive rate) of the miR-34a qRT-PCR assay to erroneously amplify other oligonucleotides, such as its closest natural homologue, the hsa-miR-34c mimic. This probability was reported as a percentage of the nominal miR-34c input.
MRX34 Pharmacokinetic Analysis
Estimation of the pharmacokinetic parameters was done using Phoenix WinNonlin software (Pharsight, Sunnyvale, CA). A noncompartmental model was used to fit the miR-Rx34 whole blood concentration (group mean) versus time data. The calculated parameters included half-life, area-under-the-curve, clearance, and volume of distribution. The elimination half-life, t1/2, was calculated from the slope of the regression line that best fit the terminal portion of the log–linear concentration versus time curve (λz). The area under the concentration versus time curve (AUC) was calculated using the trapezoidal rule and extrapolated to infinity. Total body clearance (CL), and volume of distribution (Vd) were estimated using standard noncompartmental methods.
Results
Qualification of the RNA Isolation Procedure
The preparation of total RNA followed a protocol that uses guanidine thiocyanate to denature proteins, as well as an acid–phenol extraction and a glass-fiber filtration step to rid the RNA from DNA and lipophilic molecules. During the phenol extraction, we proceeded with merely half of the aqueous phase to minimize contaminant and phenol carry-over, to preserve the quality of the RNA and to ensure optimal buffer conditions for subsequent PCR analyses. Thus, we anticipated consistent recovery of RNA across multiple samples that contained the same starting material.
As shown in Table S-1 of the Supporting Information, 1 mL from a pooled source of nonhuman primate whole blood yielded an average RNA concentration of 13069 ng/mL with a % CV of 16.6. All RNA samples were of high quality, as analyzed by capillary gel electrophoresis that produced RIN numbers between 8.9 and 9.4 for all samples.
To further investigate how much miRNA could be recovered in a background of total RNA from whole blood, the levels of two miRNAs were evaluated: (i) a highly abundant miRNA, miR-Rx34 (the active pharmaceutical ingredient in MRX34), at concentrations used in toxicology studies and (ii) miR-24, a house-keeping miRNA present at much lower levels.15 The recovery of miR-Rx34 was determined across a range of blood samples spiked with MRX34 to yield a final miR-Rx34 input of 100, 10, 1, 0.1, and 0.01 μg per sample (SP, spike-in samples). miR-Rx34 levels were determined by qRT-PCR, and the miR-Rx34 data were reported as mass (nanograms) and % recovery. The average percent recovery of miR-Rx34 was 33.8 with a % CV of 9.3 (Table S-2 of the Supporting Information). A comparison of experimentally recovered miR-Rx34 and starting materials shows tight correlation across the five 10-fold dilutions (Figure S-1A of the Supporting Information, R2 = 0.9995). These results indicate that the recovery of the therapeutic miRNA, miR-Rx34 formulated as MRX34, is consistent between replicate isolations and independent of MRX34 blood concentrations. To determine the recovery of a house-keeping miRNA, miR-24-specific qRT-PCR was performed using the same RNA samples and the data were reported as raw Ct values. Given consistent RNA recovery, the house-keeping miRNA was expected to be present at similar levels in all RNA samples such that raw Ct values would not differ by greater than 2× the standard deviation of the mean. As shown in Figure S-1B of the Supporting Information, all miR-24 data were between 18.17 and 19.20 Ct and were within the acceptable range. Thus, the data suggest that the RNA isolation method provides consistent recovery of miRNA, whether it is present at exogenous (miR-Rx34), high, low, or endogenous (miR-24) levels. The data also show that the addition of exogenous miRNA at high concentrations does not interfere with the recovery of a lowly expressed miRNA.
Qualification of the miR-34a qRT-PCR Assay
Standard Curves, Range, And Limits of Detection
Standard curves were generated using the reference standard (miR-Rx34, MW = 14833.95) in a 10-fold, serial dilution to yield from 2.46 × 10⁻⁷ to 2.46 × 10⁻¹ ng miR-Rx34 per qRT-PCR reaction. This equals from 104 to 1010 miR-Rx34 copies and an estimated blood concentration from 6.16 × 10⁻⁵ to 6.16 × 101 ng/mL. This range is expected to be sufficient for the quantification of endogenous and exogenous miR-34a. Standard curves 1–3 and 4–6 were performed on two separate days. All standard curves were derived from triplicate data points, and each qRT-PCR run included a set of 12 no-template controls (qRT-PCR reactions without template RNA input, NTC) to determine the noise of the assay. Raw PCR data (Ct, cycle threshold), expressed in log2, were converted into mass miR-Rx34 (nanograms) and estimated blood concentrations (nanograms/milliliters). Because some of the analysis required the use of raw data, assay performance criteria are presented for Ct values (log2 space) and data converted to nanograms (linear space).
In a first step, raw Ct data were used to generate trendlines and to calculate slopes, R2 values, and PCR-specific limits of detection and quantitation, LLODP and LLOQP. The highest reference standard (2.46 × 10⁻¹ ng, 1 × 10¹⁰ miR-Rx34 copies) typically produced Ct values between 11 and 12 (Table 1). The lowest standard (2.46 × 10⁻⁷ ng, 100 miR-Rx34 copies) produced an average Ct value of ∼30 and was well-removed from the NTC that yielded a Ct value between 32 and 34. This NTC value was a reproducible result due to detectable fluorescence at an earlier cycle and is in contrast to other miRNA qRT-PCR assays for which NTCs are usually 35 or greater (unpublished data). We speculate that primers used to amplify the miR-34a sequence are more likely to self-anneal, which can result in primer amplification and increased background noise.12 Thus, the average LLODP and LLOQP was 33.12 and 31.25 Ct, respectively. All six standard curves exhibited a slope between −3.0549 and −3.1369; the average slope was −3.1226 (Figure S-2 of the Supporting Information). Since the reference standards were prepared in a 10-fold dilution series and Ct values are expressed in log2 space, a theoretical standard curve has a slope of −3.3219. Typically, miRNA standard curves determined experimentally have a slope of −3.0 (±0.5). Thus, standard curves generated here produced curves with an acceptable slope. The coefficients of determination (R2) values ranged between 0.9970 and 0.9984 for all six standard curves. The data were generated with a final concentration of 6% DMSO and 50 mM TMAC in both the RT and PCR steps of the miR-34a assay. A comparison with a traditional assay absent these reagents shows that the major improvements relate to slope and reduced background in NTC samples (Figure S-3 of the Supporting Information).
Table 1. Range and Limits of Quantitation of the miR-34a qRT-PCR Assaya.
| Ct |
||||||||
|---|---|---|---|---|---|---|---|---|
| reference standard (ng) | curve 1 | curve 2 | curve 3 | curve 4 | curve 5 | curve 6 | mean (Ct) | SD (Ct) |
| 2.46 × 10–01 | 11.68 | 11.90 | 12.25 | 11.87 | 12.24 | 11.80 | 11.96 | 0.2 |
| 2.46 × 10–02 | 14.00 | 14.46 | 14.38 | 14.24 | 14.44 | 14.17 | 14.28 | 0.2 |
| 2.46 × 10–03 | 17.13 | 17.56 | 17.26 | 17.45 | 17.84 | 17.79 | 17.50 | 0.3 |
| 2.46 × 10–04 | 20.58 | 20.88 | 20.25 | 20.92 | 21.12 | 20.77 | 20.75 | 0.3 |
| 2.46 × 10–05 | 23.96 | 24.11 | 23.89 | 23.97 | 24.25 | 24.50 | 24.11 | 0.2 |
| 2.46 × 10–06 | 27.10 | 27.29 | 26.93 | 27.16 | 27.35 | 27.21 | 27.17 | 0.2 |
| 2.46 × 10–07 | 29.83 | 30.24 | 30.19 | 30.31 | 30.77 | 30.48 | 30.30 | 0.3 |
| NTC | 32.07 | 32.73 | 36.91 | 34.67 | 35.80 | 33.01 | 34.20 | 1.9 |
| mean | % CV | |||||||
| slope | –3.125 | –3.115 | –3.055 | –3.1314 | –3.1369 | –3.1728 | -3.1226 | 1.2 |
| R2 | 0.9970 | 0.9980 | 0.9955 | 0.9984 | 0.9976 | 0.9970 | 0.9972 | 0.1 |
| LLODP | 31.14 | 32.29 | 34.89 | 33.77 | 34.09 | 32.55 | 33.12 | 4.2 |
| LLOQP | 29.26 | 31.39 | 32.80 | 31.91 | 30.56 | 31.60 | 31.25 | 3.9 |
Standard curves 1–3 and 4–6 were generated on two separate days. Data are presented as raw Ct values. The qRT-PCR specific LLOD and LLOQ values, LLODP and LLOQP, were calculated as described in Materials and Methods.
To determine the intraexperimental error of the miR-34a assay, triplicate qRT-PCR runs per reference standard concentration were analyzed. Because both raw values (log2 space) and data converted into the linear space are frequently used to evaluate the performance of qRT-PCR assays, results from standard curve 1 expressed as Ct or mass miR-Rx34 (ng) are shown (Table 2). Traditionally, qRT-PCR assays yield Ct values with standard deviations of up to ±0.5 Ct due to an inherent error during the RT step and amplification of the PCR template.16 When expressed in the linear space, however, this error can translate into an approximate 50% variation. Therefore, an acceptable CV for the miR-34 assay is one that is equal or below 50%, and an acceptable range for accuracy is ±50%. As shown in Table 2, SD values derived from Ct data were well below 0.5 with SD values of 0.1–0.4 Ct over the input range evaluated. After conversion into mass miR-Rx34, the same data produced CV values of 5.3%–25.4%. The mean SD value from any reference point in any of the six standard curves was 0.15 Ct, corresponding to a mean CV value of 13.4% as a measure of the intraexperimental error (Table S-3 of the Supporting Information). The interexperimental error across all six standard curves was below 15.72% CV with a mean of 10.5% CV (Table S-3 of the Supporting Information).
Table 2. Intra-Experimental Error of a miR-34a qRT-PCR Standard Curvea.
| reference standard (ng) | Ct |
recovered
miR-Rx34 (ng) |
||||
|---|---|---|---|---|---|---|
| Ct | mean | SD | ng | mean | % CV | |
| 2.46 × 10–01 | 11.82 | 11.68 | 0.2 | 1.6 × 10–01 | 1.8 × 10–01 | 13.8 |
| 11.75 | 1.7 × 10–01 | |||||
| 11.48 | 2.1 × 10–01 | |||||
| 2.46 × 10–02 | 14.14 | 14.00 | 0.2 | 2.9 × 10–02 | 3.2 × 10–02 | 13.0 |
| 14.05 | 3.1 × 10–02 | |||||
| 13.81 | 3.7 × 10–02 | |||||
| 2.46 × 10–03 | 17.25 | 17.13 | 0.1 | 2.9 × 10–03 | 3.2 × 10–03 | 10.0 |
| 16.99 | 3.6 × 10–03 | |||||
| 17.16 | 3.1 × 10–03 | |||||
| 2.46 × 10–04 | 20.88 | 20.58 | 0.3 | 2.0 × 10–04 | 2.6 × 10–04 | 25.2 |
| 20.65 | 2.4 × 10–04 | |||||
| 20.22 | 3.3 × 10–04 | |||||
| 2.46 × 10–05 | 24.05 | 23.96 | 0.1 | 2.0 × 10–05 | 2.1 × 10–05 | 5.3 |
| 23.91 | 2.2 × 10–05 | |||||
| 23.93 | 2.1 × 10–05 | |||||
| 2.46 × 10–06 | 27.29 | 27.10 | 0.2 | 1.8 × 10–06 | 2.1 × 10–06 | 11.8 |
| 26.97 | 2.3 × 10–06 | |||||
| 27.04 | 2.2 × 10–06 | |||||
| 2.46 × 10–07 | 30.25 | 29.83 | 0.4 | 2.0 × 10–07 | 2.8 × 10–07 | 25.4 |
| 29.73 | 3.0 × 10–07 | |||||
| 29.53 | 3.4 × 10–07 | |||||
Data from standard curve 1 are presented as raw Ct values and nanogram miR-Rx34.
In a second step, we converted raw PCR data into mass of miR-Rx34 and estimated blood concentrations (Table 3). Back-calculated concentrations were within 60–144% of nominal input concentrations with % CV of 15.7 or less. The average LLODP value was 4.3 × 10⁻⁸ ng miR-Rx34 per RT reaction which equals an estimated blood concentration of 1.1 × 10⁻⁵ ng/mL. The average PCR-specific LLOQP value was below the lowest reference standard (1.6 × 10⁻⁷ ng per RT reaction, 4.1 × 10⁻⁵ ng/mL). Thus, the LLOQ of the miR-34a assay proved to be the lowest standard (2.5 × 10⁻⁷ ng per RT reaction which equals an estimated blood concentration of 6.2 × 10⁻⁵ ng/mL). The LLOQ was 9.1× the response of the no-template control, exhibited ≤20% variation, and an average intraexperimental error of 12.6% CV. On the basis of these data, we hypothesize that we can detect as little as 1747 miR-34a copies per RT reaction and accurately quantify as little as 6657 copies per RT reaction. The average level of endogenous miR-34a measured in most tissues ranges around 50000 copies/ng RNA.6 This is equivalent to approximately 750 copies/cell, given an overall RNA content of 15 pg/cell. On the basis of this calculation, we would need RNA from ∼3 and ∼9 cells per RT reaction to detect and to quantify endogenous miR-34a, respectively. The ULOQ was the highest standard that produced ≤40% variance and an average intraexperimental error of 9.3% CV. Thus, the qualified range of the miR-34a assay spanned 6 orders of magnitude, ranging from 2.5 × 10⁻⁷ to 2.5 × 10⁻¹ ng miR-Rx34, which equals an estimated blood concentration of 6.2 × 10⁻⁵–6.2 × 101 ng/mL. Blood concentrations used in toxicology studies may be much higher and, therefore, will need to be diluted accordingly to bring the sample signal into the quantifiable range of the assay.
Table 3. Range and Limits of Quantitation of the miR-34a qRT-PCR Assaya.
| curve-1 |
curve-2 |
curve-3 |
curve-4 |
curve-5 |
curve-6 |
|||||||||||
|---|---|---|---|---|---|---|---|---|---|---|---|---|---|---|---|---|
| reference standard (ng) | ng | % Dev | ng | % Dev | ng | % Dev | ng | % Dev | ng | % Dev | ng | % Dev | av (ng) | av % Dev | % CV | ng/mLb |
| 2.46 × 10–01 | 1.8 × 10–01 | –27.3 | 1.9 × 10–01 | –21.1 | 1.5 × 10–01 | –39.7 | 1.8 × 10–01 | –26.0 | 1.7 × 10–01 | –29.7 | 1.9 × 10–01 | –22.1 | 1.8 × 10–01 | –27.6 | 9.3 | 4.5 × 1001 |
| 2.46 × 10–02 | 3.2 × 10–02 | 31.5 | 2.9 × 10–02 | 19.2 | 3.0 × 10–02 | 20.5 | 3.2 × 10–02 | 28.2 | 3.4 × 10–02 | 38.2 | 3.4 × 10–02 | 39.4 | 3.2 × 10–02 | 29.5 | 6.6 | 8.0 × 1000 |
| 2.46 × 10–03 | 3.2 × 10–03 | 30.3 | 3.0 × 10–03 | 22.9 | 3.4 × 10–03 | 37.1 | 3.0 × 10–03 | 21.6 | 2.8 × 10–03 | 13.8 | 2.6 × 10–03 | 3.6 | 3.0 × 10–03 | 21.5 | 9.8 | 7.5 × 10–01 |
| 2.46 × 10–04 | 2.6 × 10–04 | 4.1 | 2.6 × 10–04 | 4.8 | 3.5 × 10–04 | 44.1 | 2.3 × 10–04 | –5.0 | 2.5 × 10–04 | 2.9 | 2.9 × 10–04 | 16.1 | 2.7 × 10–04 | 11.2 | 15.7 | 6.8 × 10–02 |
| 2.46 × 10–05 | 2.1 × 10–05 | –15.2 | 2.4 × 10–05 | –4.2 | 2.3 × 10–05 | –7.6 | 2.5 × 10–05 | 0.7 | 2.5 × 10–05 | 2.6 | 1.9 × 10–05 | –22.2 | 2.3 × 10–05 | –7.7 | 10.3 | 5.7 × 10–03 |
| 2.46 × 10–06 | 2.1 × 10–06 | –15.5 | 2.2 × 10–06 | –9.7 | 2.3 × 10–06 | –4.7 | 2.4 × 10–06 | –3.5 | 2.6 × 10–06 | 6.5 | 2.6 × 10–06 | 7.2 | 2.4 × 10–06 | –3.3 | 9.2 | 6.0 × 10–04 |
| 2.46 × 10–07 | 2.8 × 10–07 | 14.5 | 2.5 × 10–07 | 2.4 | 2.0 × 10–07 | –19.1 | 2.3 × 10–07 | –4.7 | 2.1 × 10–07 | –14.4 | 2.5 × 10–07 | –0.1 | 2.4 × 10–07 | –3.5 | 12.6 | 5.9 × 10–05 |
| NTC | 5.5 × 10–08 | n/ad | 4.2 × 10–08 | n/ad | 3.4 × 10–09 | n/ad | 1.1 × 10–08 | n/ad | 7.6 × 10–09 | n/ad | 4.1 × 10–08 | n/ad | 2.7 × 10–08 | n/ad | 82.2 | n/ad |
| specs | ||||||||||||||||
|---|---|---|---|---|---|---|---|---|---|---|---|---|---|---|---|---|
| LLODPc | 1.1 × 10–07 | 5.5 × 10–08 | 5.7 × 10–09 | 1.8 × 10–08 | 1.8 × 10–08 | 5.5 × 10–08 | 4.3 × 10–08 | n/ad | 85.5 | 1.1 × 10–05 | ||||||
| LLOQPc | 4.2 × 10–07 | 1.1 × 10–07 | 2.8 × 10–08 | 7.2 × 10–08 | 2.5 × 10–07 | 1.1 × 10–07 | 1.6 × 10–07 | n/ad | 88.7 | 4.1 × 10–05 |
Standard curves 1–3 and 4–6 were generated on two separate days. Recovered miR-Rx34 (ng) and the percent deviation from the nominal (% Dev) are shown.
The estimated average concentration of miR-Rx34 in whole blood (nanograms/milliliters) is shown.
The qRT-PCR specific LLOD and LLOQ values, LLODP and LLOQP, were determined as described in Materials and Methods.
n/a = not applicable.
Precision and Accuracy
To determine precision and accuracy of the miR-34a assay, a set of four different concentrations of the reference standard (miR-Rx34) in sterile, nuclease-free water containing 5 ng/μL yeast tRNA (quality control samples, QC) were used in conjunction with each standard curve. These QC samples covered the high (1 sample), mid (1 sample), and low end (2 samples) of the standard curves such that the input was 1.23 × 10⁻¹ ng (high), 1.23 × 10⁻³ ng (mid), 1.23 × 10⁻⁵ ng (low), and 1.23 × 10⁻⁶ ng (low) miR-Rx34 per RT reaction, respectively. This equaled an estimated blood concentration of 3.08 × 101, 3.08 × 10⁻¹, 3.08 × 10⁻³, and 3.08 × 10⁻⁴ ng/mL, respectively. As shown in Table 4, the mean intraexperimental precision was 16.2% CV, and the mean interexperimental precision was 15.1% CV in agreement with the variation observed for those of reference standard concentrations. The average calculated concentrations of QC samples were within 60.1–92.7% of nominal input concentrations with % CV of 18.9 or less, indicating consistent recovery of miR-Rx34 at these concentrations. Thus, precision and accuracy of the miR-34a assay was within the acceptable range.
Table 4. Accuracy and Precisiona.
|
curve-1 |
curve-2 |
curve-3 |
curve-4 |
curve-5 |
curve-6 |
|||||||||||
|---|---|---|---|---|---|---|---|---|---|---|---|---|---|---|---|---|
| QC sample | ng | % Dev | ng | % Dev | ng | % Dev | ng | % Dev | ng | % Dev | ng | % Dev | av (ng) | av (% Dev) | % CV | ng/mLb |
| QC-high (1.23 × 10–01) | 8.8 × 10–02 | –28.5 | 7.6 × 10–02 | –37.9 | 9.1 × 10–02 | –26.1 | 9.4 × 10–02 | –23.9 | 9.4 × 10–02 | –23.4 | 6.5 × 10–02 | –47.1 | 8.5 × 10–02 | –31.2 | 13.7 | 2.1 × 1001 |
| QC-mid (1.23 × 10–03) | 1.2 × 10–03 | –1.1 | 1.0 × 10–03 | –14.8 | 1.4 × 10–03 | 12.0 | 1.1 × 10–03 | –11.2 | 1.1 × 10–03 | –7.5 | 9.7 × 10–04 | –21.6 | 1.1 × 10–03 | –7.3 | 12.6 | 2.9 × 10–01 |
| QC-low (1.23 × 10–05) | 1.1 × 10–05 | –14.3 | 1.0 × 10–05 | –18.5 | 1.1 × 10–05 | –10.6 | 8.2 × 10–06 | –33.4 | 7.5 × 10–06 | –39.0 | 8.6 × 10–06 | –30.0 | 9.3 × 10–06 | –24.3 | 15.1 | 2.3 × 10–03 |
| QC-low (1.23 × 10–06) | 8.3 × 10–07 | –32.3 | 6.1 × 10–07 | –50.4 | 9.6 × 10–07 | –22.3 | 7.6 × 10–07 | –38.1 | 5.9 × 10–07 | –51.9 | 6.8 × 10–07 | –44.4 | 7.4 × 10–07 | –39.9 | 18.9 | 1.9 × 10–04 |
| intra-experimental
precision (% CV) |
|||||||
|---|---|---|---|---|---|---|---|
| QC sample | curve-1 | curve-2 | curve-3 | curve-4 | curve-5 | curve-6 | inter-experimental precision (% CV) |
| high (1.23 × 10–01) | 9.5 | 7.2 | 8.3 | 9.3 | 7.6 | 2.7 | 13.7 |
| mid (1.23 × 10–03) | 28.3 | 22.2 | 21.4 | 9.6 | 20.3 | 18.4 | 12.6 |
| low (1.23 × 10–05) | 15.5 | 38.8 | 31.2 | 10.7 | 20.6 | 25.7 | 15.1 |
| low (1.23 × 10–06) | 9.0 | 5.7 | 11.9 | 23.5 | 19.5 | 11.8 | 18.9 |
| mean precision (% CV) | 16.2 | 15.1 | |||||
A set of four QC samples was tested in parallel with standard curves 1–6 shown in Table 6. Accuracy is presented as the percent deviation (% Dev) from the true value.
The estimated average concentration of miR-Rx34 in whole blood (ng/mL) is shown.
Specificity
The therapeutic miR-34a mimic spans a length of 23 nucleotides and differs by 6 nucleotides from its closest natural homologue, miR-34c. To determine the false-positive rate of the miR-34a assay, two dilution series from 2.36 × 10⁻⁷ to 2.36 × 10⁻¹ ng mass input per qRT-PCR reaction using either the miR-34a (miR-Rx34) or the miR-34c (miR-Rx34c) reference standards were prepared. Both reference standards were used as templates in the miR-34a qRT-PCR assay. A set of NTC samples was included to calculate LLOQP. As shown in Table S-4 of the Supporting Information, false-positive miR-34a reported by the miR-34a assay using miR-34c as the template ranged between 9.81 × 10⁻⁹ and 1.15 × 10⁻⁸ ng across all data points of the miR-34c standard curve. These values are similar to those generated with the NTC samples (4.42 × 10⁻⁹ ng) and below the LLOQ of the miR-34a assay (2.46 × 10⁻⁷ ng). Therefore, the miR-34a assay is specific for the quantification of miR-34a within the qualified range.
Frozen Storage and Stability of miR-Rx34 in Whole Blood Sample Lysates
To test whether the recovery of miR-Rx34 is affected during frozen storage, aliquots of blood lysates spiked with known amounts of MRX34 were stored at −20 °C for up to 45 days (stability samples, ST1–12). miRNA levels were determined by the miR-34a qRT-PCR assay and reported as mass and % recovery. If storage affected the integrity of the active pharmaceutical ingredient, we expected lower miR-Rx34 recovery for samples stored longer (i.e., day 45) versus those processed immediately (day 0). As shown in Table S-5 of the Supporting Information, the average recovery of miR-Rx34 ranged between 47.0% and 51.9% for nonhuman primate blood lysates stored up to 45 days at −20 °C. This is consistent with the recovery shown earlier and did not change over the 45 day sampling period. The data suggest that miR-Rx34 in nonhuman primate blood lysates is stable for at least 45 days when stored at −20 °C.
Endogenous miR-34a Levels in Whole Blood from Nonhuman Primate
Since the active strand of the therapeutic miRNA mimic, miR-Rx34, is identical to the mature, endogenous miR-34a, the qRT-PCR assay is unable to distinguish between the synthetic and the natural version of miR-34a. Although the exogenous miRNA is expected to be in excess relative to the endogenous during early time points of toxicology studies, it is prudent to know how much the endogenous miRNA contributes to the total amount of miR-34a present in the blood and when exogenous levels decline to baseline levels. To determine endogenous miR-34a concentrations, we tested 12 naïve blood samples derived from a total of 6 nonhuman primates. Total RNA from each sample was diluted 1:10 in nuclease-free water containing 5 ng/μL yeast tRNA before being used in qRT-PCR. As shown in Table 6 of the Supporting Information, the average blood concentration of endogenous miR-34a was 0.046 ng/mL and was approximately 750-fold above the LLOQ of the assay (6.2 × 10⁻⁵ ng/mL). This result demonstrates that the miR-34a assay is sufficiently sensitive to detect endogenous miR-34a in nonhuman primate blood. The CV value was 89.8%, suggesting significant variation between miR-34a levels in these samples. To determine the source of this variation, we compared miR-34a concentrations with levels of the house-keeping miRNA, miR-24 (Figure S-4 of the Supporting Information). Interestingly, samples drawn from the same animal produced very similar data, suggesting that the main source of this variation is biological variability (see also precision of the miR-34a qRT-PCR of standard 2.46 × 10–05: CV = 10.3%, Table 3). However, the miR-24 levels across different animals were not constant, and therefore, inconsistencies in RNA isolation could add to this variation.
Blood Pharmacokinetics of MRX34 in Nonhuman Primates
The pharmacokinetic parameters of MRX34 were determined in a group of three Cynomolgous monkeys. The drug was given as a slow, intravenous bolus at 1.0 mg/kg at a dose level that was considered pharmacologically relevant. At intervals after dosing and at termination, whole blood samples were taken for the quantification of miR-Rx34. In addition, predose samples were taken to determine the expression levels of endogenous miR-34a. Total RNA was diluted appropriately to ensure that raw data fall within the qualified range of the standard curve (Table S-7 of the Supporting Information). The average endogenous level was 0.042 ng/mL in agreement with our data generated during the qualification of the assay (Figure 1). In contrast, blood concentrations of miR-Rx34 were ∼6807 ng/mL at the earliest sampling time point (1 min) and decreased to ∼313 ng/mL within 24 h. These concentrations are ∼160000× and 7500× greater than endogenous levels, respectively. Approximately 95.4% of the starting material was eliminated from the blood during this time frame. A noncompartmental fit of the blood concentration-versus-time curve produced an estimated half-life of miR-Rx34 of 7.7 h, an AUC value of 16968 h ng/mL, a volume of distribution value of 650 mL/kg, and a clearance rate of 60 mL/h/kg. The data suggest that liposome-encapsulated miR-Rx34 has a favorable residence time in blood with concentrations that are well above baseline levels 24 h post-treatment.
Figure 1.

Pharmacokinetics of liposome-encapsulated miR-Rx34 in nonhuman primates. MRX34 was administered as a slow, intravenous bolus into a group of three nonhuman primates at a dose level of 1 mg/kg. Whole blood was collected at time points as indicated in the graph. Total RNA were isolated from 175 μL of whole blood per sample and eluted in 50 μL sterile, nuclease-free water. To ensure that miR-Rx34 concentrations are within the qualified range of the assay, RNA samples collected 1 min through 360 min post injection were diluted 1:10000. RNA samples collected 720 and 1440 min after administration of MRX34 were diluted 1:1000. RNA samples from untreated animals were diluted 1:10 to measure concentrations of endogenous miR-34a. For each qRT-PCR run, 2 μL of diluted RNA were used. Data are expressed as nanograms per milliter of blood.
Discussion
There are many analytical methods to detect nucleic acids, and several of these have been used to measure concentrations of therapeutic oligonucleotides. Mimics of endogenous miRNAs represent a new class of therapeutic oligonucleotides for which an optimal analytical platform in support of an IND submission has not yet been reported. Typically, performance in the context of the specific analyte under investigation determines the assay of choice, owing to the fact that each assay has its own advantages and limitations.9 For the quantification of the miR-34a mimic, we chose quantitative PCR because it has an exceptional dynamic range and is the most sensitive method. It enables the quantification of the therapeutic mimic as well as the endogenous miR-34a that is expressed at low levels and is indistinguishable from the active strand of our API. The measurement of both miR-34a species is necessary to fully understand drug behavior. The qRT-PCR method described here is based on stem-loop RT and Taqman qPCR.12 Experimental conditions specific to the performance of the miR-34a assay have been altered to improve linearity and sensitivity. For instance, the addition of DMSO and TMAC were critical in generating standard curves with a slope close to −3.3219 and reducing the noise of the NTC. In addition, our assay enables the detection of a double-stranded miRNA mimic by including a heat-denaturing step prior to RT-PCR to facilitate optimal conditions for annealing the unique RT primer to the miRNA template. This is not a typical step in other commercially available RT-PCR kits. Without the initial heat denature step, the reverse transcription reaction efficiency is greatly compromised and, as a result, the miRNA mimic is poorly quantified in qRT-PCR.
A disadvantage commonly attributed to qRT-PCR is reduced precision and accuracy in comparison to other analytical methods. Depending on the gene and matrix, the SD values between technical RT and qPCR replicates can be as high as 0.9 Ct.12,17 Traditionally, we observe SD values that range between 0.1 and 0.3 Ct, and we accept SD values below 0.5 Ct. This variance can translate into a ∼50% error and is applied to precision and accuracy. Despite these relaxed acceptance criteria, however, the mean SD value from replicate qRT-PCR reactions was 0.15 Ct and, thus, was far below 0.5 Ct. Similarly, the mean intraexperimental precision was 16.2% CV and well below the 50% mark. Accuracy was approximately 60–93% of the nominal input across the qualified range of the standard curve. Although we did not investigate the source of variation during our qRT-PCR, we speculate that the reasons for variation are the same as those identified for mRNA qRT-PCR. Studies evaluating the variation of RT and qPCR using RNA from various specimens, including blood samples, showed that the RT step is the major contributor to noise and that assay efficiencies depend on priming strategies, the gene of interest, and total RNA concentrations.
The utility of the miR-34a assay was demonstrated in the determination of the pharmacokinetic properties of MRX34 in the nonhuman primate. On the basis of efficacy studies in mouse models of hepatocellular carcinoma and scaling dose levels from mouse to nonhuman primate by body surface area or body weight, administering a 1 mg/kg injection was considered a therapeutically active dose. The Cmax of liposome-encapsulated miR-Rx34 in whole blood peaked at the earliest time point after dosing (1 min post dosing) and was approximately 5 orders of magnitude above endogenous miR-34a levels. Within the first 6 h, blood concentrations declined by ∼10-fold and stayed well above baseline levels during the remainder of the sampling period. In summary, the data suggest a favorable residence time of encapsulated miR-Rx34 and provided the basis for the design of toxicokinetic studies in nonhuman primates and the calculation of the first dose in man in the MRX34 phase I clinical trial.
Acknowledgments
The authors thank Jennifer Lockridge for insightful comments and discussions. This work was supported by a grant from the National Institutes of Health (Grant 1R43CA137939) to A.G.B. and a commercialization grant from the Cancer Prevention and Research Institute of Texas (CPRIT). The funders had no role in study design, data collection and analysis, decision to publish, or preparation of the manuscript.
Glossary
Abbreviations:
- API
active pharmaceutical ingredient
- AVG
average
- Ct
cycle threshold
- CV
coefficient of variation
- Dev
deviation
- GLP
good laboratory practices
- miRNA
microRNA
- NTC
no-template control
- qRT-PCR
quantitative reverse transcription-polymerase chain reaction
- RIN
RNA integrity number
- RNA
ribonucleic acid
Supporting Information Available
Additional information as noted in text. This material is available free of charge via the Internet at http://pubs.acs.org.
The authors declare the following competing financial interest(s): The authors are employees of Mirna Therapeutics which develops miRNA-based therapies.
Funding Statement
National Institutes of Health, United States
Supplementary Material
References
- Bader A. G.; Brown D.; Winkler M. Cancer Res. 2010, 70, 7027–7030. [DOI] [PMC free article] [PubMed] [Google Scholar]
- Esquela-Kerscher A.; Slack F. J. Nat. Rev. Cancer 2006, 6, 259–269. [DOI] [PubMed] [Google Scholar]
- Mirna Therapeutics. Mirna Therapuetics is First to Advance MicroRNA into the Clinic for Cancer. www.mirnarx.com (accessed May 13, 2013).
- Andreakos E.; Rauchhaus U.; Stavropoulos A.; Endert G.; Wendisch V.; Benahmed A. S.; Giaglis S.; Karras J.; Lee S.; Gaus H.; Bennett C. F.; Williams R. O.; Sideras P.; Panzner S. Arthritis Rheum. 2009, 60, 994–1005. [DOI] [PubMed] [Google Scholar]
- Bader A. G. Frontiers in Genetics 2012, 3, 120. [DOI] [PMC free article] [PubMed] [Google Scholar]
- Tremblay G. A.; Oldfield P. R. Bioanalysis 2009, 1, 595–609. [DOI] [PubMed] [Google Scholar]
- Turnpenny P.; Rawal J.; Schardt T.; Lamoratta S.; Mueller H.; Weber M.; Brady K. Bioanalysis 2011, 3, 1911–1921. [DOI] [PubMed] [Google Scholar]
- Raymond C. K.; Roberts B. S.; Garrett-Engele P.; Lim L. P.; Johnson J. M. RNA 2005, 11, 1737–1744. [DOI] [PMC free article] [PubMed] [Google Scholar]
- Chen C.; Ridzon D. A.; Broomer A. J.; Zhou Z.; Lee D. H.; Nguyen J. T.; Barbisin M.; Xu N. L.; Mahuvakar V. R.; Andersen M. R.; Lao K. Q.; Livak K. J.; Guegler K. J. Nucleic Acids Res. 2005, 33, e179. [DOI] [PMC free article] [PubMed] [Google Scholar]
- Landesman Y.; Svrzikapa N.; Cognetta A. 3rd; Zhang X.; Bettencourt B. R.; Kuchimanchi S.; Dufault K.; Shaikh S.; Gioia M.; Akinc A.; Hutabarat R.; Meyers R. Silence 2010, 1, 16. [DOI] [PMC free article] [PubMed] [Google Scholar]
- Stratford S.; Stec S.; Jadhav V.; Seitzer J.; Abrams M.; Beverly M. Anal. Biochem. 2008, 379, 96–104. [DOI] [PubMed] [Google Scholar]
- Tichopad A.; Kitchen R.; Riedmaier I.; Becker C.; Stahlberg A.; Kubista M. Clin. Chem. 2009, 55, 1816–1823. [DOI] [PubMed] [Google Scholar]
- ICH Harmonised Tripartite Guideline. Validation of Analytical Procedures: Text and Methodology Q2(R1)′ International Conference on Harmonisation, 1994.
- Peltier H. J.; Latham G. J. RNA 2008, 14, 844–852. [DOI] [PMC free article] [PubMed] [Google Scholar]
- D’Haene B.; Vandesompele J.; Hellemans J. Methods 2010, 50, 262–270. [DOI] [PubMed] [Google Scholar]
- Hsu S. D.; Chu C. H.; Tsou A. P.; Chen S. J.; Chen H. C.; Hsu P. W.; Wong Y. H.; Chen Y. H.; Chen G. H.; Huang H. D. Nucleic Acids Res. 2008, 36, D165–D169. [DOI] [PMC free article] [PubMed] [Google Scholar]
- Stahlberg A.; Hakansson J.; Xian X.; Semb H.; Kubista M. Clin. Chem. 2004, 50, 509–515. [DOI] [PubMed] [Google Scholar]
Associated Data
This section collects any data citations, data availability statements, or supplementary materials included in this article.