

Abstract
Nucleic acid aptamers function as versatile sensing and targeting agents for analytical, diagnostic, therapeutic, and gene-regulatory applications, but their limited characterization and functional validation have hindered their broader implementation. We report the development of a surface plasmon resonance-based platform for rapid characterization of kinetic and equilibrium binding properties of aptamers to small molecules. Our system is label-free and scalable and enables analysis of different aptamer–target pairs and binding conditions with the same platform. This method demonstrates improved sensitivity, flexibility, and stability compared to other aptamer characterization methods. We validated our assay against previously reported aptamer affinity and kinetic measurements and further characterized a diverse panel of 12 small molecule-binding RNA and DNA aptamers. We report the first kinetic characterization for six of these aptamers and affinity characterization of two others. This work is the first example of direct comparison of in vitro selected and natural aptamers using consistent characterization conditions, thus providing insight into the influence of environmental conditions on aptamer binding kinetics and affinities, indicating different possible regulatory strategies used by natural aptamers, and identifying potential in vitro selection strategies to improve resulting binding affinities.
Aptamers have emerged as a versatile sensing tool due to their ability to bind molecular targets with high specificity and affinity and potential to be generated de novo through in vitro selection processes1,2 or harvested from natural biological systems.3 The functional diversity of aptamers enables their use for diagnostic and analytical detection;4 as therapeutics,5 drug targets,6 and drug delivery vehicles;7 as noncovalent chemical protecting groups;8 for intracellular imaging9 and scaffolding;10 for enzyme11 and strain12 engineering; and for gene regulation.13,3 Despite the large number of reported aptamers, the majority are still poorly characterized, limiting their increasingly widespread use to a small subset of targets.14 Determination of key properties, including affinity, kinetics, specificity, ion dependence, and buffer sensitivity, is critical for understanding aptamer molecular recognition and implementing aptamers in diverse applications. A thorough characterization of aptamers would further support the study of natural regulatory systems and facilitate the engineering of customized aptamer-based sensors, diagnostics, and therapeutics. Furthermore, variation in characterization methods, binding conditions, and reported binding parameters has so far prevented direct comparison of binding properties across aptamers.
Characterizing small molecule-binding aptamers is particularly challenging as high sensitivity is required to detect binding of low molecular weight targets. Current methods, including isocratic elution,15−18 equilibrium filtration,15,19,20 and in-line probing,21−26 typically rely on intrinsic fluorescence properties of the target27−30 or labeling that risks altering the binding interaction or limits method scalability and are often restricted to specific reaction conditions25,26 or exhibit limited sensitivity.26 Likewise, methods for determining binding kinetics, such as stopped-flow fluorescence spectroscopy,27,31,32 single-molecule fluorescence imaging,33 and gel-shift assays,34 also require labeling,31−34 detailed structural knowledge,31,32 or intrinsic fluorescence properties.27 These methods are therefore not compatible with many small molecule targets and do not support high-throughput aptamer characterization.
Isothermal titration calorimetry (ITC) is a label-free method that measures the heat released from aptamer–target complex formation to determine affinity, stoichiometry, and thermodynamic parameters.35 Kinetic ITC (kinITC) is a recently developed variant that jointly determines thermodynamic and kinetic parameters.36 These techniques mitigate some of the challenges associated with conventional label-based methods, but sensitivity remains a key limitation and accurate characterization of high affinity aptamers remains difficult.37,38
A surface plasmon resonance (SPR)-based assay offers potential solutions to many challenges associated with aptamer characterization. SPR is an optical detection platform that allows real-time and label-free characterization of kinetic and steady-state affinity properties of biomolecular interactions. Typically, one interacting partner is immobilized to the sensor surface, and its interaction with other molecules in solution is monitored. The observed change in refractive index correlates to mass concentration near the surface and is recorded as resonance units (RU).
While SPR has been used to measure aptamer–protein interactions,39 measuring small molecule–aptamer interactions remains challenging due to the small local mass density change contributed by the small molecule.40 To increase the measurable response, small molecules can be immobilized to the surface so that binding of the larger aptamer can be observed.41 However, chemical modification of the target can impact binding and requires suitable functional groups for conjugation. A few cases of nucleic acids binding to small molecules in solution have been demonstrated by capturing aptamer onto a streptavidin sensor surface directly36 or via hybridization.42 The low density of aptamer capable of being immobilized to the streptavidin surface43 prevents accurate measurement of low molecular weight targets,44 and denaturing regeneration conditions lead to a systematic decrease in binding capacity42 and reduce the lifetime of the protein-based surface.43 Previous reports have demonstrated small molecule binding to protein using a high density sensor surface40 and suggest that aptamer immobilization at higher densities may support a more sensitive and stable method for measuring small molecule–aptamer binding.
Here we report an improved platform for characterizing binding properties of aptamers to small molecules. We quantitatively measured method performance across a range of metrics, validated and tested the method with 12 in vitro selected and natural aptamers, and determined previously unreported aptamer kinetic and affinity binding parameters. Evaluation of this panel of aptamers under identical conditions enabled the first direct comparison across small molecule–aptamer binding properties.
Materials and Methods
Aptamers (Table S1 of the Supporting Information) contain a 3′ 24-mer poly(A) sequence for hybridization to the sensor chip and were prepared as described in the Supporting Information. Experiments were performed on a Biacore X100 (GE Healthcare). The DNA linker strand (5′-AmMC6-TTTTTTTTTTTTTTTTTTTTTTTT) (Integrated DNA Technologies) was immobilized to the surface of a CM5 sensor chip (GE Healthcare), as described in the Supporting Information. In all experiments, HBS-N running buffer (GE Healthcare) was supplemented with the appropriate MgCl2 concentration (Life Technologies).
Details of the aptamer assays are described in the Supporting Information. Briefly, priming and startup cycles were performed to stabilize the sensorgram baseline. The aptamer was captured onto the sample flow cell, and the target solution was injected over both flow cells. The association and dissociation phase lengths used for each target were chosen based on time needed to reach equilibrium (Figure 1B and Figures S1 and S2 of the Supporting Information). Aptamer and target were removed from the sensor surface by injecting 25 mM NaOH over both flow cells. Data analysis was performed using Biacore X100 Evaluation Software, version 2.0 (GE Healthcare).
Figure 1.
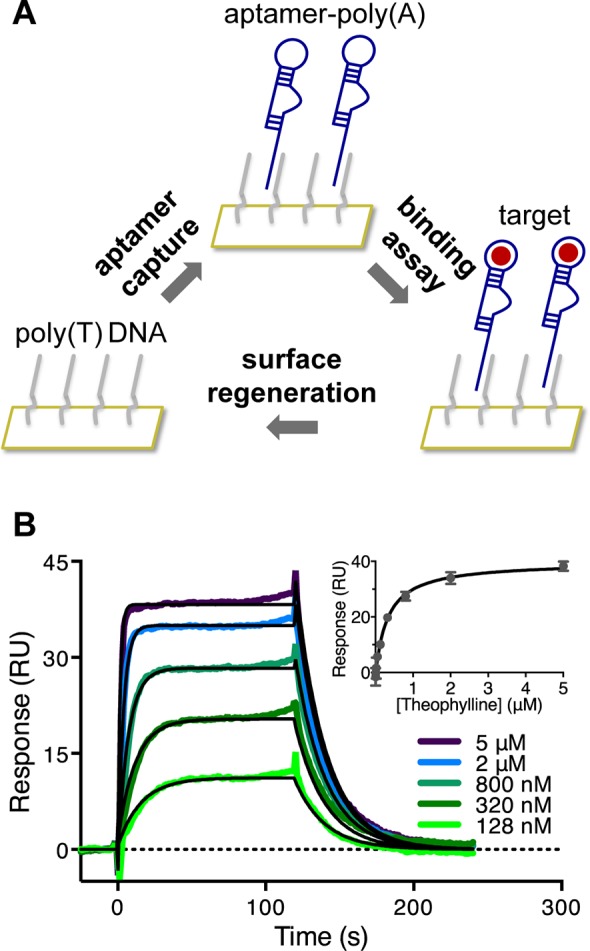
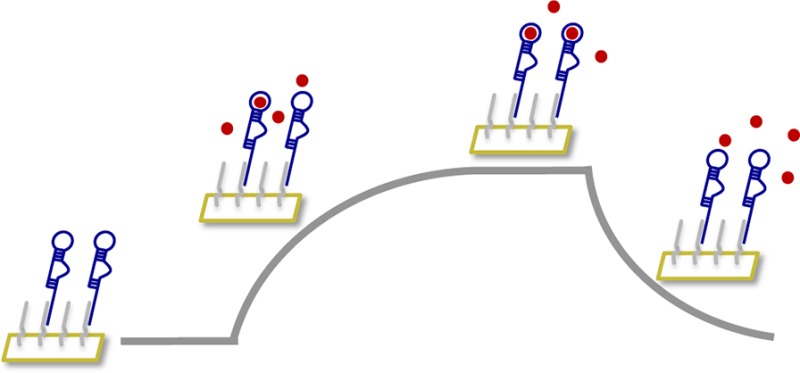
SPR-based aptamer binding assay. (A) Schematic of the sensor surface. A poly(T) DNA linker is covalently immobilized onto the sensor surface. The aptamer contains a poly(A) sequence and hybridizes to the DNA linker. The target is flowed over the sensor surface, and the binding interaction is monitored in real time. After each cycle, the surface is regenerated to remove the aptamer and target. (B) Representative SPR sensorgrams for the theophylline aptamer. The double-referenced sensorgrams were fit to a 1:1 kinetic binding model (shown in black) or steady-state affinity model (inset).
Results and Discussion
In developing an improved method for characterizing aptamer binding properties to small molecules, we designed our method to (a) be label-free, to avoid altering the target binding interaction or limiting use to targets with suitable functional groups for labeling; (b) measure target binding to the free aptamer rather than competitive binding with an analogue15−19,45 or conformational reorganization;32 (c) be scalable, allowing different aptamer–target pairs or binding conditions to be tested; (d) be capable of measuring binding kinetics and equilibrium affinities; and (e) minimize and monitor potential nonspecific interactions. To achieve these desired characteristics, we employed an SPR-based system using a CM5 carboxymethylated dextran sensor chip (Figure 1A), where a 24-mer poly(T) single-stranded DNA linker is covalently immobilized directly to the dextran surface and allows capture of an aptamer containing a corresponding 24-mer poly(A) tail through hybridization.
The CM5 chip’s high immobilization capacity is favorable for analyzing small molecule interactions by maximizing the potential binding signal (Figure S3 of the Supporting Information). The lack of protein components minimizes undesirable nonspecific interactions and adverse effects of denaturing conditions on the stability of the sensor surface. Use of a DNA linker instead of direct immobilization enables surface regeneration for testing different aptamers, targets, or conditions on the same chip. This hybridization capture strategy also prevents either binding partner from being subjected to harsh regeneration conditions, in contrast to systems in which one binding partner is fixed to the surface and may degrade over time. Greater stability is also achieved through covalent attachment of the linker to the chip compared to noncovalent interactions such as streptavidin–biotin. Each sensor surface includes two flow cells; the DNA linker is immobilized onto both flow cells, but the reference flow cell lacks the aptamer. The reference flow cell is used to monitor the presence of nonspecific interactions between the target and sensor surface and resolve target-specific binding from nonspecific responses.
We first validated our SPR platform by measuring the binding properties of the well-studied theophylline aptamer.19 Its short length, high affinity, and specificity have contributed to its broad use as a model aptamer for small molecule binding. A series of theophylline concentrations spanning a 100-fold range around the reported dissociation constant (KD) was measured. Aptamer capture levels were stable within each replicate, with a coefficient of variation less than 3%. The double-referenced sensorgrams were fit globally to a 1:1 kinetic binding model (Figure 1B) and a steady-state affinity model (Figure 1B inset). An association rate (ka) of (1.5 ± 0.1) × 105 M–1 s–1 and dissociation rate (kd) of 0.063 ± 0.004 s–1 were determined, consistent with previously reported rates of (1.7 ± 0.2) × 105 M–1 s–1 and 0.07 ± 0.02 s–1, respectively.31 The KD of 430 ± 40 nM, calculated as the ratio of the binding rates (KD,kinetic = kd/ka), compares well with that obtained from the steady-state affinity model (KD,equilibrium) (340 ± 20 nM), both of which are consistent with previously reported values.19,31
A diverse panel of 12 aptamers was chosen to test the method’s range and sensitivity (Table 1). Selected aptamers are composed of RNA or DNA, span 25 to 96 nucleotides in length, are derived from natural sources or in vitro selection, and exhibit reported KD’s covering nearly 7 orders of magnitude, from 10 pM34 to 76 μM.15 Associated targets consist of 10 to 70 atoms, range from 75.1 to 690.4 g/mol in molecular weight, and serve varied biological and chemical functions. Included are aptamers extensively used as sensors4,13,46,47 and for which more detailed characterization of kinetic and affinity properties would be useful, as well as aptamer pairs that bind TPP and c-di-GMP to investigate whether these nucleic acids employ distinct strategies for binding to the same molecular target. All aptamers were characterized under identical conditions (10 mM HEPES, 150 mM NaCl, and 5 mM MgCl2 at pH 7.4 and 25 °C), enabling the first direct comparison of the binding properties of a broad set of small molecule-binding aptamers.
Table 1. Determination of Aptamer Binding Properties using the SPR-Based Characterization Platforma.
| target | reported KD | ka (M–1 s–1) | kd (s–1) | KD,kinetic | KD,equilibrium |
|---|---|---|---|---|---|
| In Vitro Selected RNA Aptamers | |||||
| arginine | 56 μM,15 76 μM15 | f | f | – | 140 ± 40 μM |
| citrulline | 62 μM,15 68 μM15 | f | f | – | 31 ± 1 μM |
| flavin mononucleotide | 500 nM16 | (7.6 ± 1.2) × 104 | (8.4 ± 1.8) × 10–2 | 1.1 ± 0.4 μM | 710 ± 20 nM |
| malachite green | 1 μM,28 1.03 μM,29 117 nM30 | (2.1 ± 0.3) × 104 | (2.0 ± 0.4) × 10–2 | 950 ± 340 nM | 2.0 ± 0.1 μM |
| theophylline | 320 nM,19 200–400 nM31c | (1.5 ± 0.1) × 105 | (6.3 ± 0.4) × 10–2 | 430 ± 40 nM | 340 ± 20 nM |
| tyrosine | 23 μM17g | f | f | – | 17 ± 6 μMh |
| In Vitro Selected DNA Aptamer | |||||
| ATP | 13 μM18i, 6 μM20j | f | f | – | 8.8 ± 3.0 μM |
| Natural RNA Aptamers | |||||
| c-di-GMP (class I) | 1 nM21b, 10 pM34c,k, 5.9 nM51c,k, 43 nM52d,k, 47 nM52d,k, 13.8 nM51e,k, 90 nM51e,k | (2.3 ± 0.2) × 104 | (2.3 ± 0.9) × 10–5 | 980 ± 470 pM | – |
| c-di-GMP (class II) | 200 pM22b | (1.6 ± 0.5) × 105 | (9.6 ± 1.9) × 10–3 | 60 ± 31 nM | 120 ± 20 nM |
| glycine | 3.5 μM53b, 20 μM23b | 28 ± 5 | (5.6 ± 2.5) × 10–3 | 200 ± 120 μM | – |
| (7.2 ± 1.0) × 102,b | (2.5 ± 0.3) × 10–3,b | 3.5 ± 1.0 μMb | – | ||
| TPP (Thi1) | 210 pM24b | (1.5 ± 0.4) × 105 | (2.1 ± 0.5) × 10–4 | 1.4 ± 0.7 nM | – |
| TPP (thiM) | 8.65 nM38e, 8.43 nM38c, 30 nM25b | (4.0 ± 1.4) × 105 | (3.6 ± 2.0) × 10–4 | 890 ± 800 pM | – |
All reported values are measured at 5 mM MgCl2 unless otherwise indicated. Reported ka, kd, and KD,equilibrium values are the mean and standard deviation of at least three independent experiments. Reported KD,kinetic values are calculated as kd/ka. Unreported KD,kinetic values are due to kinetic constants that cannot be uniquely determined. Unreported KD,equilibrium values are due to a slow approach to equilibrium.
Measured at 20 mM MgCl2.
Measured at 10 mM MgCl2.
Measured at 6 mM MgCl2.
Measured at 2.5 mM MgCl2.
Value cannot be uniquely determined as one kinetic parameter may be outside instrument measurement limits.
Value reported for the Tyr 1b aptamer.
Value reported for the Tyr 1 minimal aptamer, which removes a nonessential stem loop from the Tyr 1b aptamer.
Value reported for a modified aptamer internally labeled with fluorescein between two residues.
Value reported for adenosine.
Value reported for aptamer with a modified stem loop sequence.
The 35FMN-2 flavin mononucleotide,16 minimal MG-4 malachite green,28 and TCT8-4 theophylline19 in vitro selected aptamers display similar binding properties, with KD’s in the mid-nanomolar to low-micromolar range and similar binding rates (Table 1). Three in vitro selected RNA aptamers for amino acids, the 44.Arg11 arginine,15 44.Cit11 citrulline,15 and minimal Tyr 1 tyrosine,17 and the in vitro selected DH25.42 DNA aptamer for ATP20 exhibit similar binding properties, with KD’s in the low- to mid-micromolar range. These aptamers reach equilibrium quickly (<5 s) (Figure S1 of the Supporting Information), precluding kinetic analysis on the specific instrument used.48 We report the first KD determination for the minimal tyrosine aptamer and unmodified ATP aptamer for ATP. Unable to be determined by equilibrium filtration,20 the ATP aptamer’s KD for ATP is similar to its affinity for adenosine20 and suggests minimal involvement of the triphosphate group in binding, in agreement with structural studies.49 Similarities in binding properties across this set of in vitro selected aptamers suggest that selection procedures and target structure influence resulting affinity and kinetic properties. The rank order in selection immobilization concentration is consistent with the KD for six of these seven aptamers, with a strong positive correlation for five (R2 = 0.99) (Figure S4 of the Supporting Information). This correlation underscores the significant impact that selection parameters have on resulting aptamer binding properties, suggesting that optimized in vitro selection procedures may improve resulting aptamer affinities through increased selection stringency.
Five aptamer domains from natural riboswitches were also characterized: the Vibrio cholerae c-di-GMP class I riboswitch,21 the Clostridium difficile c-di-GMP class II riboswitch,22 domain II of the V. cholerae glycine riboswitch,23 the Thi1 domain of the Bacillus anthracis TPP riboswitch,24 and the minimal Escherichia coli thiM TPP riboswitch25 (Table 1). With the exception of the c-di-GMP class II domain, the remaining natural aptamers approach equilibrium slowly (>180 s) (Figure S2 of the Supporting Information) and, consequently, KD,equilibrium values could not be accurately obtained. Most affinity characterization methods rely on the assumption that equilibrium has been reached but, unlike SPR, do not provide a means for confirmation and therefore risk incomplete binding.34 Three of the natural aptamers tested exhibited subnanomolar to nanomolar KD’s, demonstrating the high affinities achievable for RNA–small molecule interactions.
Class I and class II c-di-GMP riboswitch domains do not share sequence or structural homology and employ distinct target recognition mechanisms.50 The class I domain exhibits the tightest reported KD for an RNA–small molecule interaction.34 However, this value is inconsistent with other reported KD values that are at least 100-fold higher;21,51,52 some of this variation may result from the use of modified sequences in a flexible stem loop in different studies. The ka at 5 mM MgCl2 of the class I domain differs by only 1.4-fold from the 1.7 × 10⁴ M–1 s–1 reported at 10 mM MgCl2.34 In contrast, its kd is 120-fold greater than the 1.8 × 10⁻⁷ s–1 reported,34 potentially signaling differential Mg2+ sensitivity between the binding rates of the class I domain. Our characterization provides the first kinetic analysis of the class II domain. Comparing both classes, the class II domain has a 6.9-fold higher ka, 420-fold higher kd, and a 61-fold higher KD. These differences in kinetic and affinity properties may allow differential biological regulatory functions in response to the same small molecule input.50
With only 10 atoms, glycine is one of the smallest targets for a nucleic acid–small molecule interaction and was selected to test method sensitivity. Characterized at 5 mM MgCl2, the KD (200 ± 120 μM) of the glycine aptamer is consistent with previous reports, in between 45.9 μM measured at 10 mM MgCl2 and greater than 1 mM measured at 2 mM MgCl2.53 The glycine riboswitch is highly sensitive to Mg2+ concentration, with an approximate 300-fold increase in KD with a 10-fold drop in Mg2+ concentration.53 To confirm this divalent ion sensitivity, we tested the glycine aptamer at 20 mM MgCl2 and obtained a KD of 3.5 ± 1.0 μM, consistent with the value of 3.5 μM obtained by ITC.53 Its KD decreases by 58-fold with a 4-fold increase in Mg2+ concentration, asymmetrically comprising a 26-fold increase in ka and 2.2-fold decrease in kd. Our study provides the first kinetic analysis for this riboswitch domain and observation of the differential effects of Mg2+ concentration on its kinetic parameters.
In-line probing experiments observed a 140-fold difference in KD between the Thi1 and thiM TPP aptamers under identical buffer conditions with 20 mM MgCl2.24,25 However, with our method at 5 mM MgCl2, these aptamers showed nearly equivalent KD’s, differing by only 1.6-fold and possibly indicating differential Mg2+ sensitivity between these sequences. Both TPP aptamers demonstrate similar binding rates, with thiM exhibiting a 2.7-fold greater ka and 1.7-fold greater kd. Their comparable binding properties are not unexpected, as they share conserved nucleotides and similar structural architectures.54 The thiMka is consistent with its rate for aptamer folding upon TPP binding.32 The thiMKD is below previously reported values by ITC38 and in-line probing25 conducted at different Mg2+ concentrations; however, the ITC experiments reported difficulty measuring the KD due to a steep binding transition under conditions needed to generate sufficient heat for measurement.38 In addition, kinetic values obtained for both TPP aptamers closely agree with the E. colithiC TPP aptamer’s ka and kd of 1.26 × 10⁵ M–1 s–1 and 2.9 × 10⁻⁴ s–1, respectively,36 further supporting the shared binding characteristics of this family of riboswitches.
The described SPR-based characterization platform presents several advantages over traditional aptamer characterization methods. The high-throughput process can be automated and accurately measures a wide range of KD’s. Traditional methods are often limited to KD measurements in the nanomolar range,37 whereas SPR is capable of measuring much lower values.55 With other methods, nonspecific binding is difficult to decouple from target-specific binding.56 In contrast, nonspecific interactions with the SPR surface can be measured and accounted for using a reference flow cell. Furthermore, other methods may not accurately measure KD if the approach to complex equilibrium is slow and equilibrium is not reached in the timeframe of the assay.34 The SPR-based assay monitors binding response in realtime and supports both kinetic and equilibrium analyses; the use of two approaches allows for more confident measurement of KD. Emphasizing this platform’s consistency, KD,kinetic and KD,equilibrium values measured for the same target differ no more than 2.1-fold from one another. Similarly, all KD,kinetic and KD,equilibrium values measured differ no more than 2.2-fold from the nearest previously reported KD at identical Mg2+ concentration.
Our aptamer characterization assay addresses many limitations of previously reported SPR-based methods. The described method covalently immobilizes a DNA linker to a chemically resistant dextran-based sensor surface, and the resulting sensor chips are stable for approximately 500 assay cycles. Most importantly, the dextran-based surface offers more reactive sites than streptavidin-based surfaces for immobilizing the DNA linker, increasing the method’s sensitivity by increasing aptamer capture levels and resulting small molecule binding signals. Furthermore, this platform can be directly extended to protein targets and aptamers containing modified nucleotides or expanded genetic alphabets.
A few limitations of our SPR-based assay are important to note. Aptamer capture via hybridization requires adding a 3′ poly(A) linker. However, the linker is not expected to affect aptamer folding or target binding and may be moved to the 5′ end or have its sequence altered with a corresponding change in the DNA linker. As many biosensor platforms immobilize aptamers through a linker-hybridized strategy,57 performing our assay using a similar setup may streamline integration of aptamers directly into biosensing platforms. The high density surface used to maximize small molecule binding response has the potential to facilitate rebinding events or limit mass transport and thereby affect kinetic measurements; however, the high flow rate58 used reduces the likelihood of target rebinding or mass transport limitation. Lastly, our method does not provide structural, enthalpic, or mechanistic details on aptamer folding and binding, which can be obtained using complementary techniques such as chemical probing, crystallography, nuclear magnetic resonance spectroscopy, ITC, or single-molecule studies.
Conclusion
Traditional aptamer characterization methods are limited in their throughput, scalability, and information content and have contributed to the lack of development, adoption, and application of novel aptamers.59 To address this limitation, we developed and validated a high-throughput and scalable SPR-based strategy for characterizing aptamer binding to small molecules. Using this platform, we characterized 12 aptamer–small molecule pairs that display a range of molecular weights, compositions, and affinities. To our knowledge, this study is the first kinetic binding characterization of the flavin mononucleotide, malachite green, c-di-GMP class II, glycine, Thi1 TPP, and thiM TPP aptamers and first affinity characterization of a minimal tyrosine aptamer and unmodified DNA aptamer for ATP. This analysis is the first characterization of a diverse and large subset of small molecule–aptamer pairs using a single platform under identical conditions.
Our aptamer characterization strategy supports the rapid characterization of aptamer binding properties and can be readily coupled to in vitro selection strategies to (a) screen selection libraries, (b) characterize functional sequences, (c) identify minimal binding sequences, (d) perform mutagenic analysis, (e) determine binding specificity, and (f) assess binding under varying environmental conditions. In combination with structural studies, this method can provide information on riboswitch binding at physiological conditions and guide our understanding of riboswitch function.
Development of standard practices for aptamer selection, characterization, and platform integration would extend their application beyond the small subset of aptamers used in proof-of-concept studies and accelerate the associated design cycle.4,14 For example, approximately 60 small molecule-binding RNA aptamers have been selected and characterized in vitro,2 yet theophylline overwhelmingly remains the sensing component used for in vivo engineered RNA-based gene regulatory devices.13 Aptamer candidates could be functionally validated with our platform under relevant conditions and included within libraries of standard biological parts.60 Validated RNA aptamer sensors can then be more reliably coupled to methods for engineering RNA devices61 and multicomponent systems to extend their use in synthetic biology applications. Thus, the described SPR-based aptamer characterization platform provides a versatile and powerful characterization tool that can be integrated with aptamer selection to advance functional nucleic acid design.
Acknowledgments
We thank A. Hill and A. Kennedy for helpful discussions. This work was supported by funds from the National Institutes of Health (grant to C.D.S.), National Science Foundation (grant to C.D.S.), Defense Advanced Research Projects Agency (grant to C.D.S.), Bill & Melinda Gates Foundation (grant to C.D.S.), and Natural Sciences and Engineering Research Council of Canada (postdoctoral fellowship to M.M.).
Supporting Information Available
Additional materials and methods; Figures S1, S2, S3, and S4; and Table S1. This material is available free of charge via the Internet at http://pubs.acs.org.
Author Contributions
§ The first two authors contributed equally. A.L.C. and M.M. designed and performed experiments, analyzed data, and wrote the article; J.C.L. contributed to the binding assay development; C.D.S. designed experiments, analyzed data, and wrote the article.
The authors declare no competing financial interest.
Funding Statement
National Institutes of Health, United States
Supplementary Material
References
- Stoltenburg R.; Reinemann C.; Strehlitz B. Biomol. Eng. 2007, 24, 381–403. [DOI] [PubMed] [Google Scholar]
- McKeague M.; Derosa M. C. J. Nucleic Acids 2012, 2012, 748913. [DOI] [PMC free article] [PubMed] [Google Scholar]
- Serganov A.; Patel D. J. Annu. Rev. Biophys. 2012, 41, 343–370. [DOI] [PMC free article] [PubMed] [Google Scholar]
- Cho E. J.; Lee J.-W.; Ellington A. D. Annu. Rev. Anal. Chem. 2009, 2, 241–264. [DOI] [PubMed] [Google Scholar]
- Keefe A. D.; Pai S.; Ellington A. Nat. Rev. Drug Discovery 2010, 9, 537–550. [DOI] [PMC free article] [PubMed] [Google Scholar]
- Lünse C. E.; Schüller A.; Mayer G. Int. J. Med. Microbiol. 2014, 304, 79–92. [DOI] [PubMed] [Google Scholar]
- Zhang Y.; Hong H.; Cai W. Curr. Med. Chem. 2011, 18, 4185–4194. [DOI] [PMC free article] [PubMed] [Google Scholar]
- Bastian A. A.; Marcozzi A.; Herrmann A. Nat. Chem. 2012, 4, 789–793. [DOI] [PubMed] [Google Scholar]
- Strack R. L.; Song W.; Jaffrey S. R. Nat. Protoc. 2014, 9, 146–155. [DOI] [PMC free article] [PubMed] [Google Scholar]
- Delebecque C. J.; Lindner A. B.; Silver P. A.; Aldaye F. A. Science 2011, 333, 470–474. [DOI] [PubMed] [Google Scholar]
- Michener J. K.; Smolke C. D. Metab. Eng. 2012, 14, 306–316. [DOI] [PubMed] [Google Scholar]
- Yang J.; Seo S. W.; Jang S.; Shin S.-I.; Lim C. H.; Roh T.-Y.; Jung G. Y. Nat. Commun. 2013, 4, 1413. [DOI] [PubMed] [Google Scholar]
- Chang A. L.; Wolf J. J.; Smolke C. D. Curr. Opin. Biotechnol. 2012, 23, 679–688. [DOI] [PMC free article] [PubMed] [Google Scholar]
- Mascini M.; Palchetti I.; Tombelli S. Angew. Chem. 2012, 51, 1316–1332. [DOI] [PubMed] [Google Scholar]
- Famulok M. J. Am. Chem. Soc. 1994, 116, 1698–1706. [Google Scholar]
- Burgstaller P.; Famulok M. Angew. Chem., Int. Ed. Engl. 1994, 33, 1084–1087. [Google Scholar]
- Mannironi C.; Scerch C.; Fruscoloni P.; Tocchini-Valentini G. P. RNA 2000, 6, 520–527. [DOI] [PMC free article] [PubMed] [Google Scholar]
- Jhaveri S. D.; Kirby R.; Conrad R.; Maglott E. J.; Bowser M.; Kennedy R. T.; Glick G.; Ellington A. D. J. Am. Chem. Soc. 2000, 122, 2469–2473. [Google Scholar]
- Jenison R. D.; Gill S. C.; Pardi A.; Polisky B. Science 1994, 263, 1425–1429. [DOI] [PubMed] [Google Scholar]
- Huizenga D. E.; Szostak J. W. Biochemistry 1995, 34, 656–665. [DOI] [PubMed] [Google Scholar]
- Sudarsan N.; Lee E. R.; Weinberg Z.; Moy R. H.; Kim J. N.; Link K. H.; Breaker R. R. Science 2008, 321, 411–413. [DOI] [PMC free article] [PubMed] [Google Scholar]
- Lee E. R.; Baker J. L.; Weinberg Z.; Sudarsan N.; Breaker R. R. Science 2010, 329, 845–848. [DOI] [PMC free article] [PubMed] [Google Scholar]
- Mandal M.; Lee M.; Barrick J. E.; Weinberg Z.; Emilsson G. M.; Ruzzo W. L.; Breaker R. R. Science 2004, 306, 275–279. [DOI] [PubMed] [Google Scholar]
- Welz R.; Breaker R. R. RNA 2007, 13, 573–582. [DOI] [PMC free article] [PubMed] [Google Scholar]
- Winkler W.; Nahvi A.; Breaker R. R. Nature 2002, 419, 952–956. [DOI] [PubMed] [Google Scholar]
- Mandal M.; Boese B.; Barrick J. E.; Winkler W. C.; Breaker R. R. Cell 2003, 113, 577–586. [DOI] [PubMed] [Google Scholar]
- Wickiser J. K.; Cheah M. T.; Breaker R. R.; Crothers D. M. Biochemistry 2005, 44, 13404–13414. [DOI] [PubMed] [Google Scholar]
- Grate D.; Wilson C. Proc. Natl. Acad. Sci. U.S.A. 1999, 96, 6131–6136. [DOI] [PMC free article] [PubMed] [Google Scholar]
- Wang T.; Hoy J. A.; Lamm M. H.; Nilsen-Hamilton M. J. Am. Chem. Soc. 2009, 131, 14747–14755. [DOI] [PubMed] [Google Scholar]
- Babendure J. R.; Adams S. R.; Tsien R. Y. J. Am. Chem. Soc. 2003, 125, 14716–14717. [DOI] [PubMed] [Google Scholar]
- Jucker F. M.; Phillips R. M.; McCallum S. A.; Pardi A. Biochemistry 2003, 42, 2560–2567. [DOI] [PubMed] [Google Scholar]
- Lang K.; Rieder R.; Micura R. Nucleic Acids Res. 2007, 35, 5370–5378. [DOI] [PMC free article] [PubMed] [Google Scholar]
- Elenko M. P.; Szostak J. W.; van Oijen A. M. J. Am. Chem. Soc. 2009, 131, 9866–9867. [DOI] [PMC free article] [PubMed] [Google Scholar]
- Smith K. D.; Lipchock S. V.; Ames T. D.; Wang J.; Breaker R. R.; Strobel S. A. Nat. Struct. Mol. Biol. 2009, 16, 1218–1223. [DOI] [PMC free article] [PubMed] [Google Scholar]
- Sokoloski J. E.; Dombrowski S. E.; Bevilacqua P. C. Biochemistry 2012, 51, 565–572. [DOI] [PMC free article] [PubMed] [Google Scholar]
- Burnouf D.; Ennifar E.; Guedich S.; Puffer B.; Hoffmann G.; Bec G.; Disdier F.; Baltzinger M.; Dumas P. J. Am. Chem. Soc. 2012, 134, 559–565. [DOI] [PubMed] [Google Scholar]
- Jing M.; Bowser M. T. Anal. Chim. Acta 2011, 686, 9–18. [DOI] [PMC free article] [PubMed] [Google Scholar]
- Kulshina N.; Edwards T. E.; Ferre-D’Amare A. R. RNA 2010, 16, 186–196. [DOI] [PMC free article] [PubMed] [Google Scholar]
- Polonschii C.; David S.; Tombelli S.; Mascini M.; Gheorghiu M. Talanta 2010, 80, 2157–2164. [DOI] [PubMed] [Google Scholar]
- Cannon M. J.; Papalia G. A.; et al. Anal. Biochem. 2004, 330, 98–113. [DOI] [PubMed] [Google Scholar]
- Win M. N.; Klein J. S.; Smolke C. D. Nucleic Acids Res. 2006, 34, 5670–5682. [DOI] [PMC free article] [PubMed] [Google Scholar]
- Di Primo C.; Dausse E.; Toulme J. J. Methods Mol Biol 2011, 764, 279–300. [DOI] [PubMed] [Google Scholar]
- Katsamba P. S.; Park S.; Laird-Offringa I. A. Methods 2002, 26, 95–104. [DOI] [PubMed] [Google Scholar]
- Shoji A.; Kuwahara M.; Ozaki H.; Sawai H. J. Am. Chem. Soc. 2007, 129, 1456–1464. [DOI] [PubMed] [Google Scholar]
- Da Costa J. B.; Andreiev A. I.; Dieckmann T. Biochemistry 2013, 52, 6575–6583. [DOI] [PubMed] [Google Scholar]
- Kellenberger C. A.; Wilson S. C.; Sales-Lee J.; Hammond M. C. J. Am. Chem. Soc. 2013, 135, 4906–4909. [DOI] [PMC free article] [PubMed] [Google Scholar]
- Stojanovic M. N.; Kolpashchikov D. M. J. Am. Chem. Soc. 2004, 126, 9266–9270. [DOI] [PubMed] [Google Scholar]
- Biacore X100, AA ed.; 28-9592-29 data file, GE Healthcare Bio-Sciences AB: Uppsala, Sweden, 2009.
- Lin C. H.; Patel D. J. Chem. Biol. 1997, 4, 817–832. [DOI] [PubMed] [Google Scholar]
- Smith K. D.; Shanahan C. A.; Moore E. L.; Simon A. C.; Strobel S. A. Proc. Natl. Acad. Sci. U.S.A. 2011, 108, 7757–7762. [DOI] [PMC free article] [PubMed] [Google Scholar]
- Wood S.; Ferre-D’Amare A. R.; Rueda D. ACS Chem. Biol. 2012, 7, 920–927. [DOI] [PMC free article] [PubMed] [Google Scholar]
- Luo Y.; Zhou J.; Wang J.; Dayie T. K.; Sintim H. O. Mol. BioSyst. 2013, 9, 1535–1539. [DOI] [PubMed] [Google Scholar]
- Huang L.; Serganov A.; Patel D. J. Molecular Cell 2010, 40, 774–786. [DOI] [PMC free article] [PubMed] [Google Scholar]
- Miranda-Ríos J. Structure 2007, 15, 259–265. [DOI] [PubMed] [Google Scholar]
- Tsuji S.; Tanaka T.; Hirabayashi N.; Kato S.; Akitomi J.; Egashira H.; Waga I.; Ohtsu T. Biochem. Biophys. Res. Commun. 2009, 386, 227–231. [DOI] [PubMed] [Google Scholar]
- McKeague M.; Bradley C. R.; De Girolamo A.; Visconti A.; Miller J. D.; DeRosa M. C. Int. J. Mol. Sci. 2010, 11, 4864–4881. [DOI] [PMC free article] [PubMed] [Google Scholar]
- Han K.; Liang Z.; Zhou N. Sensors 2010, 10, 4541–4557. [DOI] [PMC free article] [PubMed] [Google Scholar]
- Katsamba P. S.; Myszka D. G.; Laird-Offringa I. A. J. Biol. Chem. 2001, 276, 21476–21481. [DOI] [PubMed] [Google Scholar]
- Cho M.; Soo Oh S.; Nie J.; Stewart R.; Eisenstein M.; Chambers J.; Marth J. D.; Walker F.; Thomson J. A.; Soh H. T. Proc. Natl. Acad. Sci. U.S.A. 2013, 110, 18460–18465. [DOI] [PMC free article] [PubMed] [Google Scholar]
- Canton B.; Labno A.; Endy D. Nat. Biotechnol. 2008, 26, 787–793. [DOI] [PubMed] [Google Scholar]
- Liang J. C.; Chang A. L.; Kennedy A. B.; Smolke C. D. Nucleic Acids Res. 2012, 40, e154. [DOI] [PMC free article] [PubMed] [Google Scholar]
Associated Data
This section collects any data citations, data availability statements, or supplementary materials included in this article.