Abstract
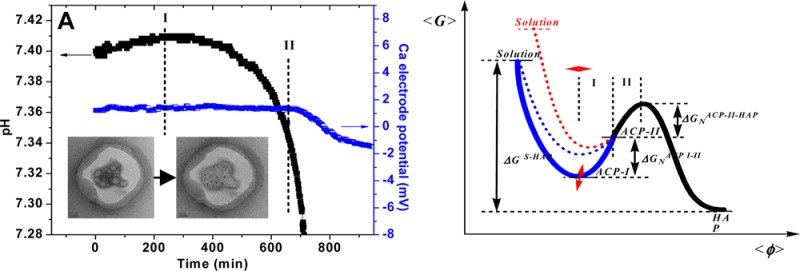
Hydroxyapatite (HAP) participates in vertebral bone and tooth formation by a nonclassical hitherto unknown nucleation mechanism, in which amorphous precursors form and transform during long induction periods. Elucidation of the mechanism by which amorphous precursors assemble and transform is essential to understanding how hard tissues form in vivo and will advance the design and fabrication of new biomaterials. The combination of conductance and potentiometric techniques to monitor Ca–P mineral formation has given new insight into the mechanism of nucleation. Differences detected in the dehydration rates of calcium and phosphate ions indicate the formation of nonequilibrium calcium-deficient clusters. The aggregation of these clusters forms a calcium-deficient amorphous phase I [Ca-(HPO4)1+x·nH2O]2x−) early in the induction period, which slowly transforms to amorphous phase II [Ca-(HPO4)·mH2O] by dehydration. Precritical nuclei form within amorphous phase II later in the induction period, leading to mineral formation.
Short abstract
The aggregation of calcium phosphate forms a calcium-deficient amorphous phase I [Ca-(HPO4)1+x·nH2O]2x) early in the induction period, which slowly transforms to amorphous phase II [Ca-(HPO4)·mH2O] by dehydration. Precritical nuclei form within amorphous phase II later in the induction period, leading to mineral formation.
Introduction
Calcium phosphates (Ca–P) are of great importance in biomineralization and environmental sciences. Hydroxyapatite [Ca10(PO4)6(OH)2] is the most widely investigated Ca–P mineral and is the main constituent of teeth and bones.1,2 Its many functional properties allow a wide range of applications such as hard tissue analogues,3,4 catalysts,5,6 liquid-chromatographic columns,7,8 chemical sensors,9 and it has become a promising candidate as a heavy metal sequestration agent in wastewater treatment.10,11 Biological mechanisms of hydroxyapatite formation have attracted recent attention in fields ranging from biology and chemistry to materials science and bioengineering.12,13 Elucidation of the mechanism of formation is important not only for design and fabrication of advanced biomaterials but also for a clearer understanding of how hard tissues are created in vivo.14,15
In classical nucleation theory, crystal formation occurs from a critical nucleus formed by direct assembly of ions from solution, and it assumes that the composition and structure of the earliest precursors are the same as those of the final crystalline phase.16,17 The classical assumptions are challenged by recent studies of biomineral nucleation, in which weak acid anion complexes form and undergo phase transformation via a series of equilibrium reactions.18
Nucleation of HAP begins with the formation of amorphous calcium phosphate precursors (ACP), and a relatively long induction period precedes the appearance of nuclei.19−22 Posner’s clusters, Ca9(PO4)6,23 have been proposed as the initial ACP building blocks.24,25 In contrast, recent constant composition (CC) nucleation results obtained with high pH resolution (0.001 pH unit) have enabled the detection of small but reproducible increases in pH early in the induction period (Figure S1 of the Supporting Information).26 Much of the previous work on HAP mineralization was done with solutions at a high supersaturation and in the presence of atmospheric carbon dioxide. These techniques result in rapid mineralization, with far less control than the CC methods. The presence of CO2 affects pH and calcium ion activity, both of which are known to influence Ca–P mineral formation.
It is difficult to elucidate the mechanism of nucleation, especially the pathway of crystallization from solvated ions to final apatitic mineral. The investigation has been designed to study the events that occur in early stages of Ca–P nucleation and to help elucidate the mechanism of formation of HAP. A new in situ method has been developed by combining pH measurements, calcium ion activity selective electrodes, and conductivity measurements to obtain much greater sensitivity in monitoring ionic interactions. During nucleation, all ionized species present in the reaction media were monitored rather than simply the hydrogen ions. The formation and transformation of amorphous precursor was observed during the early induction stages, providing a new deeper understanding of early nucleation events. A novel two-step nonclassical nucleation mechanism of hydroxyapatite was proposed involving two amorphous phases.
Experimental Section
New Conductance and Potentiometric Techniques for Monitoring Nucleation
Hitherto, homogeneous and heterogeneous nucleation experiments involved the potentiometric monitoring of the hydrogen ion activities (0.001 pH resolution) associated with the nucleation events.27−29 The new method adds calcium ion activity selective electrodes and conductivity measurements, encompassing all ionized species in the reaction media. This provides an increased sensitivity in monitoring ionic interactions during nucleation. The formation of interacting ion pairs in the solutions results in a reduction of specific conductance as the charge-carrying species interact; this additional information on the onset of nucleation provides unique kinetic data of formation of the Ca–P intermediate mineral phase.
Preparation of Solutions
Calcium chloride dihydrate (CaCl2·2H2O) was purchased from OmniPur (purity ≥ 99.0%, lot no. G07000246A) and potassium dihydrogen phosphate (KH2PO4) was purchased from J.T. Baker (purity ≥ 99.7%, lot no. H08479). Other chemical reagents were of analytical grade and purchased from J.T. Baker. Water was deionized and triply distilled before use. Solutions used in this study were prepared fresh and filtered twice through 50 nm pore size filters (SterliTech, lot no. 37682). The concentration of calcium stock solution was determined by EDTA titration.
HAP Nucleation Experiments
Experiments were made in 150 mL aliquots, pH 7.400, at 37.0 ± 0.1 °C in magnetically stirred double-walled 250 mL Pyrex vessels. The relative supersaturation, σ, and supersaturation ratio, S, are given by eq 1:
| 1 |
in which ν (=18) is the number of ions in a formula unit of HAP, and IAP and Ksp are the ionic activity and thermodynamic solubility products (Ksp = 5.52 × 10–118 mol18 L–18 at 37.0 °C), respectively. Solution speciation calculations were made using the extended Debye–Hückel equation proposed by Davies.30,31
Supersaturated solutions were prepared by the slow mixing of sodium chloride (NaCl), potassium dihydrogen phosphate (KH2PO4), potassium hydroxide (KOH), and calcium chloride (CaCl2) stock solutions ([Ca2+] = 0.045 M). The solution composition for different supersaturation experiments was shown in Table 1. To avoid a high local supersaturation as a result of the rapid mixing, a slower addition rate (200 μL/min; Brinkmann Metrohm 775 Dosimat) was used for the addition of Ca2+ to the reaction solution. CO2 was purged from the reaction vessel by constant bubbling of pure, presaturated, N2 gas (>2h) into both reaction solutions and calcium chloride stock solution prior to mixing. The pH and calcium ion activities were monitored during crystallization experiments. The pH electrode (Orion 91-01 ± 0.1 mv) and calcium ion selective electrode (Orion 93-20 ± 0.1 mv) were coupled with a single-junction Ag/AgCl reference electrode (Orion 90-01). Conductivity changes were monitored by a Fisher Scientific conductivity electrode. The resolution of the conductivity electrode was 0.01 μS/cm. The pH electrode was calibrated weekly utilizing pH = 6.841 and pH = 7.385 phosphate buffers; the Ca2+ electrode was calibrated daily.
Table 1. Solution Composition for Different Supersaturation Experiments and Species Concentration at Equilibrium Condition (pH = 7.400, Ionic Strength (I.S.) = 0.006 M, T = 37.0 °C) Obtained by Species Calculation Programs.
| σHAP | [Ca] (mM) | [P] (mM) | [CaH2PO4] (mM) | [CaHPO4] (mM) | [CaPO4] (mM) |
|---|---|---|---|---|---|
| 18.5 | 1.11 | 0.66 | 3.45 × 10–03 | 1.10 × 10–01 | 4.75 × 10–03 |
| 19.5 | 1.18 | 0.71 | 3.86 × 10–03 | 1.23 × 10–01 | 5.32 × 10–03 |
| 20.0 | 1.22 | 0.73 | 4.07 × 10–03 | 1.29 × 10–01 | 5.60 × 10–03 |
Precipitates, separated by filtration (50 nm pore size) were dried and sputter-coated with graphite under vacuum prior to examination by field-emission scanning electron microscopy (SEM, Hitachi SU-70) at 20Kev.
Direct in situ monitoring of the evolution of ACP in aqueous solution is a challenge, due to the instability of ACP and the lack of a proper technique for characterization in solution. An ex situ approach was adopted; samples were captured by micropipet from the reaction solution (σHAP of 19.5), and a small drop placed on Formvar-carbon-coated copper grids. The sample was then dried in an oven (70.0 Co) before final characterization by electron microscopy. Transmission electron microscopy (TEM) investigations of nucleated particles removed at various time intervals were carried out using a JEOL-2010 TEM at an accelerating voltage of 200 kv. The elemental analysis was performed using X-ray photoelectron spectrometry (XPS SSX-100) at 10–9 to 10–10 Torr.
Results and Dissusion
The nucleation experiments were made in an N2 environment and were initiated by the slow addition of calcium stock solution [0.045 M]. Prior to the addition of calcium (Figure 1a, 1270–1290 min), pH remained constant (Figure 1a, 0–1270 min) and a small but non-negligible pH increase (ΔpH ≈ 0.010) was clearly observed after the addition (Figure 1a, 1290–1480 min). Since the pH is a function of the molar ratio of HPO42–/H2PO4–, it is suggested that the observed pH increase is associated with a reaction involving either the release of HPO42– ions to the reaction solution or the association of H2PO4– with complexes in solution. The reproducible pH increase during the initial stage of Ca–P nucleation has never previously been noted (Figure 1a, 1270–1480), and the results confirm its association with Ca–P prenucleation clusters.
Figure 1.
Potentiometric and conductance monitoring of HAP nucleation. The figures in the left column have been expended for detail and are presented in the right column. (a) pH changes in HAP nucleation experiment with relative supersaturation σHAP = 20.0. (b) No calcium was added for 1270 min after pH monitoring began to ensure electrode stability. (c) pH (black), calcium electrode potential (blue), and electrical conductance (red) changes during HAP nucleation with time 0 corresponding to the moment calcium addition was complete (σHAP = 19.5, I.S. = 0.006 M, and starting pH = 7.40 at 37.0 °C).
The combined pH, conductivity, and calcium ion activity results indicate that the induction period can be divided into two stages: an early nucleation period (stage I, from 0 to 300 min) and a later nucleation stage (stage II, from 300 to 650 min) (Figure 1, panels b and c). During induction stage I, an increase in solution conductivity was observed (about 3.5 ± 0.1 μS/cm) in conjunction with the observed pH increase. The start of stage II is identified as the pH maximum, during which change in solution conductivity and pH slows and both begin to decrease (Figure 1c). The concentration of the free calcium ion remained constant during the induction time (Figure 1c). An increase in the solution conductivity indicates an increase in the total ion concentration. It is suggested that ion pairing of HPO42– and Ca2+ occurs rapidly as the Ca2+ is added to the reaction solution; this forms a calcium-deficient complex (time 1290 min, Figure 1a; time 0 min, Figure 1, panels b and c) comprised of hydrated calcium ions and protonated phosphate ions. Some HPO42– is released as interactions between phosphate and calcium ion increase. This release is observed when pH and conductivity increase, stage I (time 0–300 min, Figure 1, panels b and c). The slow decrease in pH and conductivity during stage II has been associated with deprotonation.
The precipitates were collected by filtration (pore size of 50 nm) at different time intervals; the samples were analyzed by high-resolution transmission electron microscopy (TEM), and selected area electron diffraction (SAED). Separated particles with a porous appearance, and a diameter of 25 nm were detected immediately after the addition of calcium to the reaction solution. Sample extraction was completed within 20 min of the start calcium addition (Figure 2a). Aggregation of these particles was observed at 120 min, the aggregates were collected and identified as amorphous (ACP-I) by SAED (Figure 2b). At 240 min (still in nucleation stage I), part of the aggregates underwent partial dehydration and a more dense structure was observed (Figure 2c). Sheet-like aggregates larger than 100 nm (ACP-II) containing electron dense regions (<10 nm) were observed after 400 min. SAED data indicated that most of the aggregates remained amorphous (ACP-II), but a small amount of crystalline domains developed within the amorphous phase (Figure 2d).32 It is noteworthy that the size of the amorphous aggregate increased to a maximum value prior to the observation of crystalline domains. Once these domains were observed, the size of the aggregates decreased as amorphous structures transformed to high-density precritical nuclei (Table S1 of the Supporting Information). The final random pearl-chain structure is detected at 600 min (Figure 2e). Characteristic diffraction of the (131) plane of HAP precritical nuclei was clearly observed (Figure 2f) after 600 min; at this point, the size of crystalline domains are still too small (<5 nm) to induce crystal growth. Crystal domains form within the amorphous aggregates; with time the overall diameter of the aggregate is reduced as the crystal domains increase in size and quantity. After 700 min, crystal growth is observed in conjunction with a large drop in pH, conductivity, and free calcium ion activity.
Figure 2.
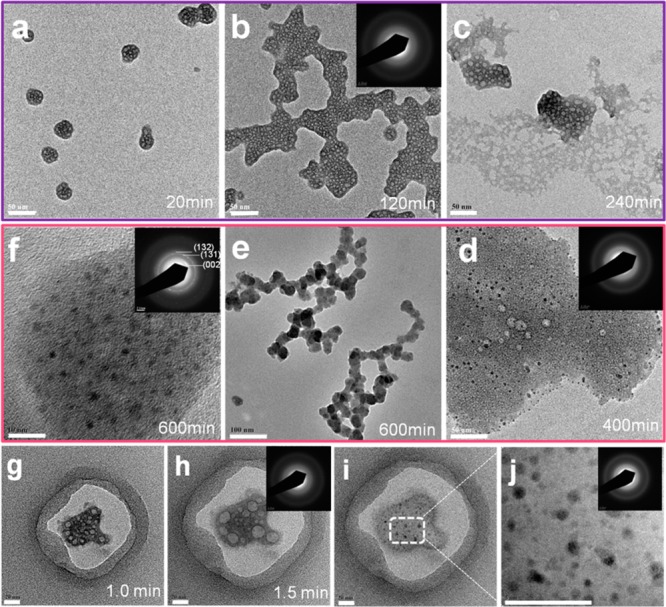
Phase and morphology evolution of calcium phosphate precipitates during the induction periods. TEM micrographs and SAED patterns of precipitates at (a–c) the early induction period and (d–f) the later induction period. (g–j) Morphology evolution from ACP-I to ACP-II phase under continuous electron irradiation for a same sample. Scale bar: (a–d) 50, (e) 100, (f) 10, and (g–j) 20 nm.
Changes in morphology similar to those in the precipitates from Ca–P nucleation experiments were observed when Ca–P samples were exposed to continuous electron irradiation under TEM. The dehydration of ACP-I (Figure 2, g–j) can be observed as the porous loose structure transforms to dense aggregates containing crystalline domains. The amorphous particles retained their porous morphology for 2.5 min. Throughout this time, an increase in pore size and a decrease in pore concentration was observed, likely caused by the electron bombardment. These nanoparticles had a porous morphology after drying due to their originally high hydration. After 4.0 min, crystalline domains with sizes less than 5 nm emerged; these had a similar morphology to samples taken from the nucleation reaction solution at 400 min (Figure 2d and Figure S2 of the Supporting Information). There was no particle breaking detected, as in dissolution–reprecipitation33 and solution-mediated transformation mechanisms.34 The very small precritical nuclei are metastable, and the number particles observed varies with time (Figure S2 of the Supporting Information).
TEM micrographs indicated that two different amorphous phases (ACP-I and ACP-II) existed in the early and later induction periods. The loose ACP-I nanoparticles formed when the initial solutions were mixed, and they coagulated into large aggregates in the early induction period accompanied by a small pH increase. During the later induction period, the denser ACP-II formed by dehydration and aggregation. The tiny crystalline domains formed within the ACP-II rather than only at the interparticle boundaries35 or the ACP–solution interface.36
In the early induction period, the EDX and XPS results showed distinct calcium and phosphate peaks. The Ca/P molar ratio of aggregates removed after 90 min was 0.62 (EDX). This ratio would increase with time throughout the induction period (Figure 3, and Figure S3 of the Supporting Information): 0.86 at 180 min, 1.01 at 400 min, and 1.20 at 600 min (XPS), indicating a calcium-deficient aggregate initially formed after the addition of calcium, at the start of stage-I. As the pH increases, the Ca/P molar ratio remains less than 1.0, ACP-I. As the change in pH slows, it begins to decrease and the ratio exceeds 1.0, corresponding to the formation of ACP-II (Figure 1b).
Figure 3.

Ca/P ratio of precipitates at different induction stages in HAP nucleation experiment (σHAP = 19.5). The Ca/P ratio based on the EDX and XPS results as shown in Figure S3 of the Supporting Information.
A calcium-deficient complex (ACP-I) with the empirical formula [Ca-(HPO4)1+x]2x is formed as Ca ions added to solution dehydrate and interact with phosphate ions (Figure 1a). For 200 min after the addition of calcium, the release of HPO42– (1290–1480 min, Figure 1a) by ACP-1 can be detected, as stoichiometric ACP-2 ([Ca-HPO4]) gradually forms. A pH maximum is detected as this process occurs (1480 min, Figure 1a); after this point crystal domains (<10 nm) can be observed forming inside the sheetlike aggregates of ACP-2 (Figure 2d). After the pH maximum is reached (1480–1700 min, Figure 1a), pH and conductivity began to decrease as deprotonation of ACP-2 occurs. A large drop in pH and free calcium concentration associated with crystal growth is observed after 1700 min (Figure 1a), after which point HAP crystals could be observed by microscopy (Table S2 of the Supporting Information).
Due to thermodynamic equilibrium among solvent and individual hydrated ions, the ion cluster will spontaneously form by ion association even in undersaturated solutions, and the dehydration process (release of water molecules from the hydration shell of ions) provides a substantial entropy gain favoring cluster formation.10 The reaction kinetics are strongly influenced by the ion dehydration rate, which is known to vary with ionic radius and electronic charge. The relative dehydration rate of hydrogen phosphate ions is much greater than that of calcium ions, accounting for the formation of calcium-deficient clusters. In supersaturated solutions, the nonequilibrium clusters aggregate to form relatively stable calcium-deficient complexes (ACP-I). This process is driven by a decrease in surface energy, and the kinetics of aggregation are dependent on the supersaturation of the starting solution. The rate of transformation from loose ACP-I to dense ACP-II is dictated by the dehydration and aggregation processes. After ACP-II is formed, the tiny precritical nuclei form within the ACP-II. The phase transformation from precritical nuclei to nuclei is a solid-to-solid transition, independent of the solution supersaturation.
When the nucleation experiment were done at supersaturation σHAP = 18.5, the total induction time increased from 650 to 950 min. The length of stage I increased from 300 to 580 min; stage-II was 350 min under both conditions (Figure 4). Stage I is defined as the length of time for Ca2+ addition until the reaction solution reaches a pH maximum; stage II is from this point until crystal growth is observed. The results indicated that the initial supersaturation affects the energy barrier of phase transformation from loose ACP-I to dense ACP-II. It is suggested ACP-II has an empirical formula of Ca-HPO4·nH2O, thus the free energy of formation is constant. The composition of ACP-I changes with time by the release of extra HPO42– ions in the dehydration process. The Gibbs free energy of ACP-I is not constant and is affected by the solution supersaturation. Throughout stage I, the free energy of ACP-I increases with the increase in the Ca/P ratio. During stage II, the phase free energy decreases as the precritical nuclei concentration increases over time; this indicates the formation of the ACP-II phase is an inflection point of the free energy profile, as shown in Figure 6a.
Figure 4.
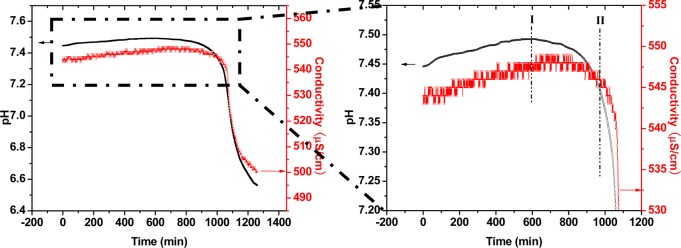
The initial driving force effects on the lifetime of amorphous phases. pH (black line) and electrical conductance (red line) changes during HAP nucleation under a relatively low supersaturation (σHAP = 18.5) prepared by the slow addition of calcium solution (I.S. = 0.006 M and starting pH = 7.40 at 37.0 °C).
Figure 6.
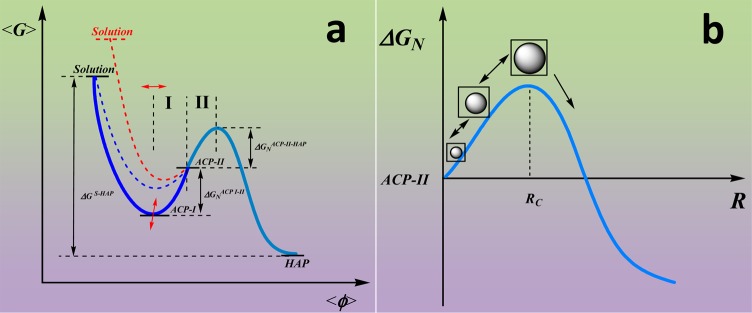
Schematic illustration of the Ca–P nonclassical nucleation mechanism. (a) The Relationship of free energy ⟨ΔG⟩ versus the extent of reaction ⟨Φ⟩. An Amorphous Ca–P complex (ACP-I) directly forms without thermodynamic barrier as the solutions are mixed. The composition and free energy of ACP-I are affected by the initial driving force (ΔGS-HAP) and the rate of addition. The ACP-I transforms to dense ACP-II phase by dehydration and aggregation in stage-I, followed by precritical nuclei formation within the ACP-II phase in stage-II. The nucleus formation rate is influenced by the activation energy for nucleation ΔGNACP-I–II and ΔGNACP-II-HAP. The blue dashed line reflects the results for fast addition of calcium, and the red dashed line for the experiment at higher supersaturation. (b) The relationship of the nucleation barrier ⟨ΔGN⟩ to the radius (R) of precritical nuclei formed in the ACP-II phase.
Hydrated calcium ions are added to the solution containing hydrogen phosphate ions. Dehydration must occur before ion association. The ion activity affects the dehydration rate. If calcium is added rapidly, the high local supersaturation will affect the dehydration process and influence ion association and the nucleation behavior. Replicate experiments were designed to investigate the effect of the rate of calcium solution addition; the rate of addition was varied from 9 to 90 μmol/min (Figure 5, panels a–c). A rapid pH increase once calcium ions are added to the reaction solution is observed; the pH increase is 30 min less (210 min, Figure 1b to 180 min, Figure 5a) when the calcium solution is added more quickly. The faster addition resulted in the change in pH increase (ΔpH ≈ 0.050) and decrease in the free calcium ion activity (Figure 5a,b). This result indicates that the more calcium-deficient clusters form during the faster addition due to the relatively slow dehydration rate of calcium ions. These clusters were not stable, and the rapid release of extra HPO42– resulted in a sharp increase in pH following the addition of calcium ions. The released HPO42– rapidly associates with free calcium ions in solution, resulting in a decrease in calcium activity and solution conductivity.
Figure 5.
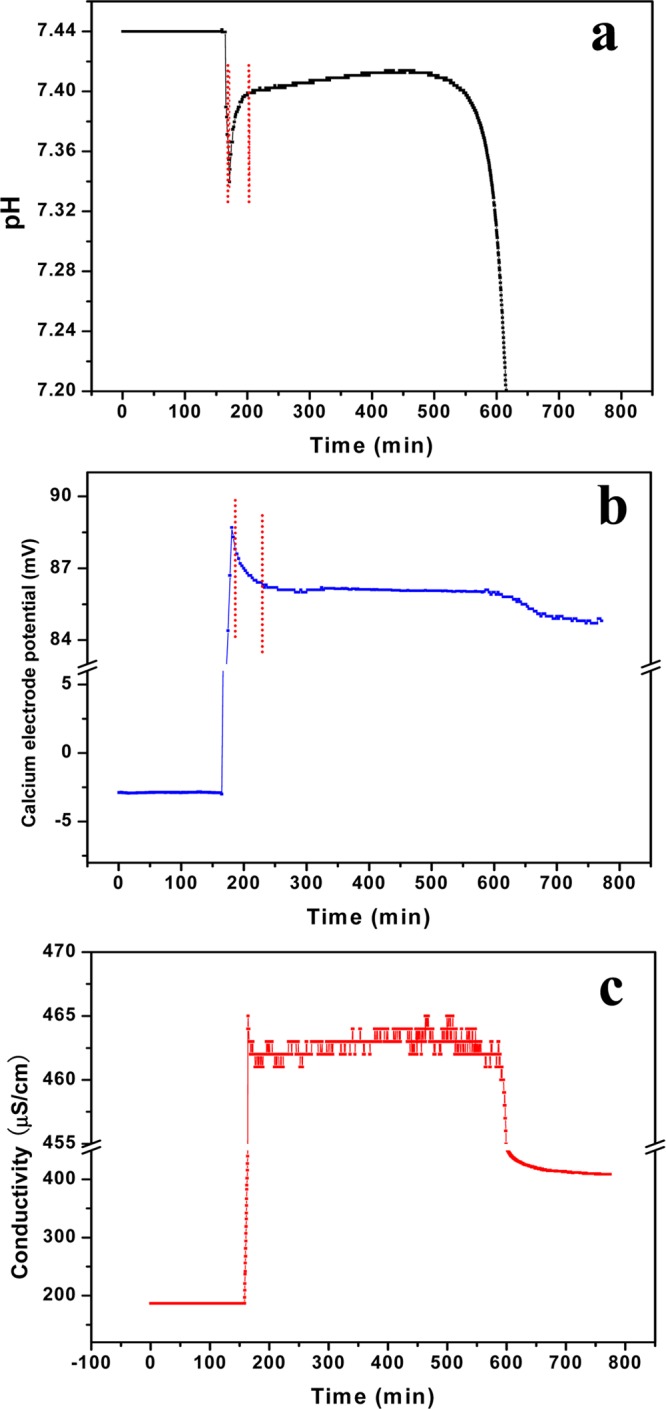
The influence of calcium solution addition rate on HAP nucleation. (a) pH, (b) calcium electrode potential, and (c) electrical conductance (σHAP = 19.5, I.S. = 0.006 M, pH = 7.40, 37.0 °C, and calcium solution addition rate = 2.0 mL/min).
On the basis of these findings, a new calcium phosphate nucleation mechanism was proposed (Figure 6). The hydrated phosphate and calcium ions are mixed forming ion clusters by dehydration. Strong interactions between calcium ions and water molecules results in the dehydration rate of calcium ions being much less than that of hydrogen phosphate ions. This causes the initial formation of calcium-deficient clusters [Ca-(HPO4)1+x·nH2O] 30 nm in size (Figure 1a). The clusters aggregate to form a nanosized amorphous phase (ACP-I) in the early induction period, releasing the excess hydrogen phosphate (Figure 2b). The composition and free energy of ACP-I are affected by the starting driving force (ΔGS-HAP) (Figure 4) and the addition rate of calcium ions to the reaction solution (Figure 5). A small increase in pH and conductivity is observed, as hydrolysis of the clusters [Ca-(HPO4)1+x·nH2O] results in the formation of stoichiometric ACP-II complexes [Ca-HPO4·mH2O] (Figure 1b, 0–300 min). Precritical nuclei (Ca3(PO4)2·H2O) (>10 nm) formed within the ACP-II (300 nm) prior to crystal growth via the deprotonation process accompanied by a pH decrease (Figure 2d). As the amount of precritical nuclei phase increases further, large stable nuclei (50 nm, Figure 2f) form and induce the crystal growth (Figure 6b).
Conclusion
In summary, the combined uses of electrical conductance, hydrogen ion selective electrode, and calcium ion selective electrodes provide a more accurate assessment of the induction period and the kinetics of amorphous precursor formation and transformation. Using the new conductance and potentiometric method, nucleation pathways of HAP have been investigated. For the first time, the nucleation stages of HAP have been monitored in situ from solvated ions to the final apatite mineral phase using a combination of electrochemical techniques. A calcium-deficient ACP-I [Ca-(HPO4)1+x·nH2O]2x has been identified as precursor to Ca–P nucleation, formed due to differences in the dehydration rate of hydrated calcium and phosphate ions. A transformation from ACP-I to a stoichiometric ACP-II phase [Ca-(HPO4)·mH2O] occurs as free calcium from solution associate with the clusters. The formation of precritical nuclei within ACP-II occurs by deprotonation in the later induction period. The composition and free energy of ACP-I varies with relative supersaturation. This study is a major step forward in understanding the earliest nucleation events in vitro and in vivo37 and provides details as to how additives may influence precursor formation in the early induction periods of Ca–P mineralization.
This study has revealed how precursors form and transform during the induction stages of HAP nucleation. The results challenge previous views on Posner’s clusters,23−25 as the initial precursor in tooth and bone biomineralization, and suggest that the interaction between amorphous precursor and organic additives plays a critical role in the regulation of biomineral formation in vivo. These results may also have general implications in a basic mechanism for biomineralization from biology and chemistry to materials science and bioengineerging and should contribute to improving methods for controlling carries formation and other dental diseases.
Acknowledgments
The presented work was supported by the National Institute of Dental and Craniofacial Research (NIDCR) Grant DE003223 to G.H.N.
Supporting Information Available
Typical pH change curve for HAP nucleation experiment with σHAP = 21.06, morphology evolution and phase transformation of ACP phase under TEM electron beam hitting for a same sample, and Ca/P ratio of precipitates obtained by EDX and XPS at different stages. This material is available free of charge via the Internet at http://pubs.acs.org.
Author Contributions
† B.X. and T.J.H. contributed equally.
The authors declare no competing financial interest.
Funding Statement
National Institutes of Health, United States
Supplementary Material
References
- Smith C. E. Crit. Rev. Oral Biol. Med. 1998, 92128–161. [DOI] [PubMed] [Google Scholar]
- Olszta M. J.; Cheng X.; Jee S. S.; Kumar R.; Kim Y. Y.; Kaufman M. J.; Douglas E. P.; Gower L. B. Mater. Sci. Eng., R 2007, 58, 77–116. [Google Scholar]
- Weiner S.; Wagner H. D. Annu. Rev. Mater. Sci. 1998, 28, 271–298. [Google Scholar]
- Park E.; Condrate R. A.; Lee D. Mater. Lett. 1998, 361–438–43. [Google Scholar]
- Borkiewicz O.; Rakovan J.; Cahill C. L. Am. Mineral. 2010, 958–91224–1236. [Google Scholar]
- Tanaka H.; Chikazawa M.; Kandori K.; Ishikawa T. Phys. Chem. Chem. Phys. 2000, 2112647–2650. [Google Scholar]
- Mahabole M. P.; Aiyer R. C.; Ramakrishna C. V.; Sreedhar B.; Khairnar R. S. Bull. Mater. Sci. 2005, 286535–545. [Google Scholar]
- Sharon C.; Furugoh S.; Yamakido T.; Ogawa H. I.; Kato Y. J. Ind. Microbiol. Biotechnol. 1998, 205304–307. [Google Scholar]
- Nagai M.; Nishino T.; Saeki T. Sens. Actuators 1988, 152145–151. [Google Scholar]
- Chen X. B.; Wright J. V.; Conca J. L.; Peurrung L. M. Environ. Sci. Technol. 1997, 313624–631. [Google Scholar]
- Ewing R. C.; Weber W. J.; Clinard F. W. Jr. Prog. Nucl. Energy 1995, 29263–127. [Google Scholar]
- Stupp S. I.; Braun P. V. Science 1997, 27753301242–1248. [DOI] [PubMed] [Google Scholar]
- Dey A.; Bomans P. H. H.; Mueller F. A.; Will J.; Frederik P. M.; de With G.; Sommerdijk N. A. J. M. Nat. Mater. 2010, 9121010–1014. [DOI] [PubMed] [Google Scholar]
- Heuer A. H.; Fink D. J.; Arias V. J.; Calvert P. D.; Kendali K.; Messing G. L.; Blackwell J.; Rieke P.; Thompson D.; Wheeler A. P.; Veis A.; Caplan A. I. Science 1992, 25550451098–1105. [DOI] [PubMed] [Google Scholar]
- Palmer L. C.; Newcomb C. J.; Kaltz S. R.; Spoerke E. D.; Stupp S. I. Chem. Rev. 2008, 108114754–4783. [DOI] [PMC free article] [PubMed] [Google Scholar]
- Pouget E. M.; Bomans P. H. H.; Goos J. A. C. M.; Frederik P. M.; With G. d.; Sommerdijk N. A. J. M. Science 2009, 323131455–1458. [DOI] [PubMed] [Google Scholar]
- Laaksonen A.; Talanquer V.; Oxtoby D. W. Annu. Rev. Phys. Chem. 1995, 46, 489–524. [DOI] [PubMed] [Google Scholar]
- Meldrum F. C.; Sear R. P. Science 2008, 322, 1802–1803. [DOI] [PubMed] [Google Scholar]
- Wang L.; Nancollas G. H. Chem. Rev. 2008, 108114628–4669. [DOI] [PMC free article] [PubMed] [Google Scholar]
- Zhang T. H.; Liu X. Y. Angew. Chem., Int. Ed. 2009, 4871308–1312. [DOI] [PubMed] [Google Scholar]
- Gebauer D.; Voelkel A.; Coelfen H. Science 2008, 32259091819–1822. [DOI] [PubMed] [Google Scholar]
- Yang X. D.; Xie B. Q.; Wang L. J.; Qin Y. L.; Henneman Z. J.; Nancollas G. H. CrystEngComm 2011, 1341153–1158. [Google Scholar]
- Betts F.; Blumenthal N. C.; Posner A. S.; Becker G. L.; Lehninger A. L. Proc. Natl. Acad. Sci. U.S.A. 1975, 7262088–2090. [DOI] [PMC free article] [PubMed] [Google Scholar]
- Combes C.; Rey C. Acta Biomaterialia 2010, 6, 3362–3378. [DOI] [PubMed] [Google Scholar]
- Dorozhkin S. V. Acta Biomater. 2010, 6, 4457–4475. [DOI] [PubMed] [Google Scholar]
- Yang X.; Wang L.; Qin Y.; Sun Z.; Henneman Z. J.; Moradian-Oldak J.; Nancollas G. H. J. Phys. Chem. B 2010, 11462293–2300. [DOI] [PMC free article] [PubMed] [Google Scholar]
- Wang L.; Guan X.; Du C.; Moradian-Oldak J.; Nancollas G. H. J. Phys. Chem. C 2007, 111176398–6404. [DOI] [PMC free article] [PubMed] [Google Scholar]
- Wang L.; Guan X.; Yin H.; Moradian-Oldak J.; Nancollas G. H. J. Phys. Chem. C 2008, 112155892–5899. [DOI] [PMC free article] [PubMed] [Google Scholar]
- Tomson M. B.; Nancollas G. H. Science 1978, 20043451059–1060. [DOI] [PubMed] [Google Scholar]
- Davies C. W.Ion Association; Butterworths: London, 1962; pp 37–53. [Google Scholar]
- Wang L. J.; Tang R.; Bonstein T.; Bush P.; Nancollas G. H. J. Dent. Res. 2006, 854359–363. [DOI] [PMC free article] [PubMed] [Google Scholar]
- Wang C.-G.; Liao J.-W.; Gou B.-D.; Huang J.; Tang R.; Tao J.-H.; Zhang T.-l.; Wang K. Cryst. Growth Des. 2009, 962620–2626. [Google Scholar]
- Eanes E. D.; Termine J. D.; Nylen M. U. Calcif. Tissue Res. 1973, 121143. [DOI] [PubMed] [Google Scholar]
- Boskey A. L.; Posner A. S. J. Phys. Chem. 1973, 77192313. [Google Scholar]
- Kim S.; Ryu H.; Shi H.; Jung H.; Hong K. Mater. Chem. Phys. 2005, 91, 500. [Google Scholar]
- Tao J.; Pan H.; Wang J.; Wu J.; Wang B.; Xu X.; Tang R. J. Phys. Chem. C 2008, 112, 14929. [Google Scholar]
- Mahamid J.; Aichmayer B.; Shimoni E.; Ziblat R.; Li C.; Siegel S.; Paris O.; Fratzl P.; Weiner S.; Addadi L. Proc. Natl. Acad. Sci. U.S.A. 2010, 107, 6316–6321. [DOI] [PMC free article] [PubMed] [Google Scholar]
Associated Data
This section collects any data citations, data availability statements, or supplementary materials included in this article.


