Abstract
Purpose
To present the use of MR – Acoustic Radiation Force Imaging (MR-ARFI) and Susceptibility Weighted Imaging (SWI) to visualize calcifications in ex vivo brain tissue as a planning indicator for MR guided Focused Ultrasound (MRgFUS).
Materials and Methods
Calcifications were implanted in ex vivo swine brain and imaged using SWI, MR-ARFI, and Computed Tomography (CT). SWI filtered phase images used a 3D gradient recalled echo (GRE) images with a Fourier-based unwrapping algorithm. The MR-ARFI pulse sequence used a 2DFT spin-echo with repeated bipolar encoding gradients in the direction of the longitudinal ultrasound beam. MR-ARFI interrogations scanned a sub-region (14 mm × 10 mm × 12 mm) of the brain surrounding the calcification. They were combined into a single displacement weighted map, using the sum of squares method. Calcification size estimates were based on image profiles plotted along the ±x and ±z direction, at the full width half maximum.
Results
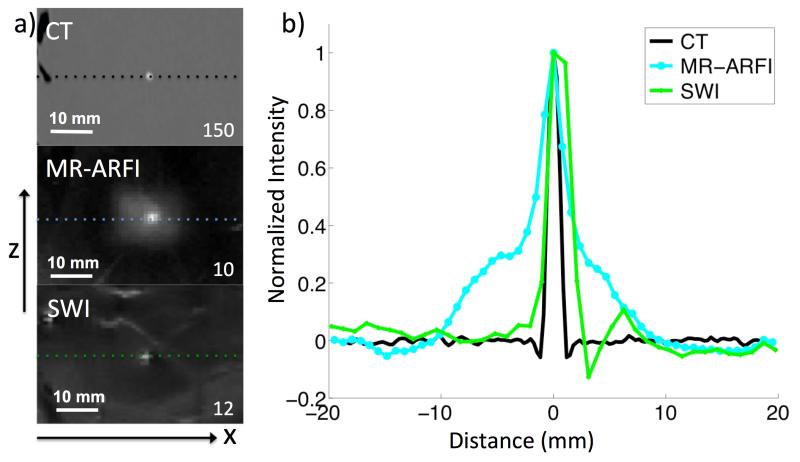
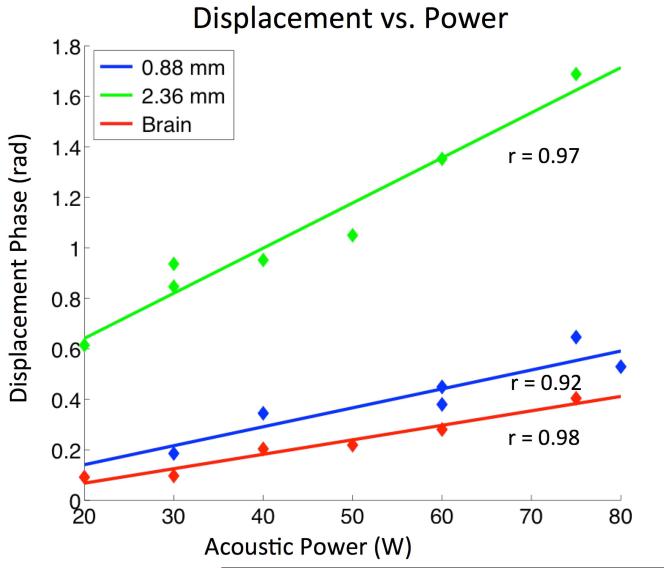
Both MR-ARFI and SWI were able to visualize the calcifications. The contrast ratio was 150 for CT, 12 for MR SWI, and 12 for MR-ARFI. Profile measures were 1.35mm × 1.28mm on CT, 1.24mm × 1.73mm on SWI, and 2.45mm × 3.02mm on MR-ARFI. MR-ARFI displacement showed a linear increase with acoustic power (20W - 80W), and also increased with calcification size.
Conclusion
The use of SWI filtered phase and MR-ARFI have the potential to provide a clinical indicator of calcification relevance in the planning of a transcranial MRgFUS treatment.
Keywords: MR guided Focused Ultrasound, MR-ARFI, MR-HIFU, Calcification, Susceptibility Weighted, Acoustic Radiation Force
Introduction
The most recent advances in non-invasive, transcranial, MRI guided focused ultrasound surgery (MRgFUS) have the prospect to revolutionize treatment paradigms of many neurological pathologies (1,2). Intracranial calcifications are a common finding in the everyday practice of neuroradiology. Many pathologies, such as tumor growth, metabolic diseases, infectious diseases, and even aging, are often accompanied by calcifications (3-5).
When applying MRgFUS to in the brain, there is an interest in identifying intracranial calcifications because they have the potential to interfere with treatment. Inherent variations of the ultrasonic absorption coefficient of calcified regions and surrounding brain tissue could cause local energy absorption, and heating at the calcification-tissue interface boundary. Prostate cancer MRgFUS studies have deemed major prostatic calcifications a contraindication to prostate HIFU treatment (6,7). Thus, it is feasible that calcifications could also be a factor in MRgFUS in the brain. Computed tomography (CT) imaging is capable of detecting brain calcifications a priori, and has been the gold standard for imaging calcifications (8). However, the exact location of the calcification may not be clear on MRI, the guiding modality for MRgFUS, unless precise registration between CT and MRI is achieved. The treatment plan is based on MR images of the brain at the time of treatment, with the transducer fixed on the patient’s skull. At that stage of the treatment setup, MRI registered information of the calcification location with respect to the transducer array and planning images could play a key role to inform the treatment plan. Currently, there is no accepted technique in place to either visualize calcifications, or estimate their potential acoustic interaction, during an MRgFUS treatment.
Susceptibility weighted imaging (SWI) is an emerging MRI technique, most often applied towards neuroimaging. It is a gradient recalled echo (GRE) sequence with additional magnitude and phase processing (9). SWI filtered phase images have been used to identify suspected areas of calcification in the brain (10). In conventional GRE magnitude images both calcifications and hemorrhage present as hypointense. An advantage of SWI filtered phase imaging is the potential to differentiate calcification from hemorrhage. This is due to the opposing phase direction of iron containing blood (paramagnetic) and calcium (diagmagnetic). While the technique has shown some ability to identify small calcifications, it performs poorly in very dense, or large areas of calcification due to phase aliasing, and is also sensitive to causes of susceptibility fluctuations, other than calcium, such as air - tissue interfaces.
MR Acoustic Radiation Force Imaging (MR-ARFI) is another technique that has the potential to visualize calcifications. MR-ARFI reports on acoustic interactions instead of magnetic susceptibility. For this reason, it could be key in predicting the acoustic interference of a calcification located within the treatment envelope. MR-ARFI uses gradients to encode a tissue displacement that results from a non-thermal, ultrasonic pushing force. The acoustic radiation force is caused by a transfer in momentum from the incident acoustic wave to an absorbing medium, like biological tissue. The force is unidirectional, in the direction of beam propagation, and can be written as
where, I is the temporal average intensity, c is the sound velocity in tissue, and α is the absorption coefficient using a plane wave approximation (11). For a given input intensity, the degree of tissue displacement, caused by radiation force, is based on the inherent acoustic properties of the tissue. MR-ARFI has the potential to exploit the difference in acoustic absorption between calcified regions and that of surrounding brain tissue. An early investigation using this technique showed MR-ARFI could visualize calcifications in gel phantoms, but has not been validated in biological tissue (12). In this study, we present and validate MR-ARFI as a method for identifying calcifications in ex vivo swine brain. Since MR-ARFI interrogation volumes are small (~2 cm3), a scan of the entire brain would be prohibitively time intensive to be feasible just prior to an MRgFUS treatment. As a solution, we propose the use of SWI filtered phase to first identify a sub-region of the brain suspected of calcification, followed by MR-ARFI interrogations to substantiate that suspicion based on the acoustic response. We also compare visualization of calcifications using SWI filtered phase and MR-ARFI against the gold standard, CT.
Materials and Methods
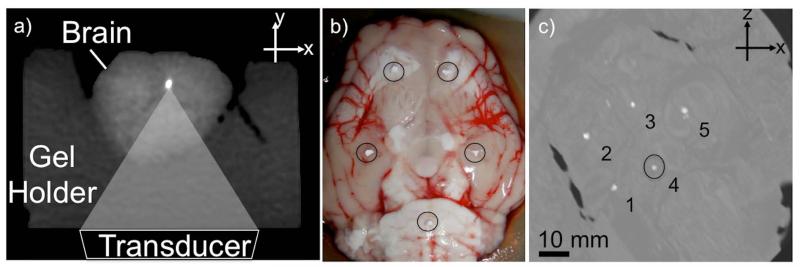
Whole ex vivo swine brains were used in the experiments. The brain was placed in a gel holder, an acoustically transparent pre-formed block of agar gel, used for MR and CT imaging (Figure 1a). The swine brains did not have any known neuronal pathologies. For this reason, calcifications were implanted inside the ex vivo brain using calcium hydroxyapatite particles (Sigma Aldrich, St. Louis, MO) ranging between 0.9 - 2.6 mm diameter (Figure 1b).
Figure 1.
a) CT image of setup: Transducer (not shown) is coupled to the brain through an acoustically transparent agarose holder. MR-ARFI pushes in the longitudinal beam direction. b) Photograph of ex-vivo swine brain just before calcium hydroxyapatite particles (circled) are inserted. c) CT MIP of all the slices in the volume of the swine brain. Implanted calcifications appear bright (1-5). The measured density of #4 was 884 HU.
The brain was imaged using CT, SWI, and MR-ARFI. The MR imaging parameters are given in Table 1. CT images were acquired as a gold standard comparison to identify the calcifications, and to measure their size and density. Images were acquired using a dual energy CT scanner (750 CT HD; GE, Medical Systems, Waukesha, WI), (Helical, ST = 0.33 mm, High Resolution 0.29 mm). SWI filtered phase images were used as a first pass to identify potential areas of calcification, and plan a sub-region of MR-ARFI interrogations.
Table 1.
Imaging parameters for SWI and MR-ARFI
| SWI | MR-ARFI | |
|---|---|---|
| Repetition Time (ms) | 21 | 800 |
| Echo Time (ms) | 6 | 37 |
| Slice Thickness (mm) | 1.5 | 3 |
| Flip Angle (deg) | 30 | 30 |
| Bandwidth (kHz) | 15.6 | 15.6 |
| FOV (cm) | 20 × 20 | 20 × 12 |
| Matrix | 256 × 192 | 256 × 76 |
MR Imaging
A 3.0T MRI scanner (Signa, GE Medical Systems, Waukesha, WI) equipped with the Exablate® 2000 system (InSightec Inc, Haifa, Israel) was used for this study. The FUS system is embedded in the patient table. Within the table, a concave annular array transducer is controlled by a positioning system and immersed in an oil bath. The transducer resonant frequency is 1MHz, and is capable of both mechanical (coarse) and electronic (fine) steering. A transparent membrane creates an acoustic window between the immersed transducer and the target for ultrasonic coupling. For MR-ARFI and SWI, the brain in the gel holder was placed into a cylindrical container with a mylar acoustic window at one end for ultrasonic coupling. A single channel 4” diameter solenoid breast coil (Invivo/MRI Devices, Waukesha,WI) designed for the ExAblate® system surrounded the container.
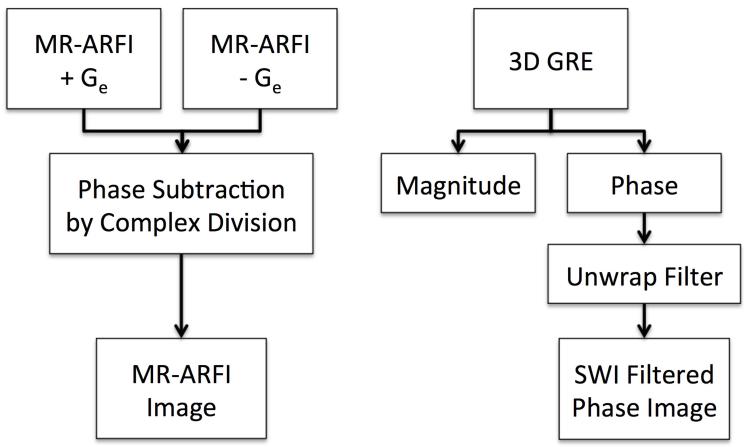
SWI filtered phase and MR-ARFI images were created using the steps shown in Figure 2. For SWI filtered phase, a volume of 3D gradient recalled echo (GRE) images was acquired, and a Fourier-based unwrapping algorithm was applied to the phase images (13). To better visualize calcifications, two slices of filtered phase images were combined into a single maximum intensity projection (MIP) with a total effective slice thickness of 3 mm.
Figure 2.
Flowchart of steps to create MR-ARFI (left) and SWI filtered phase images (right).
The MR-ARFI pulse sequence uses a 2DFT spin-echo with repeated bipolar encoding gradients aligned with the direction of the ultrasound beam (14). The sequence triggers the FUS system to emit ultrasound for a short duration (19 ms), synchronous with a portion of the encoding gradients (15-17). The duration of each gradient lobe was 6.1 ms, which results in a diffusion weighting imaging b-value of 42 s/mm2. Considering an 800 ms repetition time (TR), the ultrasonic duty cycle was 2.4%. MR-ARFI displacement maps were calculated by taking the difference between a pair of phase images, one acquired with positive displacement encoding gradient polarity and one acquired with negative polarity. Complex division was used to calculate phase subtraction of the two acquisitions. The purpose of the subtraction was to remove background phase variations. The resulting MR-ARFI image is a displacement-weighted map, where displacement amplitude is given by phase in radians.
Experiments
The MR-ARFI focal spot size was 2 mm × 10 mm and was targeted at depth of 5 cm. Calcifications visible on SWI filtered phase images were interrogated using MR-ARFI (60W), and compared to interrogations of adjacent areas of the brain not containing calcification. Images were acquired in the x-z plane, perpendicular to the ultrasound beam. In a second experiment, MR-ARFI was used to scan a volume of the brain much larger than the focus by sweeping sonications through a sub-region of the brain surrounding the calcification. The spots were spaced 2 mm apart, and covered an area of 14 mm × 10 mm × 12 mm. The collection of MR-ARFI images of all interrogations were combined into a single displacement weighted map, using the sum of squares method. The sweep experiment was repeated using the same setup in a different ex vivo swine brain, but with 4 mm interrogation spot spacing. To investigate the relationship between displacement, acoustic power, and calcification size, the power was varied between 20W to 80W. Maximum displacement at the focus of each MR-ARFI map was plotted against acoustic power for calcifications of different size.
Image Analysis
To assess MR-ARFI’s ability to differentiate calcified areas from non-calcified brain tissue, displacement profiles showing signal intensity in both cases were plotted. The profiles were centered at the interrogation focus. To compare apparent calcification size across modalities, images for CT, SWI, and MR-ARFI were normalized. The size was estimated as the full width at half maximum (FWHM) of the normalized 1D profile. Profiles were centered at the calcification along the ±z, and ±x directions. Contrast ratio (CR) was calculated using
where the denominator is the difference of means between the calcification, xc, and the brain tissue, xb, and σb is the standard deviation of background. For MR-ARFI, x̄b is the mean displacement of brain interrogations, while σb is taken from a region of the brain with no ARFI.
Results
Maximum intensity projections of the multislice CT images show the locations of the 5 implanted calcifications (Figure 1c). The volume and density of calcification #4 (circle) measured 3.58 mm3, and 884 HU.
SWI
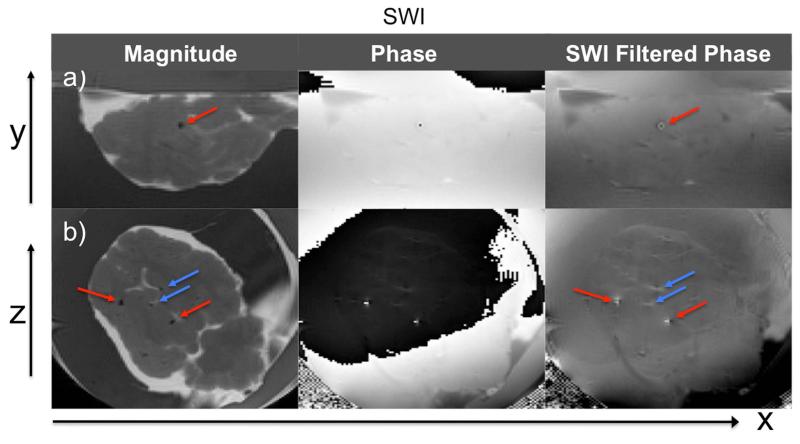
Figure 3 shows SWI magnitude, phase, and filtered phase images containing one or more calcifications in the x-y (axial) and x-z (coronal) plane. In the SWI magnitude images of the x-z plane, hypointense regions are visible both at the calcified areas (red arrows) that correspond to the CT, and in non-calcified parts of the brain (blue arrows). Hypointense regions due to air bubbles present in the ex vivo brain are indistinguishable from calcification in the magnitude images. However, SWI filtered phase images are able to differentiate them. The magnetic susceptibility of air is slightly positive while that of calcification is negative, resulting in an opposing field pattern in SWI filtered phase images (in x-z plane images hyperintense regions are ±x at air bubbles, and ±z at calcifications).
Figure 3.
SWI magnitude, phase and SWI filtered phase images in a) x-y and b) x-z planes. Red arrows point to calcifications corresponding with CT images. Blue arrows show hypointense regions due to air bubbles or blood vessels present in the ex vivo brain. Indistinguishable in magnitude images, SWI filtered phase is able to differentiate calcification from air bubbles by opposing field pattern. The same applies to iron containing vessels.
MR-ARFI
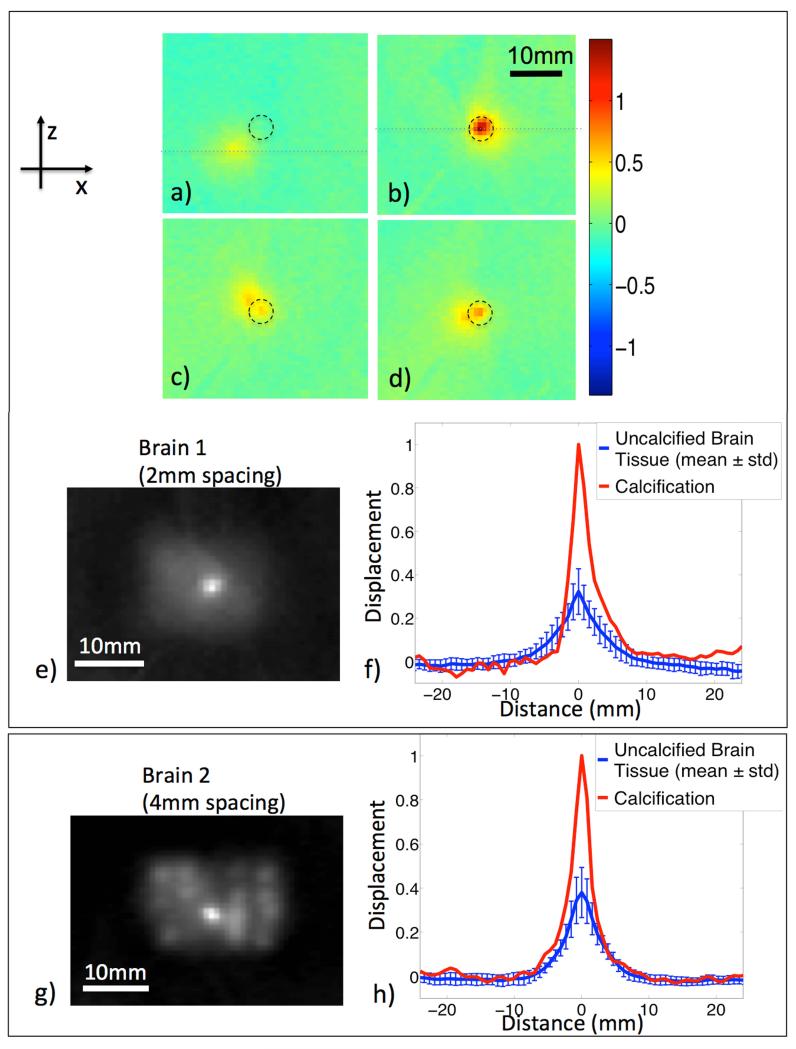
MR-ARFI maps showed greater displacement for interrogations of the calcification than those in surrounding brain tissue (Figure 4a,b). As the focal spot scanned the area surrounding the calcification, interrogations that stepped closer to the calcification showed two distinct displacement peaks (Figure 4c,d). The dual peaks represent the displacement due to the central focal spot, and the displacement due to the adjacent calcification (black circle). Maps show that secondary calcification peaks are visible up to a 4.5 mm radius away from the primary focus. With the focus located directly on the calcification, a single peak showing a large displacement was observed (Figure 4b).
Figure 4.
MR-ARFI displacement weighted maps. Individual MR-ARFI maps where the ultrasound is focused a), c), and d) adjacent to the calcification, and b) directly on it. A black circle points to the location of the calcification. In c) and d) dual peaks show displacements due to the central focal spot, and of the adjacent calcification. e) MR-ARFI combined displacement weighted map of a-d plus additional spatial interrogations shown in greyscale. The calcification location (center) is brighter than those in surrounding brain tissue interrogations. f) Normalized displacement profiles through the central focal spot (dotted lines) show the relative difference between calcification and the average displacement of surrounding brain interrogations (mean ± std, n = 29). Similar results g) and h) are seen in a different swine brain using 4mm interrogation spacing (mean ± std, n = 19).
In the combined displacement weighted map, the calcification is clearly visible as the largest displacement in the center of the sub-region scanned by MR-ARFI (Figure 4e). Displacement profiles through the interrogation focus of each location were normalized to the calcification displacement. The displacement at the calcification was 4 times greater than the average displacement in non-calcified regions of the brain (mean ± std, n = 29) (Figure 4f). A second sweep experiment in another ex vivo brain with an implanted calcification and 4 mm spacing, shows a similar result, where the area of calcification (center) appears much brighter than surrounding brain tissue, and similar normalized displacement profiles (mean ± std, n = 19) (Figure 4g,h).
Figure 5 shows an image comparison of the region of the brain containing a calcification using CT, SWI, and MR-ARFI. The contrast ratio for CT = 150, SWI = 12, and MR-ARFI = 12. Calcification size estimates were based on the profile FWHM profiles along the ±x and ±z direction. The negative portion of the SWI FWHM plot shows phase aliasing along the profile. CT, SWI, and MR-ARFI reported the calcification diameter in each direction to be 1.35 mm × 1.28 mm, 1.24 mm × 1.73 mm, 2.45 mm × 3.02 mm, respectively (Figure 5b).
Figure 5.
a) Column of images of the same calcification using CT, MR-ARFI, and SWI. Contrast ratios are reported in the bottom right corners. For the combined MR-ARFI map, contrast is calculated using brain interrogations as background. b) Normalized profiles centered at the calcification for each modality. Size estimates were calculated at the profile FWHM.
Maximum focal displacement in non-calcified brain tissue and on calcifications, showed a linear relationship with acoustic power levels below 80W (Figure 6). Two calcifications with diameters 0.88 mm and 2.36 mm, respectively were interrogated. Linear fit correlation coefficients were r = 0.92, 0.97, and 0.98 for calcifications 0.8 mm, 2.36 mm, and the surrounding brain. The larger calcification showed the most displacement (green). This suggests the displacement amplitude scaled with both power and calcification size.
Figure 6.
Maximum focal displacement of interrogations in brain tissue, and calcifications of two diameters (0.88 mm, 2.36 mm). Displacement scales with calcification size, and shows a linear relationship (r is correlation coefficient) with power between 20 – 80 W.
Discussion
The results of the study show that calcifications in ex vivo swine brain could be visualized using SWI filtered phase images and MR-ARFI. SWI filtered phase images showed local changes with varied phase aliasing that corresponded to the calcification locations. CT images verified the locations. Based on the SWI filtered phase images, an MR-ARFI scan of the region around a calcification was planned. MR-ARFI interrogations were used to create displacement-weighted maps in the x-z plane, perpendicular to the ultrasound beam. The principle findings of MR-ARFI interrogations are a) increased displacement of calcifications compared with surrounding brain tissue, and b) combined MR-ARFI maps show that the displacement of calcified areas provides enough phase contrast to distinguish the calcification from background interrogations in the brain.
SWI images provided a number of areas of local susceptibility perturbation; about half of the features were due to known implanted calcifications. The calcification was identified by its phase contrast polarity and dipole pattern. While the location was visible in the x-z plane, the boundary of the calcification was unclear due to aliasing of the phase. The SWI images were sufficient to prescribe a sub-region of MR-ARFI interrogations that encapsulated, and detected the calcification on the first pass. Although the greatest displacement was seen when the focus and calcification were aligned, the MR-ARFI sweep revealed that the calcification could still be detected in interrogations whose focus was not centered on the calcification, but within a 4.5 mm radius. This implies there is a radial distance at which the focal spot can be offset from the calcification, but still able to visualize it.
CT was used as the gold standard of calcification size estimates and contrast ratio. CT clearly provided the most calcification to brain tissue contrast, an order of magnitude higher than MR-ARFI and SWI, which both showed comparable contrast ratios (10, and 12). In the ±z direction, both SWI and MR-ARFI overestimated the calcification size compared with CT, with MR-ARFI having the largest overestimation. In the ±x direction, MR-ARFI overestimated size, while SWI slightly underestimated size due to phase aliasing. Other studies have also shown calcifications appear larger in SWI filtered phase images vs. CT(9). MR-ARFI is likely to overestimate size due elastic coupling between the calcification and the surrounding tissue. Rather than the calcification alone, MR-ARFI maps show the total effect of the calcification displacement, and of the tissue it is bounded to. This has been reported in gel phantoms (12).
Despite overestimation of the size compared with CT and SWI, MR-ARFI could play a valuable role in brain treatment planning. Ultimately, the important question is not calcification size itself, but how the area of calcification will be affected by the impending ultrasound. In this respect, MR-ARFI is a more relevant indicator of a potential disruption or off-focus heating than either CT or SWI. Without heating, it directly reports on the parameter of interest - the acoustic interaction of a calcification - as opposed to density or magnetic susceptibility. The displacement amplitude scales with size and power deposition. It is reasonable to conclude that areas of increased displacement predict the local acoustic absorption behavior, and will increase at the higher energy depositions required for ablation. Conversely, if a calcification that is suspected using SWI and then interrogated with MR-ARFI produces little to no displacement difference from un-calcified brain tissue, it may be deemed as benign to the MRgFUS treatment.
Emerging applications in transcranial MRgFUS are in their infancy in the clinical setting, where a standard protocol is not yet established. Knowledge of calcified areas in relation to the beam path could be an essential part of the treatment protocol. Calcifications may call for adjustments of the device parameters, where strategies to avoid insonation of the calcification can be employed. Additionally, severely calcified lesions have the potential to be deemed an exclusion criterion for MRgFUS. In order to assess the risk, calcifications should be visible at the time of treatment planning. While each technique alone may not be sufficient, collectively they have the potential to provide a clinical indicator of calcification status. SWI provides a full field of view in less time than it would take to sweep MR-ARFI interrogations across the entire brain volume. SWI could be used to quickly identify a potential calcification-containing region, and then evaluate its ultrasonic interaction using MR-ARFI. A conceivable hurdle to the success of transcranial MR-ARFI in humans may be a loss of SNR. Design of head specific MRgFUS coils, and development of phase aberration correction algorithms meant to improve ultrasound efficiency through the skull are currently under investigation.
In conclusion, SWI and MR-ARFI, which require no additional equipment than what is available for the treatment, show promise as tools to visualize calcifications, and potentially guide the treatment approach for transcranial MRgFUS.
Acknowledgements
The authors thank Elena Kaye, PhD, Beat Werner, PhD, and Samantha Holdsworth, PhD for helpful discussion.
Grant Support:
Magnetic Resonance Imaging-Guided Cancer Interventions, KB Pauly (PI): NIH P01 CA159992
References
- 1.McDannold N, Clement GT, Black P, Jolesz F, Hynynen K. Transcranial magnetic resonance imaging-guided focused ultrasound surgery of brain tumors: initial findings in 3 patients. Neurosurgery. 2010;66:323–32. doi: 10.1227/01.NEU.0000360379.95800.2F. [DOI] [PMC free article] [PubMed] [Google Scholar]
- 2.Colen RR, Jolesz FA. Future potential of MRI-guided focused ultrasound brain surgery. Neuroimaging Clin. N. Am. 2010;20:355–66. doi: 10.1016/j.nic.2010.05.003. [DOI] [PubMed] [Google Scholar]
- 3.Gobbi G, Bouquet F, Greco L, Lambertini A, Tassinari CA, Ventura A, et al. Coeliac disease, epilepsy, and cerebral calcifications. The Italian Working Group on Coeliac Disease and Epilepsy. The Lancet. 1992;340:439–43. doi: 10.1016/0140-6736(92)91766-2. [DOI] [PubMed] [Google Scholar]
- 4.Morita M, Tsuge I, Matsuoka H, Ito Y, Itosu T, Yamamoto M, et al. Calcification in the basal ganglia with chronic active Epstein-Barr virus infection. Neurology. 1998;50:1485–8. doi: 10.1212/wnl.50.5.1485. [DOI] [PubMed] [Google Scholar]
- 5.Makariou E, Patsalides AD. Intracranial calcifications. Appl Radiol. 2009;38:48–50. [Google Scholar]
- 6.Murat F-J, Poissonnier L, Pasticier G, Gelet A. High-intensity focused ultrasound (HIFU) for prostate cancer. Cancer Control. 2007;14:244–9. doi: 10.1177/107327480701400307. [DOI] [PubMed] [Google Scholar]
- 7.Mulligan ED, Lynch TH, Mulvin D, Greene D, Smith JM, Fitzpatrick JM. High-intensity focused ultrasound in the treatment of benign prostatic hyperplasia. British Journal of Urology. 2003;79:177–80. doi: 10.1046/j.1464-410x.1997.03286.x. [DOI] [PubMed] [Google Scholar]
- 8.Kiroğlu Y, Calli C, Karabulut N, Oncel C. Intracranial calcifications on CT. Diagn Interv Radiol. 2010;16:263–9. doi: 10.4261/1305-3825.DIR.2626-09.1. [DOI] [PubMed] [Google Scholar]
- 9.Haacke EM, Xu Y, Cheng Y-CN, Reichenbach JR. Susceptibility weighted imaging (SWI) Magn Reson Med. 2004;52:612–8. doi: 10.1002/mrm.20198. [DOI] [PubMed] [Google Scholar]
- 10.Wu Z, Mittal S, Kish K, Yu Y, Hu J, Haacke EM. Identification of calcification with MRI using susceptibility-weighted imaging: a case study. J Magn Reson Imaging. 2009;29:177–82. doi: 10.1002/jmri.21617. [DOI] [PMC free article] [PubMed] [Google Scholar]
- 11.O’Brien WD. Ultrasound-biophysics mechanisms. Prog. Biophys. Mol. Biol. 2007;93:212–55. doi: 10.1016/j.pbiomolbio.2006.07.010. [DOI] [PMC free article] [PubMed] [Google Scholar]
- 12.Mende J, Wild J, Ulucay D, Radicke M, Kofahl A-L, Weber B, et al. Acoustic radiation force contrast in MRI: detection of calcifications in tissue-mimicking phantoms. Med. Phys. 2010;37:6347–56. doi: 10.1118/1.3512806. [DOI] [PubMed] [Google Scholar]
- 13.Bagher Ebadian H, Jiang Q, Ewing J. A modified fourier-based phase unwrapping algorithm with an application to MRI venography. J Magn Reson Imaging. 2008;27:649–52. doi: 10.1002/jmri.21230. [DOI] [PMC free article] [PubMed] [Google Scholar]
- 14.Kaye EA, Pauly KB. Adapting MRI acoustic radiation force imaging for in vivo human brain focused ultrasound applications. Magn Reson Med. 2012;69:724–33. doi: 10.1002/mrm.24308. [DOI] [PMC free article] [PubMed] [Google Scholar]
- 15.Chen J, Watkins R, Pauly KB. Optimization of encoding gradients for MR-ARFI. Magn Reson Med. 2010;63:1050–8. doi: 10.1002/mrm.22299. [DOI] [PMC free article] [PubMed] [Google Scholar]
- 16.Kaye EA, Chen J, Pauly KB. Rapid MR-ARFI method for focal spot localization during focused ultrasound therapy. Magn Reson Med. 2011;65:738–43. doi: 10.1002/mrm.22662. [DOI] [PMC free article] [PubMed] [Google Scholar]
- 17.McDannold N, Maier SE. Magnetic resonance acoustic radiation force imaging. Med. Phys. 2008;35:3748–58. doi: 10.1118/1.2956712. [DOI] [PMC free article] [PubMed] [Google Scholar]


