Abstract
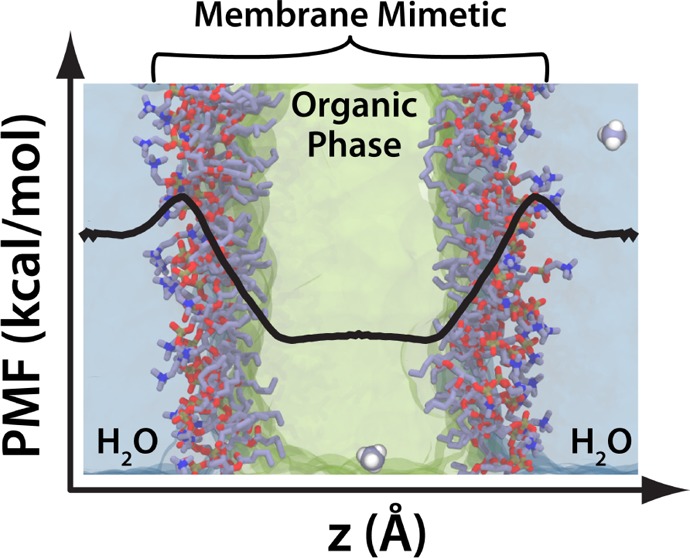
Energetics of protein side chain partitioning between aqueous solution and cellular membranes is of fundamental importance for correctly capturing the membrane binding and specific protein–lipid interactions of peripheral membrane proteins. We recently reported a highly mobile membrane mimetic (HMMM) model that accelerates lipid dynamics by modeling the membrane interior partially as a fluid organic solvent while retaining a literal description of the lipid head groups and the beginning of the tails. While the HMMM has been successfully applied to study spontaneous insertion of a number of peripheral proteins into membranes, a quantitative characterization of the energetics of membrane–protein interactions in HMMM membranes has not been performed. We report here the free energy profiles for partitioning of 10 protein side chain analogues into a HMMM membrane. In the interfacial and headgroup regions of the membrane, the side chain free energy profiles show excellent agreement with profiles previously reported for conventional membranes with full-tail lipids. In regions where the organic solvent is prevalent, the increased dipole and fluidity of the solvent generally result in a less accurate description, most notably overstabilization of aromatic and polar amino acids. As an additional measure of the ability of the HMMM model to describe membrane–protein interactions, the water-to-membrane interface transfer energies were analyzed and found to be in agreement with the previously reported experimental and computational hydrophobicity scales. We discuss strengths and weaknesses of HMMM in describing protein–membrane interactions as well as further development of model membranes.
Introduction
Biological membranes are indispensable and multifunctional components of all living cells and serve as a dynamic platform for a wide range of vital cellular processes, including signaling and transport.1 Cellular membranes are a complex environment characterized by high leaflet asymmetry and heterogeneous composition,2,3 where more than 25% of the surface area is occupied by proteins.4 Far from the initial perception of serving as a passive enclosure, cellular membranes regulate numerous membrane-associated proteins5,6 via the mechanical and electrical properties of the lipid bilayer. The importance of the membrane to life cannot be overstated, as nearly a third of the 34 000 identified human proteins are thought to function only in their membrane-bound forms and depend on membranes for proper function.7
Experimental biophysical and biochemical studies have contributed significantly to our understanding of membrane–protein interactions.8 Such interactions are particularly key to peripheral membrane proteins, in which case the binding and activity of the protein are strongly coupled to the lipid composition of the bilayer. A number of membrane anchoring domains are now structurally resolved and display a wide range of diversity in structural motifs and modes of interaction with the membrane including varying insertion depth, requirement for a particular ion or lipid for proper membrane binding, post-translational modifications to enhance membrane binding, and the need for dimerization.5,8 Although interactions of peripheral proteins with the membrane are thought to be mediated by both lipid-specific interactions5,6 and response to bulk electrical and mechanical properties of the lipid bilayer,9 challenges to and limitations of experimental approaches have prevented detailed atomic characterization of the membrane binding process and associated phenomena for most peripheral membrane proteins.
Molecular dynamics (MD) is a valuable tool for an atomistic description of protein–membrane interactions, as it offers temporal and spatial resolutions needed to study molecular events at an unparalleled level of detail.10,11 Indeed, combining experimental approaches and computational methodologies in a number of peripheral proteins has proven very effective in understanding how atomic-level phenomena affect cellular-level events.12,13 However, relatively slow lateral lipid dynamics and limits to time scales achievable have made capturing spontaneous binding and insertion of peripheral proteins into a membrane challenging to computational studies. These challenges led us to develop a novel membrane model, termed the highly mobile membrane mimetic (HMMM), which expedites computational studies of membrane-associated phenomena by enhancing lipid dynamics.14
The HMMM is based on the conceptually simple idea of representing a large part of the membrane hydrophobic core by a more fluid representation, while using short-tailed lipids to maintain an atomistic description of the head groups. The HMMM accelerates lipid dynamics without compromising accurate description of the lipid head groups, which are key to the interactions of peripheral proteins with membranes. The model has been successfully applied to capture the spontaneous membrane binding and insertion of individual phospholipids,15 various membrane anchoring domains,14,16 as well as individual transmembrane helices.17 A number of other applications of the model are now in progress in our laboratory.18−20
Despite its utility in accelerating insertion events, concerns remain as to the degree to which the in silico changes to the membrane perturb the energetic cost of partitioning a protein into the membrane. To characterize the energetics of the HMMM model and gain a better understanding of protein–membrane interactions in the model, we report the potentials of mean force (PMF) of side chain insertion into a HMMM membrane. These PMFs are compared to reported experimental,21 computational all-atom (FULL-AA),22 and coarse-grained (FULL-CG)23 free energies. Reconstructed PMFs analyzed on the basis of four regions within the membrane22,24 demonstrate that the HMMM model accurately reproduces the free energy of side chain partitioning at the membrane interface, an essential feature needed for a proper description of protein–lipid interactions in peripheral proteins. On the other hand, the HMMM in its present form has difficulty describing membrane core energetics for all side chains due to the fluid and slightly polar nature of the core solvent, currently limiting the model’s use to peripheral proteins and single-pass transmembrane proteins. We also compare the results to previously reported hydrophobicity scales based on the free energy of side chain insertion into lipid membranes. As the HMMM model was designed to describe the interactions of peripheral proteins with the membrane, we devote particular attention to the interactions of the side chains with the interfacial regions of the membrane.
Methods
In order to assess the accuracy of the HMMM model in describing the partitioning of proteins into membranes and isolate the impact of individual residues on the overall protein–membrane interaction, we prepared simple side chain analogues of 10 amino acids and calculated the PMF for their insertion into a HMMM membrane. The analogues were constructed by removing both the amino and carboxylate moieties of each side chain and replacing the α-carbon by a hydrogen. The new hydrogen was assigned a partial charge of +0.09, typical for an aliphatic hydrogen in CHARMM,25,26 and the charge on the β-carbon was adjusted by −0.09 to maintain the net charge of the side chain. The partitioning of the constructed side chain analogues was investigated for 10 residues that span four major classes, namely, (1) hydrophobic/aliphatic residues Ala (methane) and Ile (n-butane); (2) aromatic residues Trp (3-methylindole), Phe (toluene), and Tyr (p-cresol); (3) polar residues Asn (acetamide), Cys (methanethiol), and Ser (methanol); and (4) charged residues Asp (acetate) and Arg (N-propylguanidinium). The choices of amino acid analogues are identical to those used in previous experimental21 and computational22,23 studies, which will be our primary basis for comparison. Wherever possible, our methodology was identical to those of the reference studies which used a conventional bilayer.22,23
System Preparation with the HMMM Model
Each system was constructed by placing two copies of a protein side chain analogue, offset by 32.5 Å in the z-direction, in a pre-equilibrated HMMM membrane containing phosphatidylcholine (PC) short-tailed lipids (st-lipids) along with water and ions. The total charge of the system was neutralized by adding two Na+ ions for the system with Asp and two Cl– ions to the system with Arg (one counterion for each copy of the analogue). The HMMM membrane used in this study was made of 72 st-lipids (36 PC lipids per leaflet) with an area per lipid of 68 Å2, matching the experimentally determined value for dioleoylphosphatidylcholine (DOPC).27 1,1-Dichloroethane (DCLE) was used as the liquid solvent representation of the hydrophobic core of the bilayer.28 Each system, slightly varying depending on the side chain size, contained approximately 21 300 atoms, including nearly 4300 water molecules.
Simulation Protocol and Analysis
Simulations were performed using NAMD2.810 with the CHARMM36 force field parameter set for lipids and small molecules,25,29 the CHARMM27 parameter set for the side chains,26,30 and the TIP3P model for water31 in the NPnAT (constant normal pressure, area, and temperature) ensemble. Langevin dynamics with a damping coefficient of 0.5 ps–1 and the Langevin piston Nosé–Hoover method32,33 were employed to maintain the temperature at 298 K and pressure at 1.0 atm. The long-range electrostatic forces were calculated using the particle mesh Ewald (PME) method34 with a grid density of 1 Å–3. The cutoff for van der Waals interaction was set at 13.5 Å with a smoothing function applied after 10 Å. An integration time step of 2 fs was used. In order to prevent artificially large, out-of-plane fluctuations of the st-lipids and their occasional partitioning into bulk water, we applied a weak harmonic constraint (0.05 kcal/mol·Å2) to the z-position to the carbonyl carbon atoms of each st-lipid. The choice of the weak force constant allowed for fluctuations of ±3.5 Å along the z-axis, consistent with membrane fluctuations seen in a conventional bilayer. No restraints were applied in the xy-plane, allowing for rapid lateral lipid diffusion.
Umbrella Sampling
The umbrella sampling method was used to calculate the PMFs for inserting the side chain analogues into a HMMM membrane. Using the membrane normal (z-axis) as the reaction coordinate, the space to be sampled was divided into 36 windows with neighboring windows separated by 1 Å. Since each system contains two copies of the side chain analogue and each copy is offset by 32.5 Å along the normal, the effective window spacing is 0.5 Å. The force constant for the harmonic umbrella potential was 7.17 kcal/mol·Å2. Data for each simulation were collected for 10.5 ns per window. The first 500 ps was considered equilibration time and not included in the analysis. In aggregate, these simulations encompass more than 3.7 μs of simulated trajectories. The free energy profiles were reconstructed using the weighted histogram analysis method (WHAM).35,36 The WHAM calculations and error estimates were carried out using the g_wham program in the GROMACS package.37,38 All data within 35 Å of the membrane center were used for the WHAM calculation. Error estimates were calculated using the bootstrap error analysis.38−40
Free-Energy Perturbation Calculations
Solvation free energies were calculated using alchemical free-energy perturbation (FEP).41 In FEP calculations, side chain analogues were alchemically solvated in a liquid of interest, namely, DCLE, water, or dodecane. Growth of the side chain into solution was controlled by the parameter λ, ranging from 0 to 1, which couples the side chain to the Hamiltonian of the rest of the system.42 A scaled-shifted soft-core potential43 was used for van der Waals interactions to reduce occurrences of singularities for small values of λ. Each simulation was run in both directions: forward (solvation, λ from 0 to 1) and backward (desolvation, λ from 1 to 0). The calculations were divided into 25 windows, where λ increased linearly by 0.04 between windows. Each window consisted of 10 ps of equilibration and 250 ps of data collection, for a total of 13 ns for each side chain analogue/solvent combination. Analysis of FEP results was performed using the Bennett acceptance ratio44 as implemented in the ParseFEP plugin45 of VMD.46
Results and Discussion
The PMFs resulting from the umbrella sampling calculations were analyzed on the basis of four distinct regions of the modeled membranes (Figure 1). These regions correspond to the changing properties of the membrane, and also allow direct comparison to previous computational and experimental reports,21,22,24,47 which made use of this regional analysis scheme. The original definition of the regions was based on the free volume accessible to spherical particles.24 Here, region I (RI-core) is defined to be |z| ≤ 10 Å (with z = 0 representing the midpoint of the membrane), where liquid DCLE, representing the hydrophobic core of the HMMM membrane, predominates. Region II (RII-tails), 10 Å< |z| ≤ 17.5 Å, is the region encompassing the acyl chains of the short lipid tails. This region is predominantly composed of the acyl tails, and resembles a soft polymer that introduces restrictions on rotational and translational degrees of freedom of penetrants. Region III (RIII-heads), 17.5 Å < |z| ≤ 25 Å, is the lipid headgroup region which also contains water molecules and ions that are strongly bound to the head groups. The RIII-heads region contains most of the phosphate atomic density and is the interfacial region of the membrane. Region IV (RIV-water) includes all atoms with |z| > 25 Å and contains primarily bulk water. The HMMM model14,18 was developed to facilitate studies of peripheral protein interactions with membranes; therefore, special attention in the following analyses is devoted to RII-tails and RIII-heads regions, where most of the membrane-anchoring protein domains appear to interact with lipids.5,14 For ease of understanding, we use descriptive abbreviated names (e.g., RI-core) throughout the text.
Figure 1.
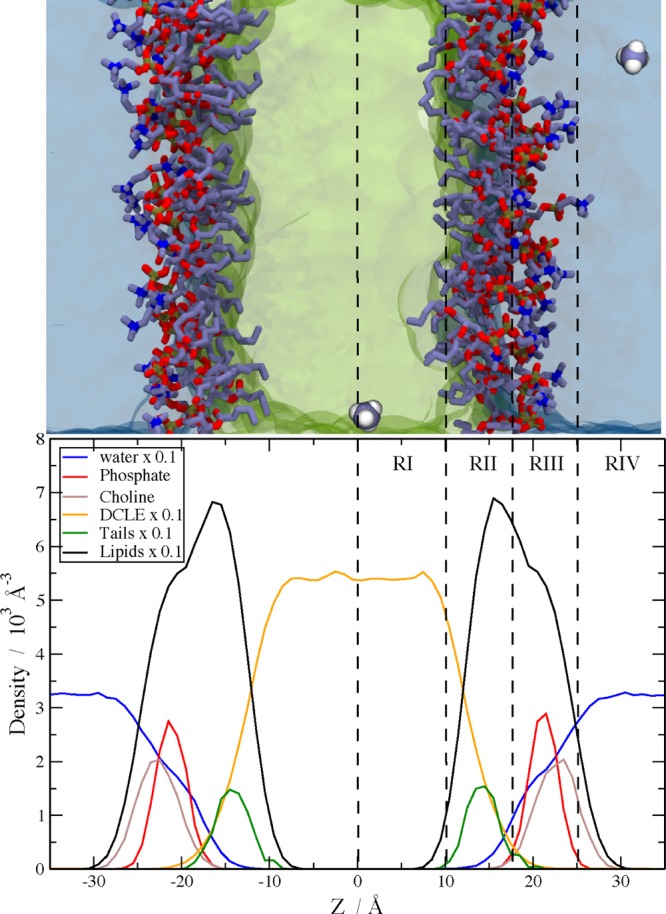
(top) A snapshot of the system used to calculate the PMFs of membrane insertion of the 10 side chain analogues. In the HMMM membrane, DCLE is shown in green, bulk water in blue, and the short-tailed PC lipids as sticks with carbon in gray, oxygen in red, nitrogen in blue, and phosphorus in gold. The Ala analogue, methane, is included to demonstrate the initial positioning of the two copies in the system. (bottom) The atomic density of various chemical groups in the HMMM system. The dashed lines show the demarcation between the different regions used in the analysis of PMF plots. Region I, RI-core, is defined to be the area in the center of the membrane with |z| ≤ 10 Å and is composed mostly of liquid DCLE. Region II, RII-tails, occupies the area 10 Å < |z| ≤ 17.5 Å and encompasses the tails of the st-lipids as well as the glycerol moiety and some phosphate density. Region III, RIII-heads, consists of 17.5 Å < |z| ≤ 25 Å and contains the majority of the phosphate density as well as all of the choline density and associated water molecules and ions. Region IV, RIV-water, is |z| > 25 Å and is comprised of bulk aqueous solution.
The main goal of this report is to quantitatively assess the accuracy of the HMMM model membrane in describing protein side chain insertion into distinct regions of a membrane and, in doing so, to facilitate further development and application of model membranes. We compare our calculations to the previously reported computational studies of full-tail membrane models described with all-atom OPLS (FULL-AA)22 and coarse-grained MARTINI (FULL-CG)23 force fields. Additionally, we compare our results to the free energy values reported on the basis of experiments by Wimley and White (WW),47 Hessa et al.,48 Radzicka and Wolfenden (RW),21 and Moon and Fleming.49
Aliphatic Side Chains
Aliphatic protein side chains are critical in the binding and insertion of peripheral proteins into the membrane. The calculated PMFs for insertion of representative aliphatic side chains, Ala and Ile, into the HMMM membrane show excellent agreement, both in the shape and in the absolute values, when compared to the FULL-AA and FULL-CG calculations (Figure 2). The PMFs display a small (∼1 kcal/mol or 1.5 kT) barrier at the interface between water and the membrane, the RIII-heads region, followed by an attractive basin that reflects the hydrophobic nature of the side chains. The free energy steeply decreases from the RIII-heads and RII-tails regions into the RI-core region as the side chains move into a less dense and more nonpolar environment. The liquid core of the HMMM reproduces the free energy of transfer from water to a full-tail membrane core for both the linear Ile side chain (n-butane) and for the nearly spherical Ala (methane). The absolute values of the transfer free energies of Ala and Ile from water into the center of the membrane (RI-core region) agree very well with the values reported from early experiments of Radzicka and Wolfenden21 on partitioning of the same side chain analogues between water and cyclohexane: Ala, −2.0 kcal/mol (HMMM) vs −1.8 kcal/mol (RW21) and Ile, −4.7 kcal/mol (HMMM) vs −4.9 kcal/mol (RW21).
Figure 2.
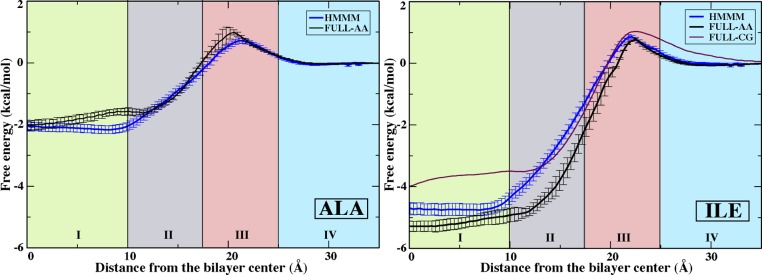
PMFs for representative aliphatic side chain analogues, Ala (left) and Ile (right). Data are presented for the HMMM membrane (blue), FULL-AA (black),22 and FULL-CG (purple).23 No FULL-CG data was reported for Ala. All PMFs are presented by setting the free energy to zero in aqueous solution. Regions I–IV are defined in Figure 1. Error estimates were obtained using bootstrap analysis.
Free energy of Ile transfer from water into the center of the RII-tails region (−3.0 kcal/mol at z = 13.75 Å) is in closer agreement with the experimental measurements by Wimley and White of the partitioning of specifically designed peptides from water to the POPC membrane interface (−4.5 kcal/mol)47 than the calculated value for the transfer from water into the center of the RIII-heads region (0.75 kcal/mol at z = 21.25 Å). This suggests that the interfacial interactions between membrane and peptides reported by Wimley and White47 were likely reflecting localization of the side chain at the beginning of the lipid tails, just below the lipid head groups, which agrees well with computational results for similar systems.50 The small differences in the absolute values between the HMMM and experimental measures can be attributed to the absence of the protein backbone in our calculations.
Aromatic Side Chains
Aromatic side chains studied here (Tyr, Trp, Phe) display a more complex behavior due to variations in shape, hydrogen bonding capacity, and dipole moments.22,51 The free energies of aromatic side chain insertion into all regions of HMMM agree well with FULL-AA22 and FULL-CG23 PMFs, except in RI-core where insertion into the liquid DCLE is more favorable than it is in FULL-AA or FULL-CG membranes, and will be discussed at length below (Figure 3). Tyr and Trp are nearly twice as overstabilized as Phe in the RI-core region of the HMMM membranes as compared to full-tailed membranes (FULL-AA22 and FULL-CG23).
Figure 3.
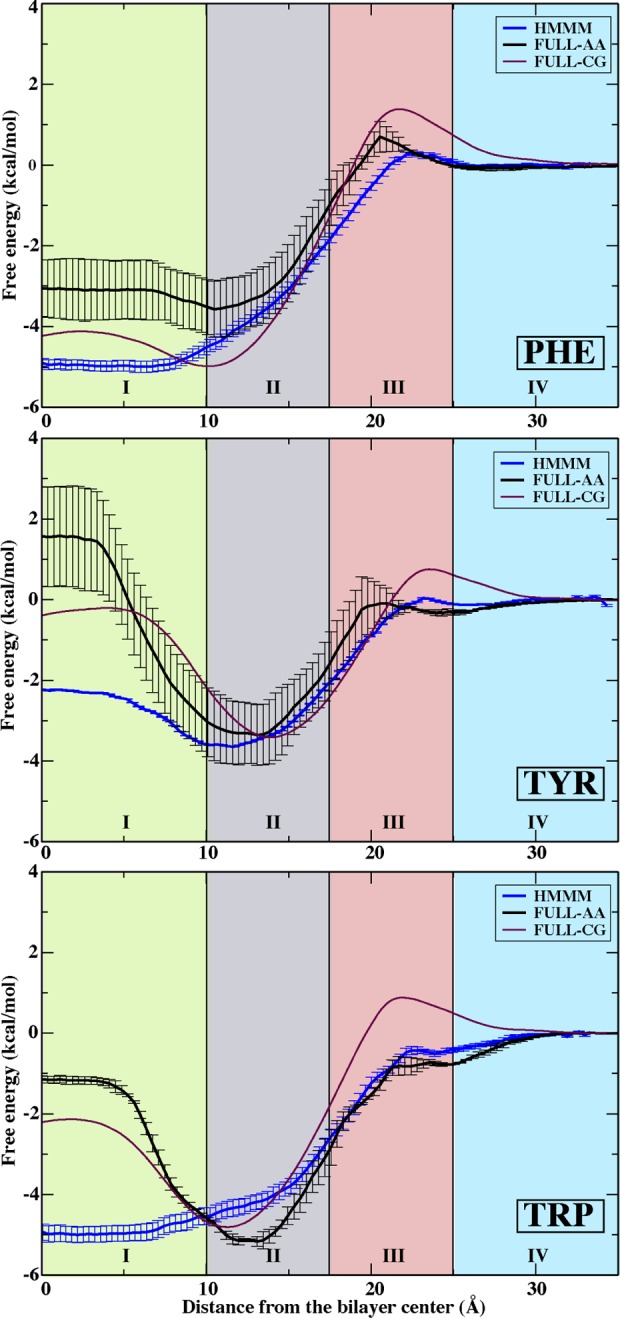
PMFs for aromatic side chain analogues, Phe (top), Tyr (middle), and Trp (bottom). Data are presented for the HMMM membrane (blue), FULL-AA (black),22 and FULL-CG (purple).23 All PMFs are presented by setting the free energy to zero in aqueous solution. Regions I–IV are defined in Figure 1. Error estimates were obtained using bootstrap analysis.
The RII-tails region, particularly the lipid tail–headgroup interface, displays stabilization relative to the solution in the calculated PMFs (Figure 3). Trp and Tyr are especially known for their abundance in the “interfacial belt” of membrane proteins and for their role in anchoring transmembrane helices.51−53 Indeed, we observe the deepest minimum in the PMF of Trp (−5.0 kcal/mol), followed by slightly shallower minima for Tyr (−3.5 kcal/mol) and Phe (−4.1 kcal/mol) (Figure 3). While preserving the general form of the PMFs, the free energies within the RII-tails region deviate slightly but are in good agreement with previous computational22,23 and experimental data (adjusted to the value for Ala) on interfacial free energies:47 Trp, −2.85 kcal (HMMM) vs −3.7 kcal/mol (FULL-AA22) vs −2.0 kcal/mol (WW47); Tyr, −2.15 kcal/mol (HMMM) vs −2.0 kcal/mol (FULL-AA) vs −1.1 kcal/mol (WW); and Phe, −2.25 kcal (HMMM) vs −1.8 kcal/mol (FULL-AA) vs −1.3 kcal/mol (WW).
The RI-core region of the HMMM membrane shows the largest free energy deviation from the FULL-AA22 and FULL-CG23 data for aromatic side chains (Figure 3). Insertion free energies of aromatic side chains to the center of the membrane are more favorable in the liquid core of HMMM than in the center of FULL-AA membranes22 by 4 kcal/mol for Tyr and Trp versus 2 kcal/mol for Phe. These differences can be partially attributed to additional translational and rotational freedom offered by the liquid DCLE as compared to the lipid tails in the center of the FULL-AA and FULL-CG membranes. In RI-core of the HMMM, bulky side chains are free to rotate, and are not constrained laterally by lengthy acyl tails.
This is supported by the distribution of the orientation of Tyr in the different regions of the HMMM (Figure 4). The orientation of Tyr in RI-core of the HMMM is random, similar to RIV-water, demonstrating that Tyr is not constrained in orientation in the membrane interior. In RII-tails, where Tyr primarily interacts with acyl tails, Tyr preferentially orients itself along the membrane normal in both HMMM and FULL-AA systems.22 Since the interior of a HMMM membrane is liquid, we expect all larger side chains to freely sample orientational space, lowering the free energy in RI-core relative to FULL-AA values by at least 5/2 kT, with 3 rotational and 2 translational additional degrees of freedom that can be populated.
Figure 4.
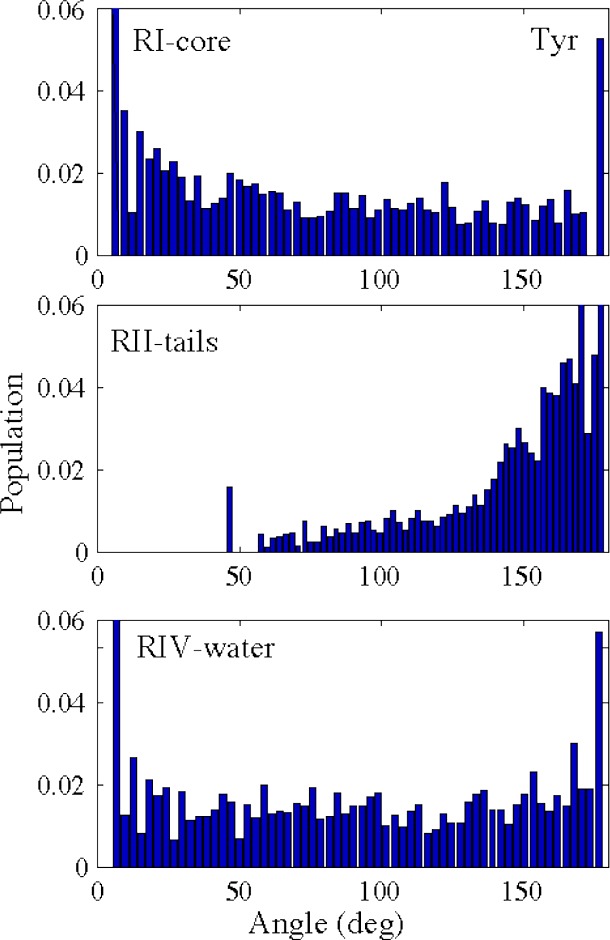
Distribution of the orientation of Tyr at different regions in the HMMM membrane: RI-core (top), RII-tails (middle), and RIV-water (bottom). The distribution of orientations in RI-core and RIV-water is fairly unbiased, whereas the orientation in RII-tails shows a dramatic skew toward remaining parallel to the membrane normal. The orientation is determined by measuring the angle between the membrane normal and the long axis of Tyr (i.e., the vector from the carbon at the para position to the phenol oxygen atom).
The polar nature of DCLE also contributes to discrepancies in RI-core between HMMM and FULL-AA PMFs. DCLE has been shown to efficiently orient its dipole around neighboring polar groups in order to reduce the energy penalty for burying these species.28 Thus, the HMMM and FULL-AA PMFs in RI-core for Trp and Tyr are more greatly separated than the Phe PMFs, due to their polar functional groups that orient surrounding DCLE. This can also be seen from the solvation free energies for solvating Tyr and Phe in DCLE, water, and dodecane (Table 1). ΔDCLE-waterTyr > ΔDCLE-waterPhe suggests that DCLE has water-like interactions with the hydroxyl of Tyr, as the two values should be the same when considering the solvation of the phenyl ring. This hypothesis is also supported by the fact that ΔDCLE-dodecaneTyr < ΔDCLE-dodecanePhe, suggesting that there are additional stabilizing interactions when solvating Tyr into DCLE relative to solvating Phe.
Table 1. Free Energy (kcal/mol) of Side Chain Solvation in Different Solvents Calculated Using the Free Energy Perturbation Method.
| DCLE | water | dodecane | ΔDCLE-water | Δdodecane-water | ΔDCLE-dodecane | |
|---|---|---|---|---|---|---|
| Tyr | –6.31 ± 0.07 | –4.27 ± 0.06 | –4.61 ± 0.07 | –2.04 | –0.34 | –1.70 |
| Phe | –4.57 ± 0.05 | 0.29 ± 0.05 | –4.02 ± 0.06 | –4.89 | –4.31 | –0.55 |
The solvation free energy differences for Tyr and Phe in water relative to DCLE for Tyr and Phe calculated using FEP (−2.04 and −4.28 kcal/mol, respectively) agree closely with the free energy difference between RIV-water and RI-core recovered using umbrella sampling (Figure 3). We believe the differences in the free energy of insertion into the RI-core region are due to an increased entropic stabilization of these bulky groups and the polar nature of DCLE. As the HMMM model is designed primarily for studies of peripheral proteins interacting with the membrane, the variances in the free energy of insertion into the membrane center are unlikely to be of a major concern for specific systems of interest.
Polar Side Chains and Cysteine
Representative polar side chains, Ser (methanol) and Asn (acetamide), show good agreement with the FULL-AA22 and FULL-CG23 PMFs in the RIII-heads and RIV-water regions (Figure 5), while the minima in the RII-tails region appear to be more shallow in the HMMM membrane. Interestingly, the FULL-CG PMF calculated with the MARTINI coarse-grained force field23 similarly failed to capture the minimum in RII-tails for Asn (Figure 5). We believe that dipole interactions are essential to capturing the correct depth of the minima in polar groups, which may have arisen due to favorable interactions between the polar moieties and the acyl tail carbonyl. These interactions would be perturbed in a coarse-grain representation by an inaccurate dipole representation, and are perturbed by DCLE occasionally intercalating into the acyl tail region.14 Similar to the aromatic amino acids, the PMFs for polar amino acids in the HMMM show overstabilization in the RI-core region compared to FULL-AA and FULL-CG. This is again due to the dipole–dipole interactions between the side chains and DCLE, and their tumbling within the solvent.
Figure 5.

PMFs for representative polar side chain analogues, Asn (top), Ser (middle), and Cys (bottom). Data are presented for the HMMM membrane (blue), FULL-AA (black),22 and FULL-CG (purple).23 All PMFs are presented by setting the free energy to zero in aqueous solution. Regions I–IV are defined in Figure 1. Error estimates were obtained using bootstrap analysis.
The calculated PMF for Cys is in good agreement with the FULL-AA PMF22 in regions II–IV (Figure 5), particularly the slope of the free energy from the RIII-heads to the RII-tails regions, which is mainly due to the amphipathic nature of the side chain. Once again, interactions between the side chain and DCLE solvent lead to a low calculated free energy within RI-core of the HMMM relative to comparison membranes.
Charged Side Chains
Calculated PMFs of representative charged side chains, Asp (acetate) and Arg (N-propylguanidinium), show good agreement with both types of full-tail lipid calculations, FULL-AA22 and FULL-CG,23 in the regions RIII-heads and RIV-water (Figure 6). Negatively charged Asp displays a continuous increase in free energy as it moves from bulk water to the membrane center. For a charged species like Asp, it is unsurprising that dipole interactions between the carboxylate of Asp and DCLE result in a stabilization of Asp in RI-core relative to comparison membranes. The flat profile for Asp within the interior of RI-core reflects the position at which Asp is fully immersed in DCLE, and the further insertion results in no free energy change.
Figure 6.
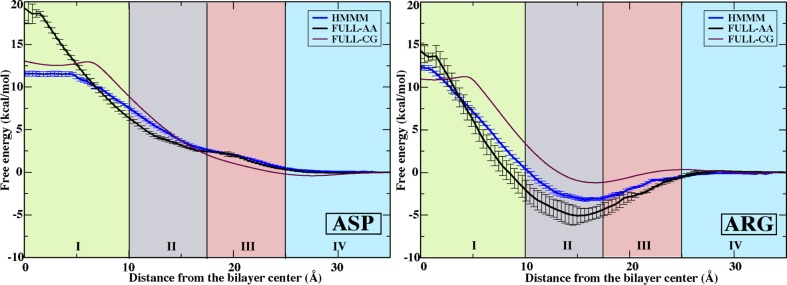
PMFs for representative charged side chain analogues, Asp (left) and Arg (right). Data are presented for the HMMM membrane (blue), FULL-AA (black),22 and FULL-CG (purple).23 All PMFs are presented by setting the free energy to zero in aqueous solution. Regions I–IV are defined in Figure 1. Error estimates were obtained using bootstrap analysis.
Since Arg is amphipathic, our simulations, as well as the FULL-AA22 and FULL-CG23 simulations that use an identical protocol (Figure 6), show a sizable free energy well across RII-tails and RIII-heads. The wide minimum can be attributed to the interaction of Arg’s charged guanadinium group with the polar region of up to three lipids (Figure 7) simultaneous to partitioning of its alkyl chain into the membrane core, creating a significantly favorable environment and lowering the free energy in these regions. Indeed, this orientation is so favorable that it has been proposed to facilitate membrane penetration by arginine-rich peptides,54 such as antimicrobial peptides. When the guanadinium starts to be buried in the hydrophobic region (RI-core), however, the energetic penalty rapidly rises, as is expected for burying naked charge in a membrane.21,22,55 These high energy penalties arise from the deformation of the membrane to hydrate the charge (Figure 8), which accounts for a significant portion of the energy penalty,55 which may be reduced in vivo by the surrounding protein environment.56
Figure 7.
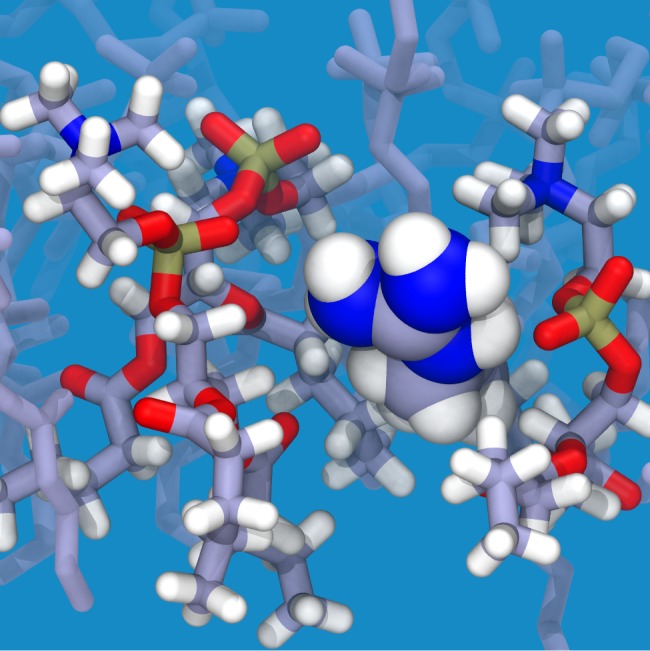
Snapshot of the system with an Arg side chain analogue (spheres) in the interfacial region (RIII-heads) of the HMMM membrane. Oxygen atoms (red) of PC lipid head groups (sticks) interact with hydrogen atoms (white) of the guanidinium group of Arg. Other atoms shown are carbon (gray), nitrogen (blue), and phosphorus (gold).
Figure 8.
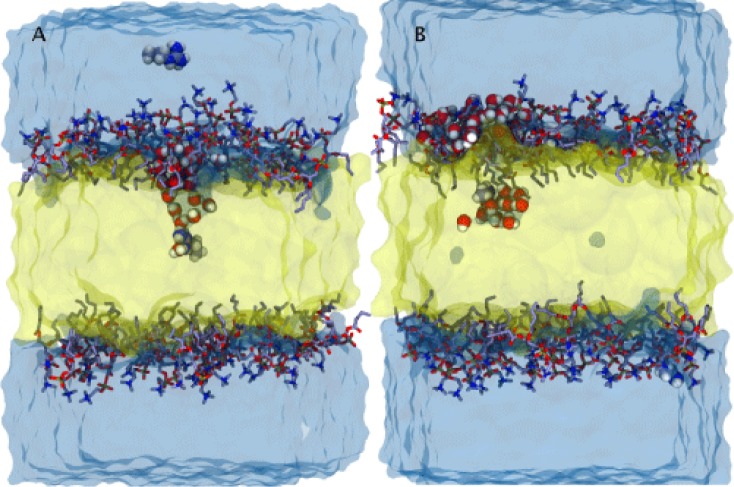
Snapshots of systems with polar and charged residues that display formation of the water defects when amino acids are positioned: at the membrane center - charged Arg (A) and near the membrane center - polar Asn (B).
Partitioning of polar and charged side chains into the membrane has been shown to be accompanied by the formation of stable water-filled membrane defects.22,57 Additionally, Johansson and Lindahl have shown correlation between the hydration level of transmembrane helices and hydrophobicity scales.57 During our simulations, we observed formation of a stable water-filled defect when charged side chains, Arg or Asp, are positioned in the center of HMMM membrane (Figure 8). The water-filled defect was the widest at the base on the membrane interface and was narrowed down to a few water molecules surrounding the side chain in the center of the membrane. In the case of a polar side chain, Asn, a water-filled defect is only present when Asn is positioned closer to the ends of the tails and not when the residue is near the center of the membrane (Figure 8).
PMF Comparison to Hydrophobicity Scales
Through analysis of the calculated free energy profiles at particular points along the HMMM normal, we can compare the transfer free energy from solution to a specific region of the HMMM with developed hydrophobicity scales.21,22,47−49 These scales are based on different experimental measurements, including partitioning of side chain analogues from water to cyclohexane,21 partitioning of specifically designed pentapeptides from water to the interface of the membrane,47 membrane protein insertion into a membrane via the Sec translocon,48 and equilibrium between folded and unfolded states of a membrane protein.49 Naturally, these different experiments are measuring the energetic difference between the aqueous solution and different regions of a membrane. As the HMMM model is designed to capture partitioning into the membrane interface, the Wimley–White hydrophobicity scale47 based on partitioning of pentapeptides to the membrane interface is of particular importance for this study. Comparing the insertion free energy of the HMMM to any experimental scale is not intended to reproduce exact free energy differences. Due to the differences in protocols between each scale, the uncertainty in exactly which region the peptides partition, and the fact that the simulation system used here does not replicate any of these protocols, there will necessarily be differences in insertion free energies between the HMMM and experimental studies. Computational agreement with experimental free energy scales is improved if side chain interactions with neighboring residues are also included.58,59 The purpose of this discussion is merely to compare trends in free energy differences for individual amino acids between hydrophobicity scales to gain a better understanding of where the amino acids might partition in experimental studies.
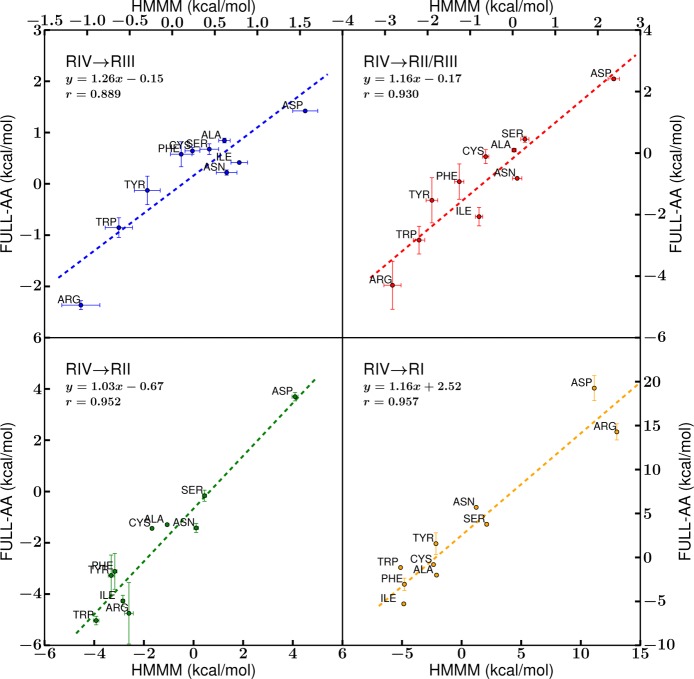
First, we compare HMMM free energies to the computational FULL-AA data reported for a full-tail membrane22 for different regions from the center of the membrane to lipid head groups (Figure 9). The correlation between all regions studied (Figure 9) suggests that the overall energetic trends for side chain–membrane interactions are preserved in the HMMM in all four regions. The slopes of the trend lines for all four membrane regions are also near unity (Figure 9), suggesting that the conversion of a full-tail membrane to the HMMM preserves population-based interaction statistics in all four regions of membrane. Notably, though, the RIV-water → RI-core trend line (Figure 9) has the largest vertical shift of +2.52 kcal/mol with respect to the FULL-AA data,22 a systematic shift in the free energy profiles as a result of the increased entropic contribution due to the liquidity of the DCLE and the larger dipole of DCLE relative to acyl tails that promotes stronger interaction between amino acids with polar groups and the membrane core which replace the membrane core in the HMMM. In regions RII-tail–RIV-water, where DCLE is less prevalent, we expect and observe native-like membrane interactions and forces in the HMMM system. The preservation of contacts and interaction patterns upon membrane conversion has been observed in studies on peripheral proteins, specifically coagulation factor binding domains and cytochrome P450.14,16
Figure 9.
Comparison of the transfer free energy of the side chains from solution (RIV-water) to the regions within the membrane. The points for RII-tails and RIII-heads were taken at the midpoint of the region (z = 13.75 Å and z = 21.25 Å, respectively), while the RI-core position was taken to be the bilayer center. An additional measurement was taken at the interface between RII-tails and RIII-heads (RII/RIII, at z = 17.5 Å). The positions of points along the x-axis are determined by the HMMM free energy values, while the y-axis values were computed for a full-tail membrane.22 The dotted lines represent the linear fit of the points, and essential fit information is reported.
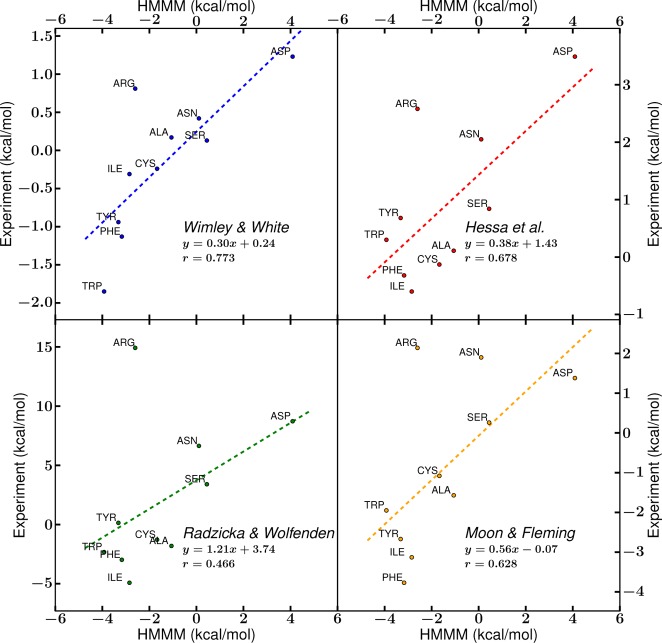
Comparisons of transfer free energies calculated with the HMMM model to experimental hydrophobicity scales21,47−49 show good agreement for most side chains where the HMMM design matches experimental conditions, such as in RII-tails and RIII-heads. In particular, comparison of free energy values for RIV-water → RII-tails transfer in the HMMM membrane to these scales (Figure 10) agrees best with the hydrophobicity scale proposed by Wimley and White, where a designed pentapeptide interacts with the membrane interface.47 The WW hydrophobicity scale is most similar to the conditions in RII-tails, as the peptide explores the region corresponding to the free energy wells for hydrophobic and aromatic side chains (Figures 2 and 3). The behavior in the HMMM for Arg is much more different than that of most experiments. Due to the favorable interactions Arg can form in our simulation system (Figure 7) while keeping its long tail buried in the membrane, our simulations show Arg insertion to be more favorable than the consensus of experimental findings, where such configurations for Arg are not possible.
Figure 10.
Comparison of hydrophobicity scales to the RIV-water–RII-tails transfer free energy of the HMMM. Published hydrophobicity scales from Wimley and White,47 Hessa et al.,48 Radzicka and Wolfenden,21 and Moon and Fleming49 were compared against the transfer free energy from RIV-water to the midpoint of RII-tails in the HMMM model. The dotted lines represent the linear fit of the points, and essential fit information is reported.
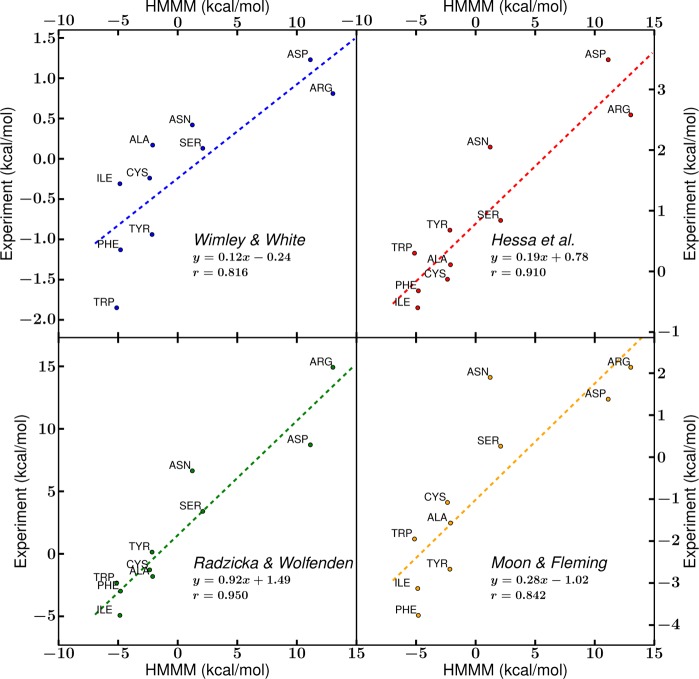
A comparison of free energy for RIV-water → RI-core transfer in the HMMM membrane to the same scales (Figure 11) shows good agreement with the cyclohexane–water scale proposed by Radzicka and Wolfenden21 and modest agreement with scales based on a transfer of side chains within larger transmembrane proteins.48,49 Agreement with the cyclohexane–water scale, as well a related octanol–water scale60 (Figure S1, Supporting Information), is based on the use of an organic solvent-rich RI-core in the HMMM. The low slopes of the trendline that compares the two experimental studies employing membrane proteins48,49 to the HMMM transfer free energies (Figure 11) might be a result of the complexity of the environment surrounding the side chains. Rather than proceeding from a fully solvated to a fully inserted side chain, as in the case of side chain analogues, in the presence of a protein, interactions between neighboring residues lower the energetic cost for membrane entry by providing favorable interactions for buried side chains.59 Comparison to the computational and experimental hydrophobicity scales indicates the relative accuracy of the HMMM model membranes in capturing the energetics of the membrane interface.
Figure 11.
Comparison of hydrophobicity scales to the RIV-water–RI-core transfer free energy of the HMMM. Published hydrophobicity scales from Wimley and White,47 Hessa et al.,48 Radzicka and Wolfenden,21 and Moon and Fleming49 were compared against the transfer free energy from RIV-water to the midpoint of the membrane (within RI-core) in the HMMM model. The dotted lines represent the linear fit of the points, and essential fit information is reported.
Conclusions
The energetic characterization of the highly mobile membrane mimetic (HMMM)14 representation has been presented. The strength of the HMMM model is in its accelerated lipid dynamics, which expedites the formation of optimal protein–lipid interactions, while maintaining an atomistic description of the lipid head groups. A potential drawback of the use of the liquid organic solvent to represent the bilayer core is the introduction of additional fluidity of the core of the membrane and additional polarity, as DCLE14,28 is not as hydrophobic as the lipid tails in a conventional full-tail membrane. Nevertheless, this report shows that the HMMM model captures the interaction energetics of side chains along the membrane interface, a feature that is essential for studying peripheral proteins.
We demonstrate that the energetics of insertion into the interfacial membrane regions for representatives of all classes of protein side chains are generally in good agreement with previously reported computation- and experiment-based values. On the other hand, we observe overstabilization of aromatic, polar, and charged side chains in the center of the HMMM membrane due to the more liquid and polar nature of the organic solvent currently used in HMMM (DCLE) compared to acyl lipid tails. These variations do not appear to interfere with the phenomena at the membrane interface, for which HMMM was specifically developed and is currently used.14,16−20 In particular, it is of value that the HMMM model is capable of capturing the energetic cost of Trp and Tyr insertion into the membrane interface. These amino acids are known to serve as anchors of the transmembrane helices,51−53 especially in single-pass membrane proteins where they ensure proper positioning and tilting within the membrane bilayer. We expect that the HMMM will perform well with single-pass transmembrane helices where aliphatic residues in the core and aromatic side chains at the interface are the most important determinants of the depth of insertion and tilting. Further development to address inaccuracies in the membrane core and to extend the applicability of the model to larger transmembrane systems is currently underway.
Acknowledgments
This work was supported by grants from NIH to E.T. (R01-GM101048, R01-GM086749, U54–GM087519, and P41–GM104601), DOE CSGF Fellowship to J.V.V. (DE-FG02-97ER25308), and NSF Graduate Research Fellowship to M.J.A. Simulations were performed using computer time on XSEDE resources of National Science Foundation (Grant No. MCA06N060) and the Campus Computer cluster Taub at the University of Illinois at Urbana–Champaign. This research also used resources of the National Energy Research Scientific Computing Center (NERSC), which is supported by the Office of Science of the U.S. Department of Energy under Contract No. DE-AC02-05CH11231.
Supporting Information Available
A plot detailing the comparison between the energetics of side chain insertion into the HMMM versus an experimentally measured hydrophobicity scale.60 This material is available free of charge via the Internet at http://pubs.acs.org.
The authors declare no competing financial interest.
Funding Statement
National Institutes of Health, United States
Supplementary Material
References
- Contreras F.-X.; Ernst A. M.; Haberkant P.; Björkholm P.; Lindahl E.; Gönen B.; Tischer C.; Elofsson A.; von Heijne G.; Thiele C.; et al. Molecular Recognition of a Single Sphingolipid Species by a Protein’s Transmembrane Domain. Nature 2012, 481, 525–529. [DOI] [PubMed] [Google Scholar]
- van Meer G.; Voelker D. R.; Feigenson G. W. Membrane Lipids: Where They Are and How They Behave. Nat. Rev. Mol. Cell Biol. 2008, 9, 112–124. [DOI] [PMC free article] [PubMed] [Google Scholar]
- Gennis R. B.Biomembranes: Molecular Structure and Function; Springer-Verlag: New York, 1989. [Google Scholar]
- Engelman D. M. Membranes Are More Mosaic Than Fluid. Nature 2005, 438, 578–580. [DOI] [PubMed] [Google Scholar]
- Lemmon M. A. Membrane Recognition by Phospholipid-Binding Domains. Nat. Rev. Mol. Cell Biol. 2008, 9, 99–111. [DOI] [PubMed] [Google Scholar]
- Stahelin R. V. Lipid Binding Domains: More Than Simple Lipid Effectors. J. Lipid Res. 2009, 50, S299–S304. [DOI] [PMC free article] [PubMed] [Google Scholar]
- Casadio R.; Fariselli P.; Martelli P. L.; Pierleoni A.; Rossi I.; von Heijne G. In Modern Genome Annotation: The BioSapiens Network; Frishman D., Valecia A., Eds.; Springer-Verlag: Vienna, Austria, 2008; Chapter 5.2, pp 309–328. [Google Scholar]
- Scott J. L.; Musselman C. A.; Adu-Gyamfi E.; Kutateladze T. G.; Stahelin R. V. Emerging Methodologies to Investigate Lipidprotein Interactions. Integr. Biol. 2012, 4, 247–258. [DOI] [PMC free article] [PubMed] [Google Scholar]
- Phillips R.; Ursell T.; Wiggins P.; Sens P. Emerging Roles for Lipids in Shaping Membrane-Protein Function. Nature 2009, 459, 379–384. [DOI] [PMC free article] [PubMed] [Google Scholar]
- Phillips J. C.; Braun R.; Wang W.; Gumbart J.; Tajkhorshid E.; Villa E.; Chipot C.; Skeel R. D.; Kale L.; Schulten K. Scalable Molecular Dynamics with NAMD. J. Comput. Chem. 2005, 26, 1781–1802. [DOI] [PMC free article] [PubMed] [Google Scholar]
- Tieleman D. P.; Marrink S. J.; Berendsen H. J. C. A Computer Perspective of Membranes: Molecular Dynamics Studies of Lipid Bilayer Systems. Biochim. Biophys. Acta 1997, 1331, 235–270. [DOI] [PubMed] [Google Scholar]
- Ohkubo Y. Z.; Tajkhorshid E. Distinct Structural and Adhesive Roles of Ca2+ in Membrane Binding of Blood Coagulation Factors. Structure 2008, 16, 72–81. [DOI] [PubMed] [Google Scholar]
- Tavoosi N.; Davis-Harrison R. L.; Pogorelov T. V.; Ohkubo Y. Z.; Arcario M. J.; Clay M. C.; Rienstra C. M.; Tajkhorshid E.; Morrissey J. H. Molecular Determinants of Phospholipid Synergy in Blood Clotting. J. Biol. Chem. 2011, 286, 23247–23253. [DOI] [PMC free article] [PubMed] [Google Scholar]
- Ohkubo Y. Z.; Pogorelov T. V.; Arcario M. J.; Christensen G. A.; Tajkhorshid E. Accelerating Membrane Insertion of Peripheral Proteins with a Novel Membrane Mimetic Model. Biophys. J. 2012, 102, 2130–2139. [DOI] [PMC free article] [PubMed] [Google Scholar]
- Vermaas J. V.; Tajkhorshid E. A Microscopic View of Phospholipid Insertion into Biological Membranes. J. Phys. Chem. B 2013, 10.1021/jp409854w. [DOI] [PMC free article] [PubMed] [Google Scholar]
- Baylon J. L.; Lenov I. L.; Sligar S. G.; Tajkhorshid E. Characterizing the Membrane-Bound State of Cytochrome P450 3A4: Structure, Depth of Insertion, and Orientation. J. Am. Chem. Soc. 2013, 135, 8542–8551. [DOI] [PMC free article] [PubMed] [Google Scholar]
- Pogorelov T. V.; Tajkhoshid E. Glycophorin A Helix Insertion, Positioning, and Dimerization in Model Membranes. Biophys. J. 2012, 102, 413a. [Google Scholar]
- Arcario M. J.; Tajkhoshid E. Capturing Spontaneous Membrane Insertion and Membrane-Induced Conformational Changes of Talin at an Atomic Resolution. Biophys. J. 2012, 102, 301a. [Google Scholar]
- Vermaas J. V.; Tajkhoshid E. Conformational Dynamics of Membrane-Bound α–Synuclein in a Highly Mobile Membrane Mimetic. Biophys. J. 2012, 102, 493a. [Google Scholar]
- Pogorelov T. V.; Ohkubo Y. Z.; Arcario M. J.; Tajkhoshid E. Characterizing Structure and Dynamics of Calcium-Induced Clusters of Phosphatidylserine in Mixed Lipid Bilayers. Biophys. J. 2011, 100, 172a. [Google Scholar]
- Radzicka A.; Wolfenden R. Comparing the Polarities of the Amino Acids: Side Chain Distribution Coefficients Between the Vapor Phase, Cyclohexane, 1-Octanol, and Neutral Aqueous Solution. Biochemistry 1988, 27, 1664–1670. [Google Scholar]
- MacCallum J. L.; Bennett W. F. D.; Tieleman D. P. Distribution of Amino Acids in a Lipid Bilayer from Computer Simulations. Biophys. J. 2008, 94, 3393–3404. [DOI] [PMC free article] [PubMed] [Google Scholar]
- Monticelli L.; Kandasamy S. K.; Periole X.; Larson R. G.; Tieleman D. P.; Marrink S. J. The MARTINI Coarse Grained Forcefield: Extension to Proteins. J. Chem. Theory Comput. 2008, 4, 819–834. [DOI] [PubMed] [Google Scholar]
- Marrink S. J.; Berendsen H. J. C. Permeation Process of Small Molecules Across Lipid Membranes Studied by Molecular Dynamics Simulations. J. Phys. Chem. 1996, 100, 16729–38. [Google Scholar]
- Vanommeslaeghe K.; Hatcher E.; Acharya C.; Kundu S.; Zhong S.; Shim J.; Darian E.; Guvench O.; Lopes P.; Vorobyov I.; et al. CHARMM General Force Field: A Force Field for Drug-like Molecules Compatible with the CHARMM All-Atom Additive Biological Force Fields. J. Comput. Chem. 2010, 31, 671–690. [DOI] [PMC free article] [PubMed] [Google Scholar]
- MacKerell A. D. Jr.; Bashford D.; Bellott M.; Dunbrack R. L. Jr.; Evanseck J. D.; Field M. J.; Fischer S.; Gao J.; Guo H.; Ha S.; et al. All-Atom Empirical Potential for Molecular Modeling and Dynamics Studies of Proteins. J. Phys. Chem. B 1998, 102, 3586–3616. [DOI] [PubMed] [Google Scholar]
- Nagle J. F.; Tristram-Nagle S. Structure of Lipid Bilayers. Biochim. Biophys. Acta 2000, 1469, 159–195. [DOI] [PMC free article] [PubMed] [Google Scholar]
- Arcario M. J.; Ohkubo Y. Z.; Tajkhorshid E. Capturing Spontaneous Partitioning of Peripheral Proteins Using a Biphasic Membrane-Mimetic Model. J. Phys. Chem. B 2011, 115, 7029–7037. [DOI] [PMC free article] [PubMed] [Google Scholar]
- Klauda J. B.; Venable R. M.; Freites J. A.; O’Connor J. W.; Tobias D. J.; Mondragon-Ramirez C.; Vorobyov I.; MacKerell A. D. Jr.; Pastor R. W. Update of the CHARMM All-Atom Additive Force Field for Lipids: Validation on Six Lipid Types. J. Phys. Chem. B 2010, 114, 7830–7843. [DOI] [PMC free article] [PubMed] [Google Scholar]
- MacKerell A. D. Jr.; Feig M.; Brooks C. L. III. Extending the Treatment of Backbone Energetics in Protein Force Fields: Limitations of Gas-Phase Quantum Mechanics in Reproducing Protein Conformational Distributions in Molecular Dynamics Simulations. J. Comput. Chem. 2004, 25, 1400–1415. [DOI] [PubMed] [Google Scholar]
- Jorgensen W. L.; Chandrasekhar J.; Madura J. D.; Impey R. W.; Klein M. L. Comparison of Simple Potential Functions for Simulating Liquid Water. J. Chem. Phys. 1983, 79, 926–935. [Google Scholar]
- Martyna G. J.; Tobias D. J.; Klein M. L. Constant Pressure Molecular Dynamics Algorithms. J. Chem. Phys. 1994, 101, 4177–4189. [Google Scholar]
- Feller S. E.; Zhang Y.; Pastor R. W.; Brooks B. R. Constant Pressure Molecular Dynamics Simulation: The Langevin Piston Method. J. Chem. Phys. 1995, 103, 4613–4621. [Google Scholar]
- Darden T.; York D.; Pedersen L. G. Particle Mesh Ewald: An N·log(N) Method for Ewald Sums in Large Systems. J. Chem. Phys. 1993, 98, 10089–10092. [Google Scholar]
- Kumar S.; Bouzida D.; Swendsen R. H.; Kollman P. A.; Rosenberg J. M. The Weighted Histogram Analysis Method for Free-Energy Calculations on Biomolecules. I. The Method. J. Comput. Chem. 1992, 13, 1011–1021. [Google Scholar]
- Frenkel D.; Smit B.. Understanding Molecular Simulation from Algorithms to Applications; Academic Press: San Diego, CA, 2002. [Google Scholar]
- Hess B.; Kutzner C.; van der Spoel D.; Lindahl E. GROMACS 4: Algorithms for Highly Efficient, Load-Balanced, and Scalable Molecular Simulation. J. Chem. Theory Comput. 2008, 4, 435–447. [DOI] [PubMed] [Google Scholar]
- Hub J. S.; de Groot B. L.; van der Spoel D. g_wham-a Free Weighted Histogram Analysis Implementation Including Robust Error and Autocorrelation Estimates. J. Chem. Theory Comput. 2010, 6, 3713–3720. [Google Scholar]
- Efron B. Bootstrap Methods: Another Look at the Jackknife. Ann. Stat. 1979, 7, 1–26. [Google Scholar]
- Chernick M. R.Bootstrap Methods: A Guide for Practitioners and Researchers, 2nd ed.; Wiley-Interscience: New York, 2007. [Google Scholar]
- Zwanzig R. W. High-Temperature Equation of State by a Perturbation Method. I. Nonpolar Gases. J. Chem. Phys. 1954, 22, 1420–1426. [Google Scholar]
- Pohorille A.; Jarzynski C.; Chipot C. Good Practices in Free-Energy Calculations. J. Phys. Chem. B 2010, 114, 10235–10253. [DOI] [PubMed] [Google Scholar]
- Zacharias M.; Straatsma T. P.; McCammon J. A. Separation-Shifted Scaling, a New Scaling Method for Lennard-Jones Interactions in Thermodynamic Integration. J. Chem. Phys. 1994, 100, 9025–9031. [Google Scholar]
- Bennett C. H. Efficient Estimation of Free Energy Differences from Monte Carlo Data. J. Comput. Phys. 1976, 22, 245–268. [Google Scholar]
- Liu P.; Dehez F.; Cai W.; Chipot C. A Toolkit for the Analysis of Free-Energy Perturbation Calculations. J. Chem. Theory Comput. 2012, 8, 2606–2616. [DOI] [PubMed] [Google Scholar]
- Humphrey W.; Dalke A.; Schulten K. VMD – Visual Molecular Dynamics. J. Mol. Graphics 1996, 14, 33–38. [DOI] [PubMed] [Google Scholar]
- Wimley W. C.; White S. H. Experimentally Determined Hydrophobicity Scale for Proteins at Membrane Interfaces. Nat. Struct. Biol. 1996, 3, 842–848. [DOI] [PubMed] [Google Scholar]
- Hessa T.; Kim H.; Bihlmaier K.; Lundin C.; Boekel J.; Andersson H.; Nilsson I.; White S. H.; von Heijne G. Recognition of Transmembrane Helices by the Endoplasmic Reticulum Translocon. Nature 2005, 433, 377–381. [DOI] [PubMed] [Google Scholar]
- Moon C. P.; Fleming K. G. Side-Chain Hydrophobicity Scale Derived from Transmembrane Protein Folding into Lipid Bilayers. Proc. Natl. Acad. Sci. U.S.A. 2011, 108, 10174–10177. [DOI] [PMC free article] [PubMed] [Google Scholar]
- Aliste M. P.; Tielemann D. P. Computer Simulation of Partitioning of Ten Pentapeptides Ace-WLXLL at the Cyclohexane/water and Phospholipid/water Interfaces. BMC Biochem. 2005, 6, 30. [DOI] [PMC free article] [PubMed] [Google Scholar]
- Norman K. E.; Nymeyer H. Indole Localization in Lipid Membranes Revealed by Molecular Simulation. Biophys. J. 2006, 91, 2046–2054. [DOI] [PMC free article] [PubMed] [Google Scholar]
- Yau W.-M.; Wimley W. C.; Gawrisch K.; White S. H. The Preference of Tryptophan for Membrane Interfaces. Biochemistry 1998, 37, 14713–14718. [DOI] [PubMed] [Google Scholar]
- Killian J. A.; von Heijne G. How Proteins Adapt to a Membrane-Water Interface. Trends Biochem. Sci. 2000, 25, 429–434. [DOI] [PubMed] [Google Scholar]
- Hristova K.; Wimley W. C. A Look at Arginine in Membranes. J. Membr. Biol. 2011, 239, 49–56. [DOI] [PMC free article] [PubMed] [Google Scholar]
- Dorairaj S.; Allen T. W. On the Thermodynamic Stability of a Charged Arginine Side Chain in a Transmembrane Helix. Proc. Natl. Acad. Sci. U.S.A. 2007, 104, 4943–4948. [DOI] [PMC free article] [PubMed] [Google Scholar]
- Krepkiy D.; Mihailescu M.; Freites J.; Schow E.; Worcester D.; Gawrisch K.; Tobias D.; White S.; Swartz K. Structure and Hydration of Membranes Embedded with Voltage-Sensing Domains. Nature 2009, 462, 473–U168. [DOI] [PMC free article] [PubMed] [Google Scholar]
- Johansson A. C. V.; Lindahl E. Amino-Acid Solvation Structure in Transmembrane Helices from Molecular Dynamics Simulations. Biophys. J. 2006, 91, 4450–4463. [DOI] [PMC free article] [PubMed] [Google Scholar]
- Gumbart J.; Chipot C.; Schulten K. Free-Energy Cost for Translocon-Assisted Insertion of Membrane Proteins. Proc. Natl. Acad. Sci. U.S.A. 2011, 108, 3596–3601. [DOI] [PMC free article] [PubMed] [Google Scholar]
- Gumbart J.; Roux B. Determination of Membrane-Insertion Free Energies by Molecular Dynamics Simulations. Biophys. J. 2012, 104, 795–801. [DOI] [PMC free article] [PubMed] [Google Scholar]
- Wimley W. C.; Creamer T. P.; White S. H. Solvation Energies of Amino Acid Side Chains and Backbone in a Family of Host-Guest Pentapeptides. Biochemistry 1996, 35, 5109–5124. [DOI] [PubMed] [Google Scholar]
Associated Data
This section collects any data citations, data availability statements, or supplementary materials included in this article.


