Abstract
Ultrafast pump–probe measurements can discriminate the two forms of melanin found in biological tissue (eumelanin and pheomelanin), which may be useful for diagnosing and grading melanoma. However, recent work has shown that bound iron content changes eumelanin’s pump–probe response, making it more similar to that of pheomelanin. Here we record the pump–probe response of these melanins at a wider range of wavelengths than previous work and show that with shorter pump wavelengths the response crosses over from being dominated by ground-state bleaching to being dominated by excited-state absorption. The crossover wavelength is different for each type of melanin. In our analysis, we found that the mechanism by which iron modifies eumelanin’s pump–probe response cannot be attributed to Raman resonances or differences in melanin aggregation and is more likely caused by iron acting to broaden the unit spectra of individual chromophores in the heterogeneous melanin aggregate. We analyze the dependence on optical intensity, finding that iron-loaded eumelanin undergoes irreversible changes to the pump–probe response after intense laser exposure. Simultaneously acquired fluorescence data suggest that the previously reported “activation” of eumelanin fluorescence may be caused in part by the dissociation of metal ions or the selective degradation of iron-containing melanin.
Introduction
Melanins are biological pigments that are found in human skin in two forms: black/brown eumelanin and red/brown pheomelanin. Pump–probe microscopy1 can discriminate these pigments nondestructively in situ2 and in vivo.3 This technology has shown that increased eumelanin content correlates with increasing severity of a melanoma diagnosis.4 Recently, we found that pump–probe microscopy is also sensitive to the iron content in eumelanin;5 however, under the conditions previously used to differentiate eumelanin from pheomelanin, iron-loaded eumelanin shares a similar pump–probe response with pheomelanin, making them difficult to discriminate.
Characterizing the factors that influence melanin’s pump–probe response has important applications for melanoma research. The histological diagnosis of melanoma is fraught with uncertainty;6 new indicators could potentially increase the certainty of diagnosis, which could not only help catch melanomas that might otherwise be missed but also decrease wasted healthcare costs associated with false positives. Melanoma metastases have elevated ferritin levels,7 which may result in increased iron content in cutaneous melanin that would be detectable using pump–probe microscopy. Oxidative stress helps melanomas progress toward metastasis;8 oxidative damage to melanins could be indicative of malignancy. Additionally, melanin aggregate size may be relevant to melanoma diagnosis because small melanin aggregates are less efficient at converting absorbed light to heat.9 They may, instead, produce free-radicals, which could lead to malignancy.
This work presents the pump–probe response of iron-loaded eumelanin, eumelanin with metals removed, and pheomelanin, at a wider range of wavelengths than previous work.2 In general, we find that at shorter pump wavelengths λpu, the response crosses over from a predominantly ground-state bleaching signal to an excited state absorption signal. The crossover wavelength λpu,x is different for each type of melanin, and we find that iron shifts eumelanin’s λpu,x to shorter wavelengths. To identify the mechanism by which iron shifts λpu,x, we characterize the effects of chemical oxidation, photodamage, and aggregate size. We find that iron’s modification of the eumelanin pump–probe response cannot be attributed to differences in aggregation or Raman resonances. After considering recent theoretical models of eumelanin’s optical absorption, we conclude that iron shifts λpu,x as a consequence of broadening the near-infrared absorption bands of individual chromophores in the heterogeneous melanin aggregate.
Another challenge to differentiating types of melanin stems from the changes in pump–probe response exhibited with increasing optical intensity. We analyze the dependence of the pump–probe response on optical intensity, finding that eumelanin likely exhibits a pump- and probe-dependent saturation, whereas pheomelanin and iron-loaded eumelanin exhibit a nonlinear excited state absorption. At very high power levels, the iron-loaded eumelanin, in particular, undergoes irreversible changes to the pump–probe response. The laser exposure necessary to cause these changes is similar to the previously reported levels necessary to enhance eumelanin fluorescence.10 This suggests that the previously reported “activation” of eumelanin fluorescence may be caused in part by the dissociation of metal ions or the selective degradation of iron-containing melanin, thus reducing fluorescence quenching.
Experimental Methods
Melanins used in this study were natural and synthetic. Pheomelanin was synthesized according to a previously reported method.11 Eumelanin samples were identical to those used in a previous experiment.12 Eumelanin from Sepia officinalis was purchased from Sigma-Aldrich and washed with EDTA to remove metals, as previously reported.12 A portion of the EDTA washed eumelanin was then saturated with iron(III) chloride according to the previously reported method.12 Iron content was measured with inductively coupled plasma mass spectrometry (ICP-MS), as previously reported:12 The iron-saturated eumelanin contained 27 494 ppm iron, and the EDTA-washed eumelanin contained only 30 ppm iron. Sepia melanin was separated by aggregate size, as previously reported.9 To prepare for imaging, the eumelanin samples were suspended in a drop of ultrapure water and evaporated on a slide to produce a thin layer of melanin particles. The synthetic pheomelanin, a fine powder, was embedded in agarose, thinly sliced, and allowed to dry, as previously reported.13
Photodamage and oxidative damage studies in human eumelanin were conducted on black human hair cross sections. These were prepared by first embedding the hair in paraffin wax and then slicing the paraffin block into 5 μm slices. This slice was then placed on a glass slide. Melanin oxidation studies were performed using a flow cell. A solution of 5% hydrogen peroxide continuously flowed over the black hair cross section while images were acquired.
The laser system used for the majority of pump–probe experiments (illustrated in Figure 1) was a mode-locked, titanium-sapphire laser (Chameleon, Coherent, Inc.) pumping a tunable, intracavity frequency-doubled optical parametric oscillator (Mira-OPO, Coherent, Inc.), both producing optical pulses with 5 nm bandwidth. The pulses from each source were compressed with prism pairs down to approximately 250 fs fwhm, as measured by two-photon absorption cross-correlation in rhodamine-6G. The pump beam was intensity-modulated using an acousto-optic modulator (AOM) at 2 MHz. The pump and probe beams were combined collinearly and sent into a home-built scanning microscope fitted with a 40×, 0.75 NA objective (Olympus). Both beams transmitted through the sample were collected with a 1.1 NA condenser (Olympus). The pump was blocked using a stack of appropriate chromatic filters, and then the probe was detected by an amplified photodiode. A lock-in amplifier (Stanford Research Systems 844) detected the modulation passed from the pump beam to the probe beam. Normal imaging conditions were around 0.1 mW of each beam measured at the sample. Unless otherwise indicated, powers reported were measured before the microscope. Scan speeds were normally 25 ms/line with 512 pixels per line across a 400 μm field of view. Backscattered fluorescence was collected using a 600 nm short-pass dichroic filter (Thorlabs FES0600) and a photomultiplier tube (Hamamatsu, R3896).
Figure 1.
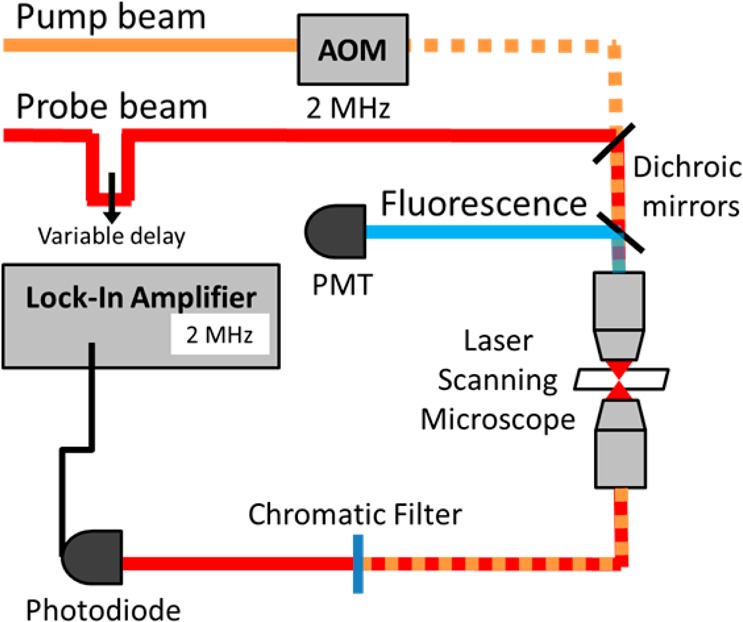
Diagram of pump–probe laser system.
A separate system was used to simultaneously measure the pump–probe response and fluorescence for hair samples. The system is similar to the one described above with minor alterations, primarily consisting of equipment. The probe beam is generated with a Tsunami Ti:sapphire oscillator (Newport) tuned to 810 nm, which also pumps an Opal-OPO (Newport) tuned to 1430 nm (chosen to optimize output power and stability). The output is then doubled with a BBO crystal to produce a 730 nm pump beam. The two beams are then coupled into a commercial Zeiss LSM 510 microscope. Custom detection instrumentation, including lock-in-amplifier, integrate pump–probe microscopy with other detection ports of the LSM microscope (e.g., confocal and multiphoton detection). The cross-correlation of the two beams measured in rhodamine-6G is ∼190 fs.
Pump–probe response curves were acquired by varying the time delay between the pump and probe pulses using a motorized stage, as a stack of images was acquired. Pump–probe response curves shown here are averages of the entire field of view. By convention, we set the lock-in amplifier phase so that a positive signal indicates an increase in absorption of the probe. Fluorescence images are averages of all interpulse delay times.
Results
Figure 2 shows the pump–probe response of EDTA-washed Sepia eumelanin, iron-loaded Sepia eumelanin, and synthetic pheomelanin, at λpr = 815 nm probe, scanning the pump from λpu = 700 to λpu = 725 nm in 5 nm increments. The data are normalized to either positive or negative peaks (whichever is greater) to facilitate comparison of the shape of the pump–probe response curves. We refer to signals that require the pulses to be overlapped in time as “instantaneous”, and signals that persist beyond the 250 fs cross-correlation of the pulses as “time-delayed”. Instantaneous signal contributions may include two-photon absorption (positive signal), stimulated Raman gain (negative, only if λpu < λpr), stimulated Raman loss (positive, only if λpu > λpr), and optical Kerr lensing (which is minimized by using a high-NA condenser optic).14 Time-delayed signal contributions may include excited state absorption (positive), stimulated emission (negative, only if λpu < λpr), and ground state bleaching (negative).15 Though we cannot rule out stimulated emission, ground state bleaching is a more likely explanation for the negative signals we report here (see Discussion).
Figure 2.
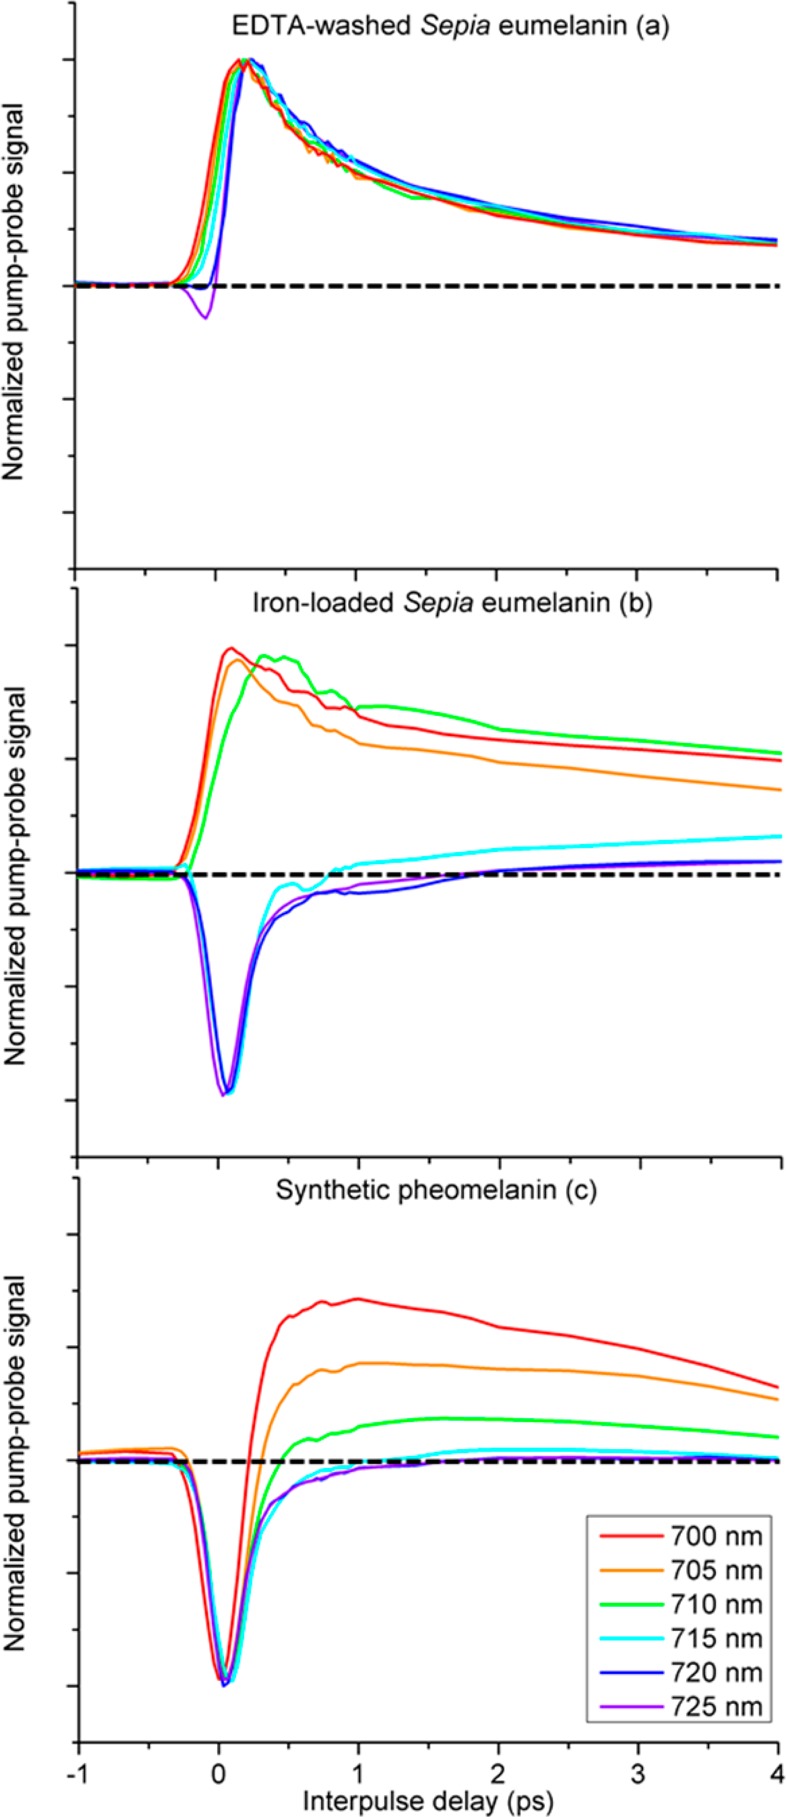
Pump–probe response of dry melanins. Probe wavelength is set at 815 nm. Pump wavelength is varied from 700 to 725 nm. Data are normalized to the largest peak and smoothed using a 5 point, second-degree polynomial Savitzky–Golay filter to facilitate comparison of response curves with variable SNR levels.16
EDTA-washed eumelanin has an excited state absorption for all pump wavelength shown here (700 nm ≤ λpu ≤ 725 nm) and has a small instantaneous negative signal only for the lowest energy pump, λpu = 725 nm. Iron-loaded eumelanin has an excited state absorption at λpu ≤ 710 nm with a longer lifetime, and a negative signal with both instantaneous and time-delayed components at λpu ≥ 715 nm. Pheomelanin has a negative instantaneous at all pump wavelengths (700 nm ≤ λpu ≤ 725 nm); its time-delayed signal shows ground state bleaching at λpu ≥ 715 nm and an increasingly dominant excited state absorption with λpu < 715 nm, confirming the trend established by our previous measurements.2
Though the addition of iron to eumelanin only causes a slight change to the optical absorption spectrum,17 it causes a dramatic change to the pump–probe response at λpu ≥ 715 nm, as seen in Figure 2b. The negative response of iron-loaded eumelanin at λpu ≥ 715 nm is short-lived and may, in principle, be attributable to either stimulated Raman loss or ground state bleach with a short lifetime. Given the 5 nm bandwidth of our pulses, the wavelengths scanned in Figure 2 can stimulate Raman loss in the probe for transitions in the range of 1280—2120 cm–1. In this range, Eumelanin has resonances at 1400 cm–1 and 1600 cm–1, with a weak iron-specific Raman line at 1470 cm–1.17 To test whether stimulated Raman scattering is a significant contribution to the pump–probe response, we conducted two measurements--one with the λpu and λpr swapped, the other with a wider range of λpu.
Swapping the pump–probe wavelengths will confirm the presence of a significant Raman contribution if the instantaneous signal changes sign: In one configuration, λpu < λpr, stimulated Raman scattering induces a loss in the probe (negative signal). In the other configuration, λpu > λpr, stimulated Raman scattering induces a gain in the probe (positive signal). In Figure 2, λpu < λpr, and the negative instantaneous signals at λpu = 715, 720, and 725 nm are possibly stimulated Raman loss. But in Figure 3, where we swapped λpu and λpr, the response of iron-loaded eumelanin at λpr = 715, 720, and 725 nm does not change sign, indicating that Raman scattering is not a major contribution.
Figure 3.
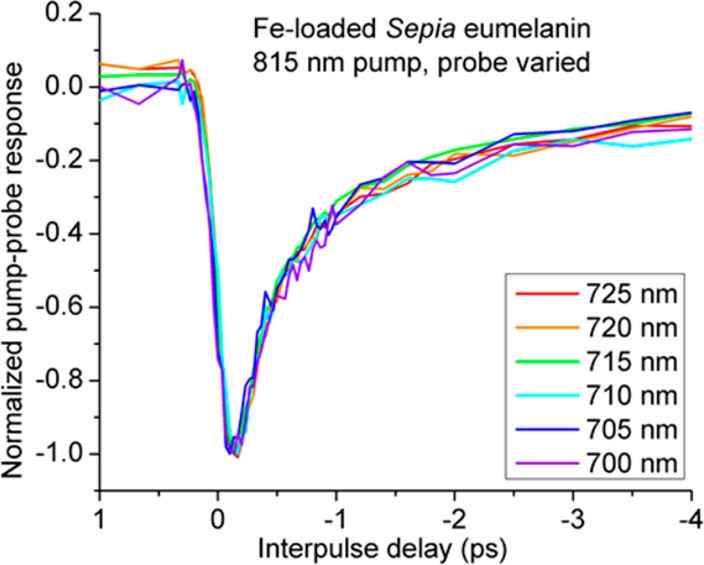
Normalized pump–probe response of dry iron-loaded eumelanin. Pump wavelength is set at 815 nm. Probe wavelength is varied between 700 and 725 nm. Data are normalized to the largest peak. In this arrangement (λpu > λpr), stimulated Raman gain is expected to produce a positive instantaneous signal.
Scanning a wider range of pump wavelengths will confirm a Raman contribution to the signal if the magnitude of the instantaneous pump–probe response varies proportionally to the Raman spectrum. To span all three Raman lines associated with eumelanin and with iron-loaded eumelanin (1350–1650 cm–1 including associated Raman line bandwidths), we measured the response of iron-loaded eumelanin at λpr = 805 nm, scanning the pump from λpu = 712 to λpu = 728 nm in 4 nm increments. (The OPO was not stable at 815/745 nm, so we shifted the scan to start at 805/728 nm. Although this may change the time-delayed response, the Raman response remains unaffected, as it depends only on the difference in pump and probe wavelength.) To compare the amplitude of signals across different wavelengths, we normalize the pump–probe data by the magnitude of the 2-photon absorption cross-correlation measured in rhodamine 6G. Figure 4 shows the results, along with the approximate locations and bandwidths of the Raman peaks and their overlap with the bandwidth of the pump and probe beams. Clearly, the magnitude of the instantaneous negative pump–probe signal is Figure 4b does not track with the Raman spectrum of eumelanin, further confirming that stimulated Raman is not a major contribution to the pump–probe response, and that differences in Raman spectra cannot account for the differences in pump–probe response caused by adding iron to eumelanin.
Figure 4.
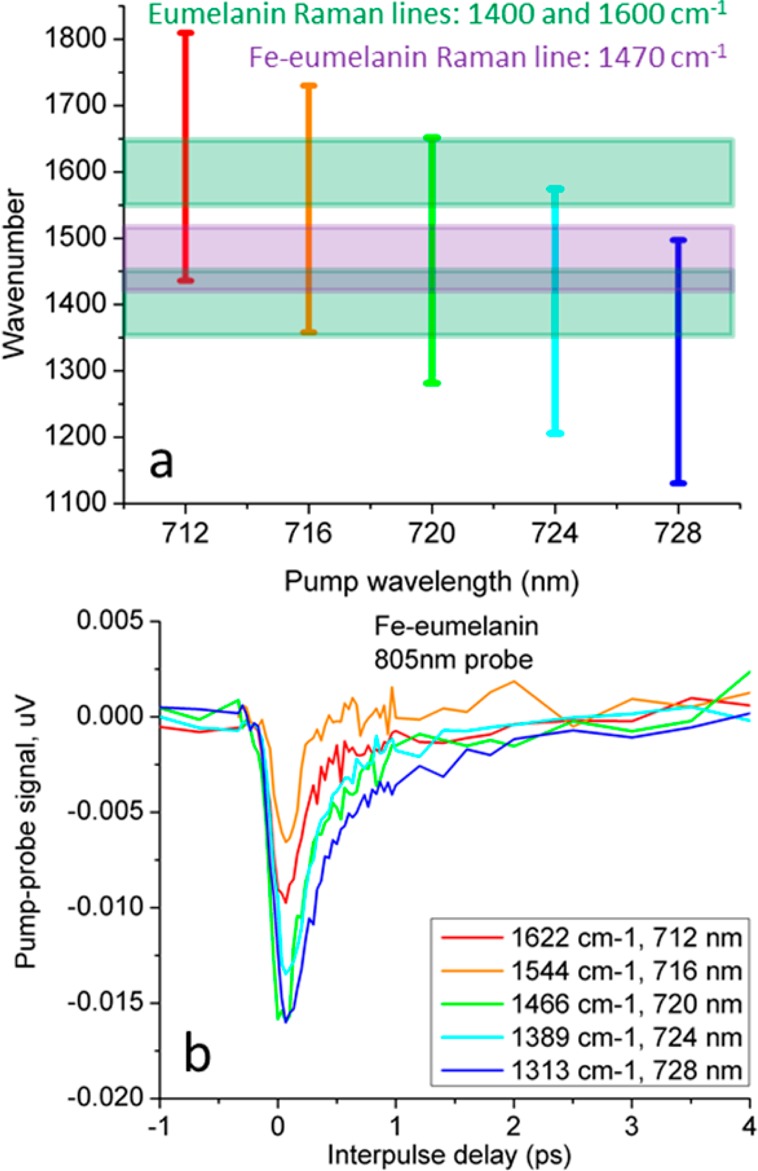
(a) Corresponding wavenumber bandwidths for 805 nm probe wavelength with various pump wavelengths. Overlaid are previously reported Raman bands with their corresponding bandwidths. (b) Pump–probe response of iron-loaded eumelanin at varying wavenumber differences. Data are normalized according to the Rhodamine 6G two-photon absorption.
Earlier measurements found that the near-infrared pump–probe response of melanins scaled linearly with the product of pump and probe intensities, at low optical intensities, by the standard method of fitting a line to a plotting of the log of signal magnitude with respect to the log of optical intensity.1,2 Here we performed a more detailed experiment to separate signal components that are linear with respect to the product of pump and probe intensities from those that are quadratic with respect to either the pump or probe. For each sample, we acquired a set of data at nine different pump and probe power levels (restricting intensity to below that which causes a noticeable change in the pump–probe signal upon repeated scanning). Figure 5 shows the resulting power-dependent responses. Figure 5a shows that the form of the EDTA-washed eumelanin response does not change appreciably under optical intensities comparable to the results in refs (1) and (2) (our objective NA greater by a factor of 3, making the intensity greater by a factor of 9, for the same power) and remains stable until approximately 0.3 mW total power (data not shown), at which visible damage ensues. The power dependence of the other two pigments is very different at higher intensities. Figure 5b shows that for the iron-loaded eumelanin, as the total power level increases, the ground state bleaching signal initially increases and then it decreases as it competes with an increasing excited state absorption signal. Synthetic pheomelanin also has an excited state absorption that grows in with increasingly high power levels. This excited state absorption competes with the ground state bleaching signal and shortens its apparent lifetime.
Figure 5.
Pump–probe responses of EDTA-washed Sepia eumelanin, iron-loaded Sepia eumelanin, and synthetic pheomelanin at varying power levels. Data are unnormalized. Pump wavelength is 720 nm; probe wavelength is 815 nm.
At high intensities, the pump–probe response of iron-loaded eumelanin changes irreversibly. The responses of pheomelanin and EDTA-washed eumelanin do not undergo irreversible changes in the power limits investigated thus far, so we focus our attention to eumelanins containing iron. An irreversible change to the pump–probe response (observed as both a change in pump–probe response form and a decrease in the magnitude of the pump–probe signal, herein referred to as pump–probe photobleaching) is likely caused by chemical changes to the melanins. Because high power can also enhance melanin fluorescence,10 we investigate how the pump–probe response changes correlate with melanin fluorescence enhancement. Figure 6 shows images of iron-loaded eumelanin at four power levels. Due to the spatial heterogeneity of these results, the pump–probe data in Figure 6 are rendered as false-color images, using phasor analysis.18 Each pixel is colored to indicate the degree of similarity to the pump–probe response of EDTA-washed eumelanin (red) or iron-loaded eumelanin (green). Fluorescence intensity (collected with a PMT, 680 nm dichroic, a 600 nm short-pass filter, and a BG-39 filter to reject near-IR scattered light) is overlaid in white. Melanin granules with notable behavior over the course of the power study are highlighted. The white box (with zoom inset) shows a melanin granule that first shifts from green to yellow, then pump–probe photobleaches, and finally begins to fluoresce. The magenta arrow shows a granule of melanin where the pump–probe response form gradually shifts from similar to iron-loaded eumelanin to resembling that of EDTA-washed eumelanin. When an image is taken at low power after exposure to high power (not shown), the melanin granules maintain their new pump–probe response, showing that the change is irreversible. Additionally, changes to the melanin morphology, such as the piece of melanin shrinking as power increases from 0.3 to 0.7 mW (white box in Figure 6) are irreversible. Note that the pump–probe response and induced fluorescence is heterogeneous across the field of view. Kerimo et al. also found that melanin fluorescence activation takes variable amounts of optical intensity to induce and that melanin fluorescence was prone to photobleach under these conditions. Fluorescence enhancement was also found in a fraction of the melanin sampled and most often seen in melanin granules undergoing morphological changes.10
Figure 6.

Images of iron-loaded Sepia eumelanin at various total power levels taken in succession with 720 nm pump, 815 nm probe. Color scheme: Green pixels have a pump–probe response similar to that of the iron-loaded eumelanin standard. Red pixels are similar to the response of EDTA-washed eumelanin. The black and white overlaid image represents the multiphoton fluorescence channel. The white box (with zoom inset) shows a melanin granule that first pump–probe photobleaches and then begins to fluoresce. The magenta arrow shows a granule of melanin where the pump–probe response form gradually shifts from similar to iron-loaded eumelanin to resembling that of EDTA-washed eumelanin.
Physiological iron content is much lower than in our iron-loaded sepia eumelanin.19 To test whether our finding from Figure 6 applies to eumelanin with physiologically relevant metal ion content, we imaged a black hair cross section, embedded in paraffin wax. The samples were imaged using a 20×, 0.8NA Zeiss objective, starting at 0.1 mW total powers until reaching ∼2 mW, measured at the sample (Figure 7b, part 1). Then the samples were reimaged in decreasing power intervals (Figure 7b, part 2). The average spectrum for each image is shown in Figure 7a, where the solid lines correspond to part 1 and the dashed lines to part 2. As power levels increase, the pump–probe response curves have increasing levels of excited state absorption and decreasing levels of ground state bleaching, taking on more EDTA-washed eumelanin form (Figure 2). When the samples were reimaged at decreasing power levels, the response curves did not return to their original forms, indicating that high power levels cause irreversible damage.
Figure 7.
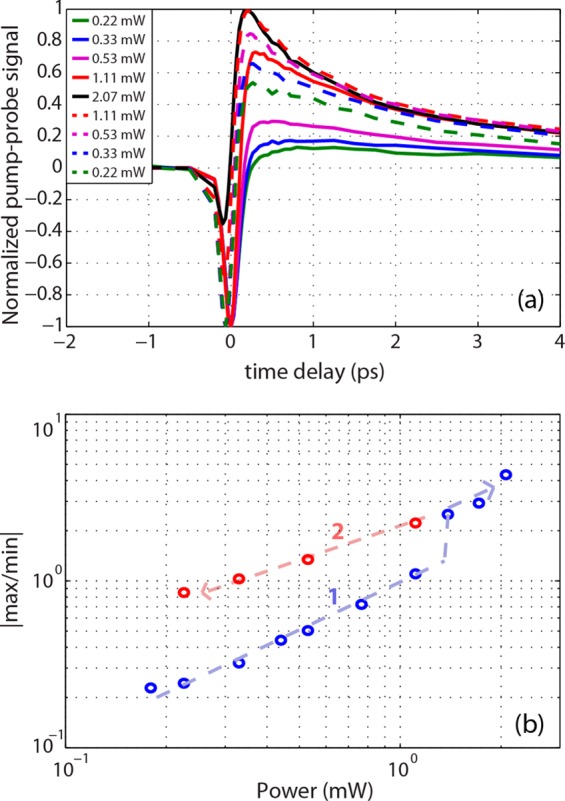
(a) Pump–probe response of black hair as a function of power. Solid lines are taken with increasing power levels, and the dashed lines are taken with decreasing power levels after reaching the maximum power of 2 mW. Spectra were normalized by the maximum of the absolute value. (b) Ratio of maximum signal to minimum signal with increasing power. Arrows indicate the sequence of the experiment. Pump wavelength is 730 nm; probe wavelength is 810 nm.
Figure 7b displays the data according to the way the ratio of the positive peak to the negative peak changes with power level. Note that from ∼0.1 to 1.1 mW, the spectra trace one path, and for powers >1.1mW, they trace another. Interestingly, the spectra continue on this new path after decreasing the power again in part 2, clearly indicating irreversible changes occur above ∼1 mW average power, which is the same as that reported by Kerimo et al. to activate fluorescence with NIR.10 Although the laser systems have different peak powers, Kerimo et al. found that activation occurs even with continuous wave laser exposure, indicating that peak power is less significant than average power.10 The similar average power required for these two phenomena suggests they may have a common cause.
We simultaneously acquired fluorescence while imaging the hair but did not find bulk fluorescence activation under these conditions. Figure 8 shows average melanin fluorescence at different power levels. Not purging the sample with nitrogen most likely caused the melanins undergoing fluorescence activation to photobleach.10,20
Figure 8.
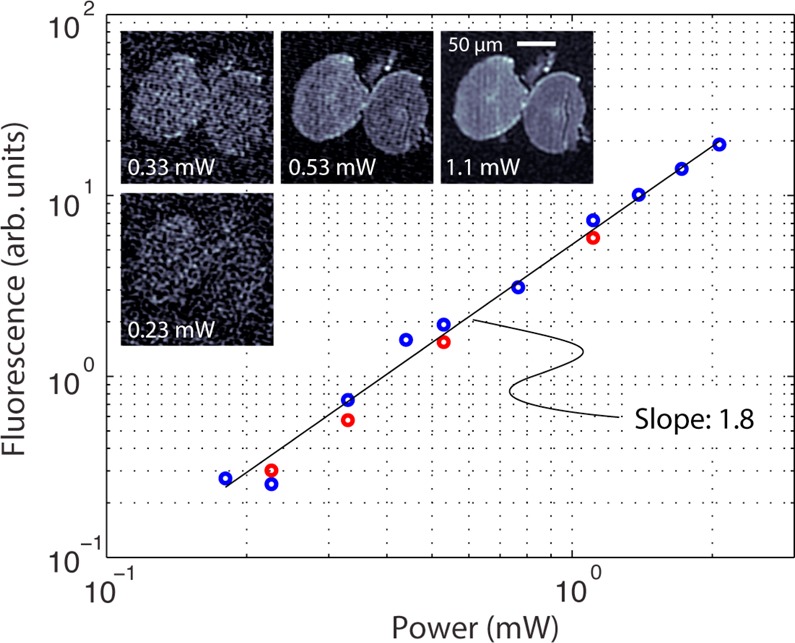
Power dependence of melanin fluorescence in black hair. As with Figure 7, blue circles are taken with increasing power levels, and the red circles are taken with decreasing power levels after reaching the maximum power of 2 mW.
Though we did not observe fluorescence activation in the hair cross sections, it is clear from Figure 6 that iron-loaded eumelanin fluoresces when photodamaged, and from Figures 6 and 7 that photodamage manifests itself by shifting the pump–probe response toward that of EDTA-washed eumelanin. To test how iron affects melanin fluorescence, we collected fluorescence images for iron-loaded and EDTA-washed eumelanin at different power levels. Shown in Figure 9, at low power levels, EDTA-washed eumelanin is fluorescent, whereas iron-loaded eumelanin is not, but iron-loaded eumelanin fluoresces when exposed to higher optical intensity.
Figure 9.
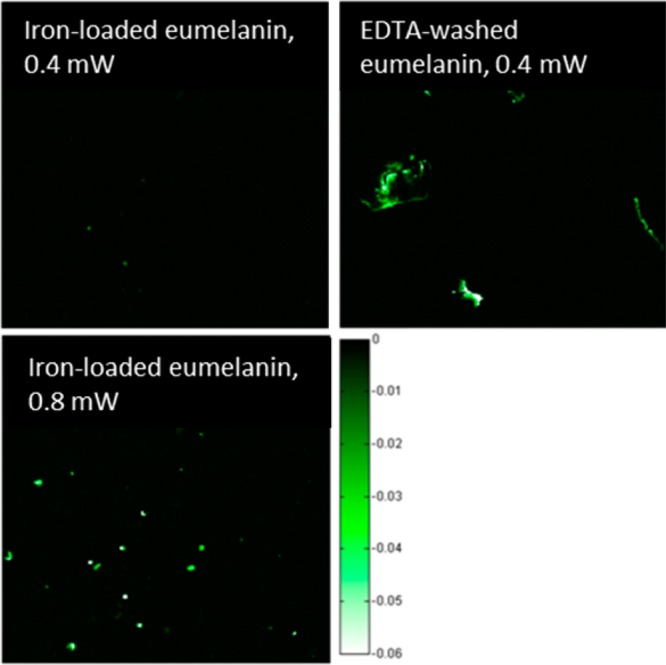
Multiphoton fluorescence of dry melanins at 0.4 and 0.8 mW total power with 720 nm pump and 815 nm probe.
Chemical oxidation causes similar changes to the pump–probe signal as high laser intensity. Figure 10 shows the pump–probe response of a black hair cross section being gradually oxidized chemically via hydrogen peroxide. The data are normalized to the negative instantaneous signal because the focal position was optimized at the beginning of every scan due to fluctuations in the flow cell focal position and because signal decreased throughout the experiment due to gradual photobleaching and the amount of melanin decreasing due to oxidative dissolution. Power levels were kept low (0.1 mW for each beam) in the interest of isolating the effects of chemical oxidation from photodamage, so no fluorescence was obtained, but it has been previously reported that chemical oxidation increases UV-induced fluorescence.21 Using higher power could have caused detrimental melanin pump–probe photobleaching, intensity-related changes to the pump–probe signal independent of the chemical oxidation, or even accelerated the chemical changes to the melanin.22 Similarly to Figure 7, the excited state absorption increases and ground state bleaching decreases as the melanin becomes increasingly damaged. As the experiment proceeds, we see a response more closely resembling that of EDTA-washed eumelanin, suggesting that one of the effects of chemical oxidation is to break the iron–eumelanin bond.
Figure 10.
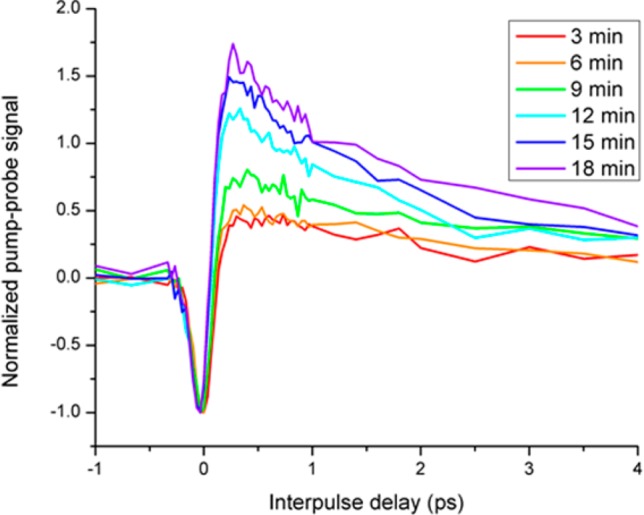
Pump–probe response of a black hair cross section as it is chemically oxidized. Data are normalized to the negative peak because the focal position changed throughout the experiment and to account for pump–probe photobleaching independent of the changes to the pump–probe response. Pump wavelength is 720 nm; probe wavelength is 815 nm.
Suspecting that the iron-eumelanin bonds were breaking through oxidation (Figure 10) or high power (Figure 7), we considered consequences that this bond breakage may have that would modify the pump–probe response: changing the unit spectra of individual chromophores, and/or changing the melanin aggregate size. Piletic et al. previously suggested that the pump–probe response differences between eumelanin and pheomelanin could be attributed to melanin aggregate size differences.2 Natural Sepia eumelanin has particles that are on average 146 nm. EDTA-washing reduces particles to 138 nm; subsequent iron-loading increases particle size to 143 nm.19 If iron affects the response of eumelanin through aggregation, then we would expect that increasing aggregate size and increasing iron content would have the same effect. We test this with several different filtered sizes of eumelanin particles at λpu = 720 nm, λpr = 815 nm, where loading eumelanin with iron changes the response from excited state absorption (positive) to ground state bleaching (negative). Figure 11 shows that increasing eumelanin aggregation has the opposite effect on the response when compared with iron loading: small aggregates have a ground state bleaching response, and large aggregates have an excited state absorption. Therefore, iron modifies the pump–probe response through some mechanism other than aggregation.
Figure 11.
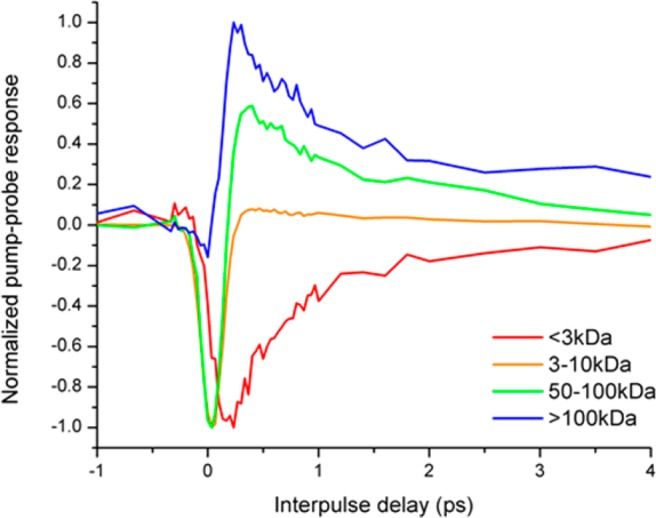
Pump–probe responses of different molecular weight aggregates of Sepia eumelanin. Pump wavelength is 720 nm; probe wavelength is 815 nm.
Because sample preparation can dramatically change the size of melanin aggregates,23 poorly controlled sample preparation methods could cause the aggregate size to be a confounding factor in experiments where the metal content is varied. Although sample preparation methods were identical for EDTA-washed eumelanin and iron-loaded eumelanin, additional EDTA-washing experiments were performed on natural melanin12 (previously purified directly from Sepia officinalis as opposed to Sigma-Aldrich), from another bottle of Sigma Sepia melanin, and on melanin in a black hair cross-section (data not shown) to verify the trend observed in Figure 2a,b. In both cases, EDTA-washing caused the same changes to the pump–probe response under the λpu = 720/λpr = 810 nm experimental conditions: The instantaneous negative signal decreased and the excited state absorption signal increased, although the negative signal did not always completely disappear. From this we conclude that sample preparation procedures are not the source of pump–probe signal differences in Figure 2. Care should be taken when the chemical composition of melanins is varied to ensure the aggregate size is well-controlled.
Discussion
Summary and Physical Interpretation
Previously we found that the two major classes of melanin, eumelanin, and pheomelanin, have sufficient differences in their wavelength-dependent pump–probe responses to be leveraged for imaging contrast.2,4 We have also found that the iron content of eumelanin dramatically changes the pump–probe response.5 even though iron only causes slight changes to the linear optical absorption spectrum.17 Here, we have characterized the response of these melanins for a range of λpu from 700 to 725 nm (Figure 2) and ruled out differences in Raman resonances and changes in aggregation as mechanisms of iron’s influence on the pump–probe response of eumelanin (Figures 3, 4, and 11).
Turning our attention to the time-delayed (t > 250 fs) response, we consider how these melanins differ, and what underlying causes might account for the differences. A positive time-delayed response (signaling a decrease in detected probe intensity when the pump is on) may be unambiguously interpreted as an excited state absorption, whereas a negative response may be attributed to both stimulated emission and excited state absorption (both of which can increase the detected probe intensity when the pump is on). Stimulated emission is ruled out when λpr < λpu, but even when this is not the case, it is unlikely to be a significant contributor to the pump–probe response of melanins because the requirements for stimulated emission are very restrictive compared with ground state bleaching. Stimulated emission will be observed only for relaxation pathways that specifically involve energy levels that have dipole-allowed transitions to the lower-energy states that are both resonant with λpr and are aligned with the probe polarization vector. Ground state bleaching, on the other hand, will be observed regardless of the relaxation pathways. In melanins, optical excitations relax via a large number of energy transfer pathways, as evidenced by rapid nonradiative relaxation and rapid fluorescence anisotropy decay.24,25 It is unlikely that a significant fraction of these relaxation pathways meet the relatively strict conditions for stimulated emission. Therefore, we attribute the negative signals observed here solely to ground state bleaching.
With the exception of EDTA-washed eumelanin, we have observed that the transient response of melanins at λpr ∼810—815 nm crosses over from a response dominated by ground state absorption to one dominated by excited state absorption as we tune λpu from 750 to 700 nm (see Figure 2 of this manuscript and Figure 7 of ref (2)). For the sake of discussion, we define the crossover wavelength λpu,x as the pump wavelength at which the probe ground state bleach and excited state absorption signals are balanced (i.e., ∫t>250fs∞S(t) dt = 0). A summary of the approximate crossover pump wavelengths for various melanins, with an 810—815 nm probe, is shown in Table 1. Natural Sepia eumelanin, which has some native iron content, crosses over at λpu,x = 750 nm. Adding iron content by saturating with FeCl3 shifts λpu,x to approximately 715—725 nm, suggesting that the net effect of bound iron is to shift λpu,x to shorter wavelengths. If that is the case, we expect that removing the iron with EDTA would shift λpu,x to >750 nm. This is consistent with our observations that the response of EDTA-washed eumelanin is dominated by excited state absorption in all our measurements with λpr = 817 nm, λpu ≤ 750 nm (data not shown; our OPO is not tunable beyond 750 nm, preventing us from locating λpu,x).
Table 1. Summary of Pump Wavelength That Balances Excited State Absorption and Ground State Bleach for the 810—815 nm Probe.
| type of melanin | λpu,x, for λpr ≈ 810—815 nm |
|---|---|
| pheomelanin | 712 nm (Figure 2c) |
| iron-loaded Sepia eumelanin (27 494 ppm iron) | ∼715–725 nm (Figure 2b) |
| Sepia eumelanin (180 ppm iron)19 | 750 nm2 |
| EDTA-washed Sepia eumelanin (30 ppm iron) | >750 nm (Figure 2a, Discussion) |
Mechanisms of Iron’s Effects on the Near-Infrared Pump–Probe Response of Eumelanin
The observation that bound iron content shifts λpu,x to shorter wavelengths may be explained hypothetically within the framework that considers the broad optical absorption of melanins to be the sum of a large number of heterogeneous chromophores. Though the sum optical absorption spectrum is broad and featureless, each underlying chromophore exhibits peaks whose locations and widths depend on the number and arrangement of its DHI(CA) units (or benzothiazine units in the case of pheomelanin), local chemical environment, stacking structure, and metal ions.26 Only a subset of these chromophores (those having strong optical absorption at λpu) are excited initially in a pump–probe experiment. The time-delayed probe response reflects competition between ground state bleaching and excited state absorption, depending on a number of factors. If excited state absorption were absent, the ground state bleach signal would depend on λpr in the same manner as a transient spectral hole burning measurement:27 the ground state bleach intensifies as λpr approaches λpu, and scanning λpr would reveal the sum absorption spectrum of the subset of chromophores excited by λpu. But excited-state absorption is not absent for λpu and λpr in the near-infrared, and this response replaces ground state bleaching as λpu is tuned away from λpr. Although ground state bleaching is restricted to probe interactions with the pump-selected subpopulation, excited state absorption might involve excited state transitions either within the pump-excited chromophore or from a pump-excited chromophore to a nearby chromophore that has an available energy level in the vicinity of E ∼ hc/λpu + hc/λpr. In that case, given the high degree of heterogeneity within melanins, it is likely that any near-IR λpu, λpr combination will access an excited state absorption. Thus we expect excited state absorption to dominate the response for λpr outside the spectral hole burned by the pump, and to be overwhelmed by an increasingly dominant ground state bleach as we tune λpr toward λpu, consistent with our primary findings here in Figure 2 and in Figure 7 of ref (2).
This hypothesis for ground state bleach/excited state absorption competition in melanins is illustrated by the four scenarios sketched in Figure 12, showing combinations of chromophores having narrow and broad absorption spectra with pump/probe wavelengths having small and large detuning Δλpp = |λpu – λpr|. In Figure 12a, the probe is within the narrow spectral hole burned by the pump, and the response is dominated by ground state bleaching. Figure 12b shows that as the probe is tuned outside the spectral hole, ground state bleaching is weak, and excited state absorption to a neighboring chromophore occurs. Figure 12c,d show the same pump and probe wavelengths, but with chromophores that have broader absorption bands. In this case, the larger Δλpp still results in ground state bleaching, with no crossover to excited state absorption. This implies that the spectral widths of the pump-excited chromophores determine the crossover wavelength λpu,x we reported here.
Figure 12.
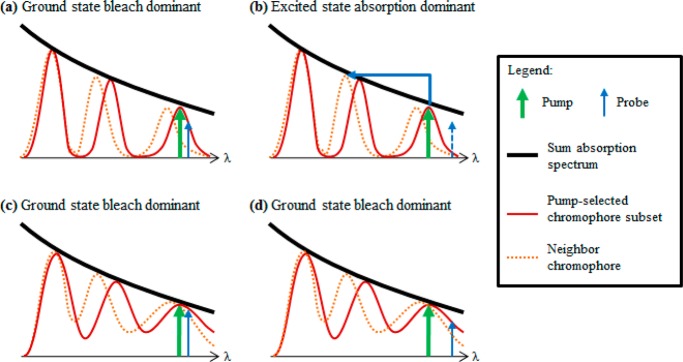
Schematic diagram showing the proposed explanation of the connection between λpu,x and the individual oligomer absorption spectrum. The black curve represents the broad melanin absorption spectrum composed of the sum of individual oligomer absorption spectra. The red peaks represent the absorption spectrum of an individual oligomer unit. The blue arrow represents the pump pulse. The green arrow represents the probe pulse. The dotted orange lines represent the absorption spectra of a neighboring chromophore.
Under this framework, the pump–probe data can be interpreted in a manner that is consistent with the idea that melanin’s broad, featureless absorption spectrum is the result of the sum of many individual chromophores. Smaller chromophores, with fewer DHI(CA) subunits, account for the strong UV–vis absorption, whereas larger chromophores, with extensive electron delocalization and red-shifted, broadened absorption bands, account for the near-IR absorption tail.26 This implies that longer-wavelength λpu will access broader-absorbing chromophores, and the probe response will be increasingly dominated by ground state bleaching. Indeed, pump–probe measurements with λpu ∼ 700—750 nm and Δλpp < 100 nm exhibit a mixture of excited state absorption and ground state bleaching (Figure 2 here and Figure 7 of ref (2)), whereas measurements with longer-wavelength λpu ∼ 800—815 nm and comparable Δλpp are dominated by ground state bleaching (Figure 3 here, and Figures 2, 4, and 8 of ref (2)).
This framework also allows us to infer the cause of iron effect on the pump–probe response of eumelanin. The observed blue shift in λpu,x that occurs with increasing iron content (Figure 2 and Table 1) corresponds with a broadening of available Δλpp over which ground state bleaching is dominant, indicating that iron serves to broaden the absorption spectra of the underlying eumelanin chromophores—just as predicted by density functional theory calculations on proposed eumelanin protomolecules.26
Likewise, either degrading the melanin oligomers that contain iron or damaging the iron–melanin bond itself would narrow the chromophore absorption bands. This damage may occur via chemical oxidation or photodegradation. Chemical oxidation could damage iron-containing melanin through the Fenton cycle: Iron present in melanin catalyzes the production of free radicals in the presence of hydrogen peroxide.28 Because these free radicals would form first near the iron-containing melanin chromophores and subsequently degrade these particles, the pump–probe response would become more dominated by the iron-free chromophores as oxidation progresses, as we observed in Figure 10. Figure 6 also shows the general pattern we have observed for the pattern of damage for iron-loaded eumelanin: first, the pump–probe response changes, then the granule pump–probe photobleaches and undergoes morphological changes, and finally (in some cases) the granule begins to fluoresce. This is in agreement with previously reported melanin fluorescence activation, which also follows morphological changes to the melanin.10,20 Iron-catalyzed oxidative degradation may cause these morphological changes, which happen first to melanins containing the highest concentration of iron. High optical intensity, on the other hand, may damage the iron–melanin bond itself. Photodamage reduces melanin’s ability to bind iron.29 High optical intensity may cause the melanin to release iron, which would cause a pump–probe response dominated by iron-free melanin, as we observed in Figures 6 and 7.
The power threshold of 1 mW average power reported here and by Kerimo et al.10 suggest that in applications where higher average power is used, the melanin may be altered or damaged. Multiphoton and fluorescence lifetime microscopy of the epidermis applies between 20 and 45 mW of average power to the skin,30 and although the exact power delivered depends on the imaging depth, this power level could easily damage epidermal melanins.
In addition to the effects iron has on the pump–probe response, iron quenches melanin fluorescence by forcing fluorescence to compete with additional nonradiative relaxation pathways. These additional pathways manifest themselves by broadening the absorption spectrum, as previously discussed. For example, the pump–probe experimental wavelengths fall within the iron–melanin ligand-to-metal charge transfer (LMCT) band, which is between 700 and 800 nm, which relaxes via a nonradiative mechanism.17
Degradation of iron-containing melanin particles and/or the iron–melanin bond is a possible mechanism to explain the previously reported observations that oxidative damage21,22 and high optical intensity10 cause melanin fluorescence enhancement. Chemical oxidation, before it completely breaks down all the melanin units capable of absorbing NIR, will first break down iron-containing melanin, leaving intact only iron-free melanin, which fluoresces more readily because they have fewer nonradiative relaxation pathways. The explanation that high optical intensity causes the release of redox-active iron ions is particularly compelling because Lai et al. attempted to prevent oxidative photobleaching by performing experiments under nitrogen gas. Despite this attempt to prevent oxidation, the black hair melanin continued to photobleach,20 most likely because black hairs contain iron,31 which would catalyze melanin oxidation.
Chemical oxidation may also enhance melanin fluorescence via breaking large melanin aggregates into smaller aggregates.32 The strong fluorescence of small aggregates25 suggests narrow unit spectra; however, ground state bleach dominates the pump–probe response, which instead suggests broad unit spectra. However, in this case, our assumption that melanins always have a possible excited state absorption and a possible ground state bleach is no longer valid; this assumption was based on the idea that eumelanins are heterogeneous mixtures of oligomers and that absorbed energy could always be passed to a nearby oligomer that will allow an excited state absorption. Selecting only the smallest melanin aggregates from the bulk mixture reduces number of possible melanin aggregate configurations, making the unit absorption spectra much more similar to each other. Making the melanins more homogeneous decreases the chances of an excited state absorption at any possible wavelength combination.
Conditions for Differentiating Melanins
There are two possibilities for differentiating the three melanins studied here. Obvious lifetime differences between the iron-loaded and EDTA-washed eumelanins at shorter wavelengths could discriminate them; however, relying on lifetime differences requires much higher SNR pump–probe response curves than simply using signals with opposite signs. Additionally, calculating exact lifetimes requires very careful control of power levels. Competing processes contribute to the pump–probe response different amounts based on the exact power delivered. When these processes have different signs, such as those contributing to the melanin pump–probe response curves, the power effectively modifies the lifetime that is observed. Referring back to Figure 5, the increasing dominance of the excited state absorption in the cases of pheomelanin and iron-loaded eumelanin shortens the apparent lifetime of the ground state bleach. If one were to calculate a lifetime for the ground state bleach based on observations at a single power level, the result would be a function of the relative contributions of the two processes and their respective lifetimes.
A better option is combining information from two different pump wavelengths, such as 705 and 720 nm. Under these conditions, a pixel that has a negative instantaneous signal at both wavelengths is pheomelanin, a pixel that has an excited state absorption at both wavelengths is EDTA-washed eumelanin, and a pixel that has a negative signal at 720 nm but an excited state absorption at 705 nm is iron-loaded eumelanin. Making the two pump wavelengths closer, such as at 710 and 715 nm, makes the experiment easier to achieve in practice, but it is a poor choice because at these wavelengths, the signal becomes very weak in the case of iron-loaded eumelanin as the ground state bleach and excited state absorption nearly cancel one another.
For differentiating melanins with the two wavelength combinations, power levels must be kept sufficiently low to prevent an excited state absorption from growing into the iron-loaded eumelanin and pheomelanin pump–probe response, as shown in Figure 5. Because melanins have such broad absorption spectra, the near-infrared pump–probe experiments might access energy levels comparable to ground-state transitions in the blue/ultraviolet spectral region if two photons are absorbed simultaneously from the pump or the probe. Such contributions to the response are nonlinear in either the pump or the probe, and might be the origin of the excited state absorption observed in iron-loaded eumelanin and pheomelanin that grows in with increasing optical intensity. In imaging experiments, high power levels incident on iron-loaded eumelanin or pheomelanin could incorrectly suggest the presence of eumelanin lacking metals. Additionally, increasing the power past saturation will cause unnecessary damage to the samples without improving the SNR. However, the differences in the power dependencies may be leveraged for discriminating melanins when the laser setup requires that the wavelength is fixed.
Conclusion
In this report, we have shown that at sufficiently low power, iron-loaded eumelanin, EDTA-washed eumelanin, and synthetic pheomelanin can be differentiated by imaging at two pump–probe combinations: 705 and 720 nm pump with 815 nm probe. This is possible because the dominant response of the iron-loaded eumelanin switches sign around 715 nm, whereas for native iron concentrations in Sepia eumelanin, the sign switch occurs at 750 nm and pheomelanin has a switch at 700 nm.2
Analysis of the pump and probe intensity dependence shows that at higher powers, excited state absorption components grow in to the pump–probe response. This could make discriminating melanins more difficult, especially in thick specimens and in vivo, where the exact optical power delivered to the focal spot cannot be precisely determined.
The differences in the pump–probe responses between these melanins cannot be attributed to stimulated Raman scattering. Rather, the wavelength at which the melanins switch from a ground state bleaching signal to an excited state absorption signal depends on the broadness of the absorption bands of the individual chromophores being excited. Pump–probe response curves suggest that chemical oxidation and photodamage both narrow the absorption bands of iron-loaded eumelanin, possibly by damaging the iron–melanin bond. Fluorescence data support this argument, as fluorescence is enhanced by chemical21 and photo-oxidation,10 as well as by removing metals. Therefore, it is likely that the previously reported “activation” of eumelanin fluorescence comes from the dissociation of redox-active metal ions and rapid degradation of metal-containing melanin, both of which can reduce fluorescence quenching, in addition to the release of free PTCA to produce smaller eumelanin particles.32
Characterizing the λpu,x for melanin in tissue has potential value for understanding how melanin chemistry is altered in different types of skin malignancies. Drawing conclusions about melanin chemistry will be challenging because many factors contribute to the λpu,x. For example, we previously reported that the pump–probe response of eumelanin is different in dermal cells than in epidermal cells.13 The response differences suggest that dermal cells contain less iron, but considering the results contained herein, one cannot eliminate the possibility that the melanin is under oxidative stress or simply forming large melanin aggregates. Distinguishing between the many factors that contribute to changes to the pump–probe signal will require further research, such as establishing λpu,x for EDTA-washed eumelanin and measuring the effects of other metals, particularly redox-active metals such as copper. Additional time-resolved fluorescence measurements may also lead to a better understanding of the effect of metals and degradation on radiative relaxation pathways. We will also extend this work to include pheomelanin with varying metal iron content.
Acknowledgments
We gratefully acknowledge our funding sources, NIH grant R01-CA166555 (W.S.W.) and NIH fellowship no. 1F32CA168497-01A1 (J.W.W.). Power studies on hair (Figures 7 and 8) were performed at the Duke Center for In Vivo Microscopy, an NIH/NIBIB national Biomedical Technology Resource Center (P41 EB015897). We thank Dr. Sanghamitra Deb for assistance in collecting melanin spectroscopy data (Figure 2), Dr. Gary Dwyer for his assistance in collecting the ICP-MS data, and Dr. Martin C. Fischer for useful discussions about interpreting the results.
The authors declare no competing financial interest.
Funding Statement
National Institutes of Health, United States
References
- Fu D.; Ye T.; Matthews T. E.; Yurtsever G.; Warren W. S. Two-Color, Two-Photon, and Excited-State Absorption Microscopy. J. Biomed. Opt. 2007, 12, 054004. [DOI] [PubMed] [Google Scholar]
- Piletic I. R.; Matthews T. E.; Warren W. S. Probing Near-Infrared Photorelaxation Pathways in Eumelanins and Pheomelanins. J. Phys. Chem. A 2010, 114, 11483–11491. [DOI] [PMC free article] [PubMed] [Google Scholar]
- Matthews T. E.; Wilson J. W.; Degan S.; Simpson M. J.; Jin J. Y.; Zhang J. Y.; Warren W. S. In Vivo and Ex Vivo Epi-Mode Pump-Probe Imaging of Melanin and Microvasculature. Biomed. Opt. Express 2011, 2, 1576–1583. [DOI] [PMC free article] [PubMed] [Google Scholar]
- Matthews T. E.; Piletic I. R.; Selim M. A.; Simpson M. J.; Warren W. S. Pump-Probe Imaging Differentiates Melanoma from Melanocytic Nevi. Sci. Transl. Med. 2011, 3, 71ra15. [DOI] [PMC free article] [PubMed] [Google Scholar]
- Simpson M. J.; Glass K. E.; Wilson J. W.; Wilby P. R.; Simon J. D.; Warren W. S. Pump-Probe Microscopic Imaging of Jurassic-Aged Eumelanin. J. Phys. Chem. Lett. 2013, 4, 1924–1927. [DOI] [PMC free article] [PubMed] [Google Scholar]
- Shoo B. A.; Sagebiel R. W.; Kashani-Sabet M. Discordance in the Histopathologic Diagnosis of Melanoma at a Melanoma Referral Center. J. Am. Acad. Dermatol. 2010, 62, 751–756. [DOI] [PubMed] [Google Scholar]
- Baldi A.; Lombardi D.; Russo P.; Palescandolo E.; De Luca A.; Santini D.; Baldi F.; Rossiello L.; Dell’Anna M. L.; Mastrofrancesco A.; et al. Ferritin Contributes to Melanoma Progression by Modulating Cell Growth and Sensitivity to Oxidative Stress. Clin. Cancer Res. 2005, 11, 3175–3183. [DOI] [PubMed] [Google Scholar]
- Sander C. S.; Hamm F.; Elsner P.; Thiele J. J. Oxidative Stress in Malignant Melanoma and Non-Melanoma Skin Cancer. Br. J. Dermatol. 2003, 148, 913–922. [DOI] [PubMed] [Google Scholar]
- Nofsinger J. B.; Forest S. E.; Simon J. D. Explanation for the Disparity among Absorption and Action Spectra of Eumelanin. J. Phys. Chem. B 1999, 103, 11428–11432. [Google Scholar]
- Kerimo J.; Rajadhyaksha M.; DiMarzio C. A. Enhanced Melanin Fluorescence by Stepwise Three-photon Excitation. Photochem. Photobiol. 2011, 87, 1042–1049. [DOI] [PubMed] [Google Scholar]
- Ito S. Optimization of Conditions for Preparing Synthetic Pheomelanin. Pig. Cell Res. 1989, 2, 53–56. [DOI] [PubMed] [Google Scholar]
- Liu Y.; Hong L.; Kempf V. R.; Wakamatsu K.; Ito S.; Simon J. D. Ion-Exchange and Adsorption of Fe(III) by Sepia Melanin. Pig. Cell Res. 2004, 17, 262–269. [DOI] [PubMed] [Google Scholar]
- Simpson M. J.; Wilson J. W.; Phipps M. A.; Robles F. E.; Selim M. A.; Warren W. S. Nonlinear Microscopy of Eumelanin and Pheomelanin with Subcellular Resolution. J. Invest. Dermatol. 2013, 133, 1822–1826. [DOI] [PMC free article] [PubMed] [Google Scholar]
- Freudiger C. W.; Min W.; Saar B. G.; Lu S.; Holtom G. R.; He C.; Tsai J. C.; Kang J. X.; Xie X. S. Label-Free Biomedical Imaging with High Sensitivity by Stimulated Raman Scattering Microscopy. Science 2008, 322, 1857–1861. [DOI] [PMC free article] [PubMed] [Google Scholar]
- Berera R.; Grondelle R.; Kennis J. T. M. Ultrafast Transient Absorption Spectroscopy: Principles and Application to Photosynthetic Systems. Photosynth. Res. 2009, 101, 105–118. [DOI] [PMC free article] [PubMed] [Google Scholar]
- Savitzky A.; Golay M. J. E. Smoothing and Differentiation of Data by Simplified Least Squares Procedures. Anal. Chem. 1964, 36, 1627–1639. [Google Scholar]
- Samokhvalov A.; Liu Y.; Simon J. D. Characterization of the Fe(III)-Binding Site in Sepia Eumelanin by Resonance Raman Confocal Microspectroscopy. Photochem. Photobiol 2004, 80, 84–88. [DOI] [PubMed] [Google Scholar]
- Robles F. E.; Wilson J. W.; Fischer M. C.; Warren W. S. Phasor Analysis for Nonlinear Pump-Probe Microscopy. Opt. Express 2012, 20, 17082–17092. [Google Scholar]
- Liu Y.; Simon J. D. Metal–Ion Interactions and the Structural Organization of Sepia Eumelanin. Pig. Cell Res. 2004, 18, 42–48. [DOI] [PubMed] [Google Scholar]
- Lai Z.; Kerimo J.; Mega Y.; DiMarzio C. A. Stepwise Multiphoton Activation Fluorescence Reveals a New Method of Melanin Detection. J. Biomed., Opt. 2013, 18, 061225. [DOI] [PubMed] [Google Scholar]
- Kozikowski S. D.; Wolfram L. J.; Alfano R. R. Fluorescence Spectroscopy of Eumelanins. IEEE J. Quantum Electron. 1984, 20, 1379–1382. [Google Scholar]
- Kayatz P.; Thumann G.; Luther T. T.; Jordan J. F.; Bartz–Schmidt K. U.; Esser P. J.; Schraermeyer U. Oxidation Causes Melanin Fluorescence. Invest. Ophthalmol. Vis. 2001, 42, 241–246. [PubMed] [Google Scholar]
- Liu Y.; Simon J. D. The Effect of Preparation Procedures on the Morphology of Melanin from the Ink Sac of Sepia Officinalis. Pig. Cell Res. 2003, 16, 72–80. [DOI] [PubMed] [Google Scholar]
- Forest S. E.; Lam W. C.; Millar D. P.; Nofsinger J. B.; Simon J. D. A Model for the Activated Energy Transfer within Eumelanin Aggregates. J. Phys. Chem. B 2000, 104, 811–814. [Google Scholar]
- Nofsinger J. B.; Simon J. D. Radiative Relaxation of Sepia Eumelanin is Affected by Aggregation. Photochem. Photobiol. 2001, 74, 31–37. [DOI] [PubMed] [Google Scholar]
- Meng S.; Kaxiras E. Theoretical Models of Eumelanin Protomolecules and their Optical Properties. Biophys. J. 2008, 94, 2095–2105. [DOI] [PMC free article] [PubMed] [Google Scholar]
- Jankowiak R.; Hayes J. M.; Small G. J. Spectral hole-burning spectroscopy in amorphous molecular solids and proteins. Chem. Rev. 1993, 93, 1471–1502. [Google Scholar]
- Pilas B.; Sarna T.; Kalyanaraman B.; Swartz H. M. The Effect of Melanin on Iron Associated Decomposition of Hydrogen Peroxide. Free Radical Biol. Med. 1988, 4, 285–293. [DOI] [PubMed] [Google Scholar]
- Zareba M.; Szewczyk G.; Sarna T.; Hong L.; Simon J. D.; Henry M. M.; Burke J. M. Effects of Photodegradation on the Physical and Antioxidant Properties of Melanosomes Isolated from Retinal Pigment Epithelium. Photochem. Photobiol. 2007, 82, 1024–1029. [DOI] [PubMed] [Google Scholar]
- Benati E.; Bellini V.; Borsari S.; Dunsby C.; Ferrari C.; French P.; Guanti M.; Guardoli M.; Koenig K.; Pellacani G.; Ponti G.; Schianchi S.; Talbot C.; Seidenari S. Quantitative Evaluation of Healthy Epidermis by Means of Multiphoton Microscopy and Fluorescence Lifetime Imaging Microscopy. Skin Res. Technol. 2011, 17, 295–303. [DOI] [PubMed] [Google Scholar]
- Liu Y.; Kempf V. R.; Nofsinger J. B.; Weinert E. E.; Rudnicki M.; Wakamatsu K.; Ito S.; Simon J. D. Comparison of the Structural and Physical Properties of Human Hair Eumelanin Following Enzymatic or Acid/Base Extraction. Pig. Cell Res. 2003, 16, 355–365. [DOI] [PubMed] [Google Scholar]
- Wakamatsu K.; Nakanishi Y.; Miyazaki N.; Kolbe L.; Ito S. UVA-Induced Oxidative Degradation of Melanins: Fission of Indole Moiety in Eumelanin and Conversion to Benzothiazole Moiety in Pheomelanin. Pig. Cell Res. 2012, 25, 434–445. [DOI] [PubMed] [Google Scholar]


