Abstract
Glyceollin-related metabolites produced in rats following oral glyceollin administration were screened in plasma, feces, and urine, and these metabolites were identified by precursor and product ion scanning using liquid chromatography coupled online with electrospray ionization tandem mass spectrometry (LC-ESI-MS/MS). Precursor ion scanning in the negative ion (NI) mode was used to identify all glyceollin metabolites based on production of a diagnostic radical product ion (m/z 148) upon decomposition. Using this approach, precursor peaks of interest were found at m/z 474 and 531. Tandem mass spectra of these two peaks allowed us to characterize them as byproducts of glutathione conjugation. The peak at m/z 474 was identified as the deprotonated cysteinyl conjugate of glyceollins with an addition of an oxygen atom, whereas m/z 531 was identified as the deprotonated cysteinylglyceine glyceollin conjugate plus an oxygen. These results were confirmed by positive ion (PI) mode analyses. Mercapturic acid conjugates of glyceollins were also identified in NI mode. In addition, glucuronidation of glyceollins was observed, giving a peak at m/z 513 corresponding to the deprotonated conjugate. Production of glucuronic acid conjugates of glyceollins was confirmed in vitro in rat liver microsomes. Neither glutathione conjugation byproducts nor glucuronic acid conjugates of glyceollins have been previously reported.
Keywords: phase I metabolism, phase II metabolism, phytoestrogens, phytochemicals, phytoalexins, reactive oxygen species
Introduction
Cancer is the second leading cause of death in the United States after heart disease,1 yet a cure for this disease remains elusive. Soybean isoflavones have been shown to exhibit anticancer and antiproliferative activity toward cancerous cells.2,3 Much of the health-related research concerning soy-derived products has been conducted on daidzein and genistein.4,5 Among the more recently studied soy-derived phytoestrogens are the glyceollins that are produced under stressed conditions (e.g., UV light exposure or infection by Aspergillus).6,7 Glyceollins, like the soy isoflavones, are nonsteroid compounds; however, they possess a diphenolic substructure that exhibits similarities with estrogens.8 Several propositions have been offered to explain the antitumoral activity of soy phytoestrogens; these include both estrogenic and nonestrogenic mechanisms.9,10
Recent investigations have proposed glyceollins as prevention or therapy candidates for breast, ovarian, and prostate cancers.11,12 Glyceollins exhibit antiestrogenic effects on estrogen receptor function and estrogen-dependent tumor growth.13,14 Breast cancer (MCF-7) and ovarian cancer (BG-1) cell proliferations, which are induced by estrogens, were found to be inhibited by glyceollins.12 Furthermore, studies conducted on postmenopausal monkeys and a human prostate cancer cell line (LNCaP) also showed a reduction in biomarkers associated with breast cancer progression by glyceollins.15 The potential anticancer benefits of glyceollins have been well documented, but its metabolism is not well understood,16 other than the evidence for sulfation.17
Ingested therapeutic agents are commonly eliminated from the body through phase I and II metabolism.18 Oxidation, reduction, and hydrolysis of a drug are typical phase I pathways.19,20 Phase II reactions are conjugative, often following phase I oxidation, but they can also occur directly. Common pathways include acetylation, methylation, sulfation, glucuronidation, and glutathione conjugation.21−23 Direct sulfation and glucuronidation of phytochemicals by intestinal enzymes is considered a significant cause of their poor bioavailability.24,25 For example, during the metabolism of genistein, extensive sulfation and glucuronidation occur in the intestine, thus limiting the bioavailability of this isoflavone upon oral ingestion.26,27 However, a recent study suggests that metabolism of certain phytochemicals may actually lead to the beneficial effects of these agents.28 Specifically, regeneration of resveratrol within cells following uptake of its systemically available sulfate conjugate was suggested to be an important source of the antiproliferative effects of this phytochemical. With respect to glyceollin, a recent study conducted in rats reported absorption of glyceollins across the gastro-intestinal tract following oral administration of a single 90 mg/kg dose of a mixture of glyceollin isomers I–III.30 In that study, the average maximum plasma concentration of the three isomers combined was only 160 ng/mL; thus, it seemed plausible that glyceollin may behave similarly to other phytochemicals in being extensively metabolized. Initial characterization of plasma samples taken from the same rats that received the 90 mg/kg dose revealed sulfated metabolites.17 The purpose of the current work is to extend this initial metabolite profiling through broader characterization of glyceollin metabolites in these same plasma samples and to expand our analyses to urine and feces samples obtained from separate groups of rats that received either a single 90 mg/kg oral dose (urine) or two weeks of daily 90 mg/kg oral doses (feces) of the same glyceollin I–III isomeric mixture used in the initial study.29
Materials and Methods
Chemicals
High purity grade trifluoroacetic acid (TFA, >99%) and formic acid (>96%) were obtained from Sigma-Aldrich Chemical Co. (St. Louis, MO) as was HPLC-methanol solvent. OmniSolv LC-MS acetonitrile was purchased from EMD Millipore (Billerica, MA). A Millipore water purifying system (18.2 MΩ·cm) was used to obtain deionized water.
Extraction of Glyceollin Isomers
Using a procedure developed at the Southern Regional Research Center (SRRC, ARS, USDA, New Orleans, LA), a mixture of glyceollins I, II, and III was obtained.6 Briefly, after slicing, soybean seeds were inoculated with Aspergillus sojae. The A. sojae (SRRC 1125) culture was grown at 25 °C in the dark on potato dextrose agar. Conidia were harvested from 5-day-old cultures of A. sojae. Conidia were suspended in 15 mL sterile, distilled H2O (1.0–3.0 × 10⁷ conidia mL–1) and mixed with sliced soybean seeds (1 kg). Three days after exposure to Conidia, the glyceollins were extracted from the inoculated seeds with 1 L of methanol. Notably, the process to induce glyceollins in soybean is not a traditional fermentation (soybean seeds are not heated). Typically, there are no glyceollins present in soybean unless the plant or seed was subjected to stress. Under conditions of stress, the soybean seed triggers the production of critical enzymes (phenylalanine ammonia-lyase, PAL) necessary for producing glyceollins. The glyceollins were isolated using preparative scale HPLC employing two Waters (Milford, MA) 25 × 100 mm, 10 μm particle size μBondapak C18 radial compression column segments; the column segments were connected in series using an extension tube. HPLC was performed on a Waters 600E liquid chromatograph equipped with a Waters UV–vis 996 detector scanning from 210 to 400 nm. The injection volume was 20 mL; the flow rate was 8.0 mL/min using the following solvent gradient: A = acetonitrile (Sigma-Aldrich), B = water (Millipore system, Billerica, MA) 5% A for 10 min, then 5% A to 90% A in 60 min followed by holding at 90% A for 20 min. The fraction containing the glyceollins was concentrated (≥98% purity) under vacuum and freeze-dried. Confirmation of individual glyceollins was based on HPLC retention times and UV–vis absorbance spectra comparison with those of authentic standards isolated at SRRC. UV–vis spectrophotometry at 285 nm was used to estimate the percentage of the three isomers used in all experiments: glyceollin I (68%), glyceollin II (21%), and glyceollin III (11%).
Glyceollin Dosing of Rats and Plasma Sample Collection
The procedures used for administration of glyceollins to rats and subsequent sample collection have been previously described.30 Briefly, the mixture of glyceollin isomers I–III defined in the preceding section was dissolved in poloxamer and administered (90 mg/kg) via oral gavage (3 mL) to male ZDSD (Zucker Diabetic Sprague–Dawley) rats (PreClinOmics, Indianapolis, IN) that were subjected to a 12:12 h light/dark cycle. These rats are an obese prediabetic rat model of Type II diabetes.30 This dose was selected because it was identical to that used in an oral-glucose-tolerance test to evaluate the antidiabetic potential of glyceollins.29 Rats (approximately 500 g wt) were euthanized at various time points by decapitation; trunk blood was subsequently collected into EDTA-coated tubes supplemented with aprotinin. Plasma samples obtained 3 h after dosage were separated and stored at −80 °C. Upon thawing, 125 μL of plasma was transferred into microcentrifuge tubes to which an equivalent volume of acetonitrile was added. The mixture was vortexed, then centrifuged at 10 000 rpm for 20 min. The supernatant was subjected to mass spectrometric analysis.
Urine Sample Treatment
A urine sample obtained from a 24 h collection period that commenced following a single 90 mg/kg oral dose to a rat was acidified with 1% TFA, vortexed, and centrifuged at 10 000 rpm for 10 min. The supernatant was diluted with 1:1 0.2% formic acid in 10% acetonitrile31 and stored at −80 °C until the subsequent LC-MS analyses.
Fecal Sample Collection
Rat fecal samples were collected prior to and after the dosage of the mixture of glyceollin isomers I–III (90 mg/kg) once daily for 2 weeks. This study was conducted to assess possible effects of glyceollin administration on the gastrointestinal microbiome, thus necessitating multiple dose administration. Both the pre- and postdosed fecal pellets were weighed, and a 1:2 (pellet weight/vol) ratio of deionized water was added to each group. A smooth paste was created in a glass mortar and pestle. The paste was then transferred to a polypropylene tube and diluted with CH3CN 1:2 (paste wt/vol). The tubes were centrifuged for 5 min at 1000 rpm. Supernatant was collected and transferred to fresh tubes; then, approximately 0.1 g of ammonium acetate was added progressively with gentle vortexing. Tubes were subsequently centrifuged for 5 min at 1000 rpm. The supernatant (acetonitrile layer) was collected and stored at −70 °C until analysis.
Liver Microsomes Treatment with NADPH or UDPGA Cofactors
Samples were prepared in triplicate for both the control and the experimental group. For the NADPH incubations (phase I oxidation), 168 μL of 100 mM NaH2PO4 buffer (pH 7.4), 10 μL of 20 mg/mL rat liver microsomes, 10 μL of 20 mM MgCl2, and 1 mM glyceollins I–III isomeric mixture were added to 1.5 mL Eppendorf tubes, vortexed, and incubated for 3 min at 37 °C. Subsequently, 10 μL of either 10 mM NADPH or buffer (control) was added, and the samples were incubated for 30 min at 37 °C. The incubation was stopped by adding 200 μL of cold acetonitrile, followed by vortexing, and centrifugation for 5 min at 4000 rpm. Supernatant was transferred to fresh tubes and stored at −70 °C until analysis. For the UDPGA conjugation procedure, 134 μL of 100 mM KH2PO4 buffer (pH 7.1), 20 μL of 20 mg/mL rat liver microsomes, and 4 μL of 5 mg/mL alamethicin were added to 1.5 mL Eppendorf tubes, vortexed, and incubated on ice for 15 min. Twenty microliters of MgCl2 and 2 μL of 1 mM glyceollins I–III isomeric mixture were then added, vortexed, and incubated for 3 min. Twenty microliters of KH2PO4 buffer and 20 μL of 10 mM UDPGA were added to control and experimental groups, respectively. The tubes were incubated for 60 min at 37 °C. Two hundred microliters of cold acetonitrile was added to each tube to terminate the incubation. Tubes were then vortexed followed by centrifugation for 5 min at 4000 rpm. Supernatant was transferred to fresh tubes and stored at −70 °C until analysis.
Liquid Chromatography–Mass Spectrometry
LC-ESI-MS and LC-ESI-MS/MS analyses were conducted on an Agilent 1200 series LC system (Agilent, Santa Clara, CA) coupled to a 3200 QTrap triple quadrupole mass spectrometer (Applied Biosystems/MDS SCIEX, Foster City, CA). Separation was performed on an Agilent Eclipse XDB C18 column (4.6 × 150 mm ID, 5 μm). Ten microliters was injected onto the column held at 25 °C. The binary mobile phase consisted of mobile phase A (water with 0.1% formic acid) and mobile phase B (acetonitrile with 0.1% formic acid). The gradient was 0–44 min 5% B to 45% B; the flow rate was 0.500 mL/min. The UV absorbance detector was set at 285 nm.
For negative ion LC-ESI-MS and LC-ESI-MS/MS analyses, electrospray parameters were set at the following: curtain gas (CUR) of 20 psi, ionspray voltage (IS) of −4500 V, GAS1 of 60 psi, GAS2 of 60 psi, source temperature of 600 °C, CAD gas pressure of 6 psi, entrance potential (EP) of −10 V, and collision cell exit potential (CXP) of −3 V. Declustering potential (DP) and collision energy (CE) were optimized to be −55 V and −34 eV, respectively. For positive ion experiments, CUR, IS, EP, CXP, DP, and CE were maintained at 10 psi, 5000 V, 10 V, 5 V, 40 V, and 30 eV, respectively. All other parameters were the same as for negative ion mode. Full scan and precursor ion scans were performed sequentially (scan rate = 1 s/200 Da). In a subsequent LC injection, product ion scans for precursors of interest were added to the sequential acquisitions.
Results and Discussion
Precursor Ion Scans of m/z 148
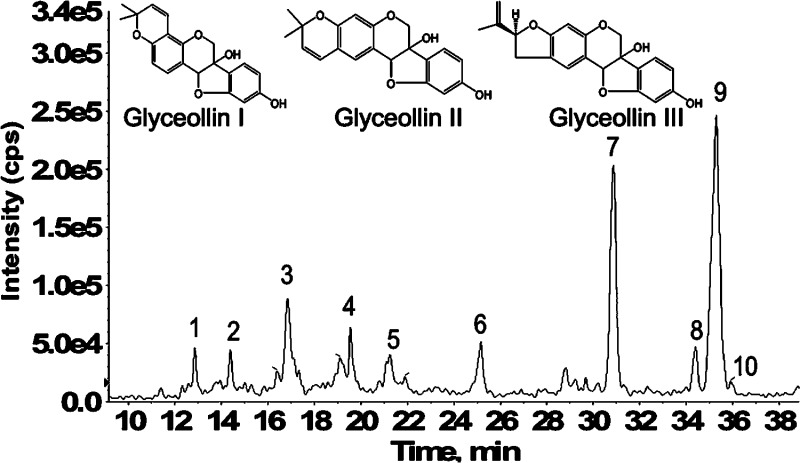
In our previous work, we proposed a precursor ion scan method to screen for isomeric glyceollins and their metabolites based on a diagnostic radical product ion.17,29 Higher-energy triple quadrupole (e.g., 34 eV ELab) CID product ion spectra of glyceollins yield an exceptionally stable radical at m/z 148, which serves as a “signature” common to the three glyceollin isomers.17 Employing this precursor ion scanning approach, plasma, urine, and feces samples obtained from rats dosed with isomeric glyceollins I, II, and III (structures shown in Figure 1) were screened for the glyceollins and their metabolites by LC-ESI-MS and LC-ESI-MS/MS. The precursor ion scanning of m/z 148 for rat feces samples resulted in the appearance of substantially more metabolites compared to rat plasma and urine samples. Figure 1 shows a representative LC chromatogram of a rat feces sample. All three unmetabolized isomers of glyceollins (m/z 337) were detected. Peaks labeled 9, 8, and 10 on the LC chromatogram correspond to glyceollin I, II, and III, respectively.
Figure 1.
LC-ESI-MS/MS precursor ion scans showing total ion current of all precursors of m/z 148 from feces of rats dosed orally once daily for 2 weeks with 90 mg/kg of the glyceollin isomeric mixture. Isomeric structures of glyceollins I, II, and III are shown above the scans (inset).
Little is known about the metabolism of glyceollins, but our findings from rat feces indicate that extensive oxidation of glyceollins occurred. Peaks 5, 1, and 6 (Figure 1) represent m/z 148 precursors at m/z 353, 371, and 387, respectively. Relative to deprotonated glyceollins (m/z 337), these three metabolites are proposed as products of epoxidation or hydroxylation of glyceollins (m/z 353), diol addition at a double bond (m/z 371), and a combination of these two processes (m/387). Two of the three above-mentioned peaks observed in rat feces (m/z 371, 387) were also detected in rat urine, as was m/z 451 (the latter likely represents glyceollins that are both hydrolyzed and sulfated). Notably, m/z 451 had also been detected in rat plasma, along with m/z 353 and 355 (the latter representing a hydrolysis product).17 LC-ESI-MS/MS precursor ion scanning of m/z 148 from rat feces showed additional peaks eluting at 14.4 (peak 2), 16.8 (peak 3), 19.3 (peak 4), 30.9 (peak 7), and 35.3 (peak 9) min. These chromatographic peaks correspond, respectively, to glyceollin metabolite precursors at m/z 531, 474, 433, 417, and the deprotonated glyceollin isomers at m/z 337. These five precursors of m/z 148 were also found in rat plasma, whereas m/z 531, 474, and 417 were observed in rat urine (data not shown). Sulfation and sulfation plus an oxygen of glyceollins account for the peaks observed at m/z 417 (peak 7) and 433 (peak 4), respectively, as discussed previously.17 The two remaining precursor peaks of interest at m/z 474 and 531 were considered as phase II metabolites of glyceollins and were further investigated by tandem mass spectrometry, as discussed in the following section.
Evidence of GSH-Derived Metabolites Obtained by LC-ESI-MS and LC-ESI-MS/MS
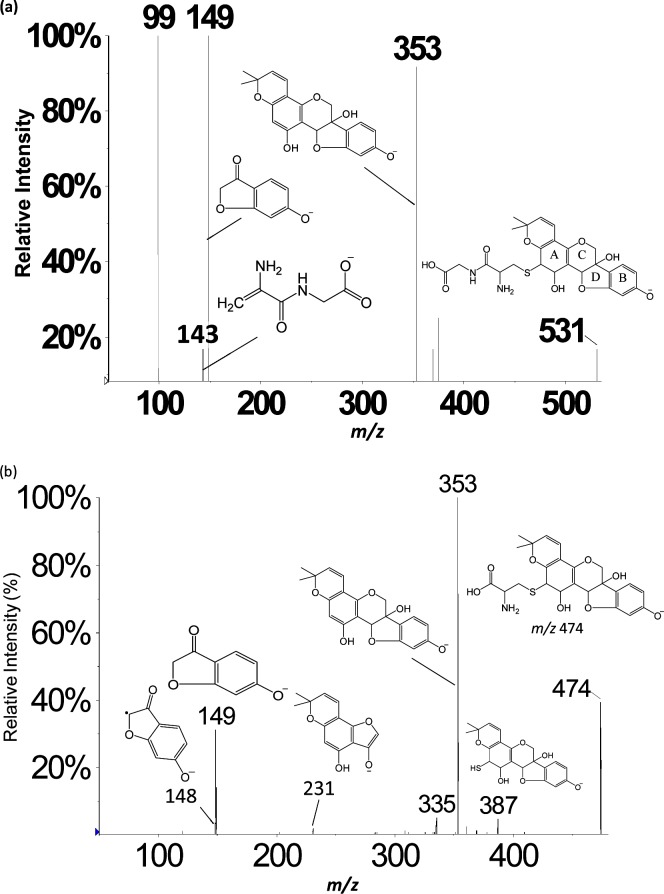
A chromatographic peak corresponding to the m/z 531 precursor from feces samples eluted at 14.4 min (Figure 1, peak 2); an identical peak was observed in rat plasma and urine. The NI mode LC-ESI-MS/MS CID product ion mass spectrum of this m/z 531 precursor (Figure 2a) summed across the entire chromatographic peak showed a fragment at m/z 353, which corresponds to a loss of 178 Da. Appearing in Figure 2b is the NI mode LC-ESI-MS/MS CID product ion mass spectrum of m/z 474 corresponding to the chromatographic peak eluting at 17.0 min (Figure 1, peak 3). Similar to the result shown in Figure 2a, the m/z 474 also yields a fragment at m/z 353, indicating this time, a loss of 121 Da. The combined information extracted from Figure 2a,b allows the deduction that glutathione conjugation has occurred in glyceollins and that subsequent metabolic byproducts are present in the three matrices: rat plasma, urine, and feces.32 GSH is a tripeptide (Glu-Cys-Gly) that, when conjugated to molecules via the thiol function in cysteine, is subsequently metabolized via γ-glutamyltranspeptidase to form cysteinylglycine conjugates. We propose that the loss of 178 Da (Figure 2a) involves loss of intact cysteinylglycine from the m/z 531 precursor that corresponds to a cysteinylglycine conjugate of an oxygenated form of glyceollins. Strongly supporting this proposition is the appearance of a cysteinylglycine fragment ion at m/z 143 (Figure 2a). To complement this information, the 121 Da loss from the m/z 474 precursor (Figure 2b) is proposed to correspond to intact cysteine. The m/z 474 precursor is thus proposed to represent the cysteinyl conjugate of oxygenated glyceollins, which represents the second step in the metabolism of GSH conjugates via peptidase-mediated hydrolysis of the cysteinylglycine conjugate. Further evidence to support this assignment is given by the appearance of m/z 387 that corresponds to decomposition of the cysteine amino acid (Figure 2b).
Figure 2.
LC-ESI-MS/MS negative ion mode product ion mass spectra of (a) m/z 531 precursor and (b) m/z 474 precursor. One site of hydroxylation and one site of peptide addition are proposed; other isomeric structures may exist (see Scheme 1).
The occurrence of GSH conjugation via glutathione S-transferases (GSTs) is often associated with electrophilic compounds or their metabolites.33 With respect to phytochemicals, this pathway is the principal metabolic route in the metabolism of sulforophane,34 which is derived from cruciferous vegetables and contains an isothiocyanate-based electrophile. Importantly, sulforophane possesses potent anticarcinogenic and cytoprotective properties35,36 that are postulated to derive from its ability to induce expression of phase II enzymes, including GSTs.
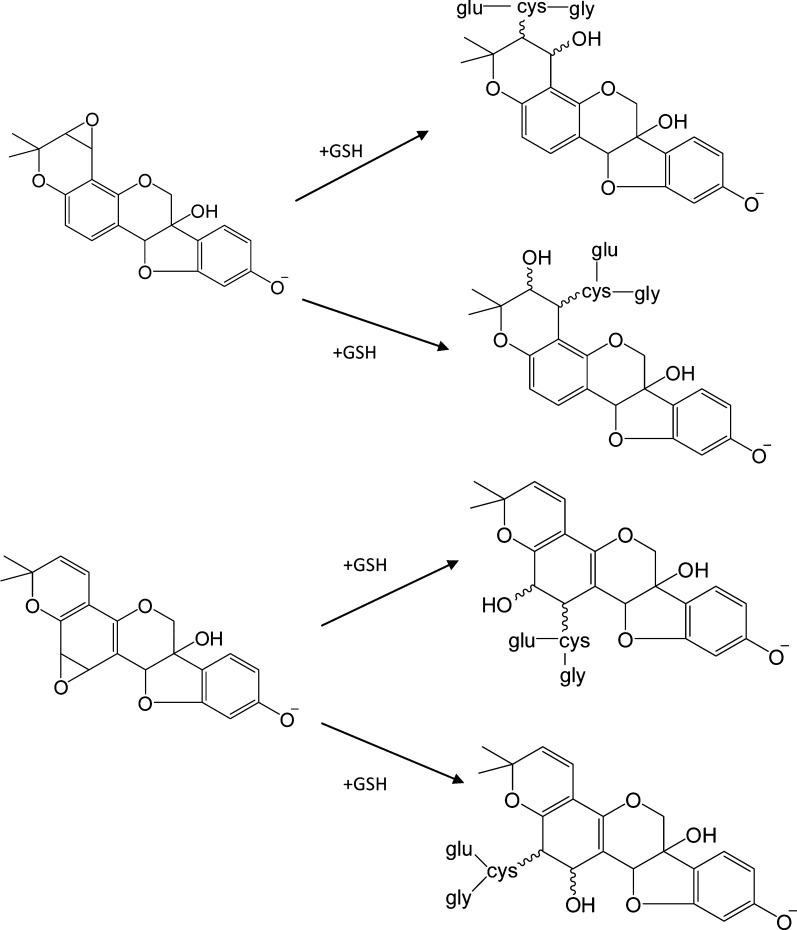
Evidence obtained from the in vivo studies reported herein indicates that phase I-derived glyceollin metabolites detected in rat plasma, urine, and feces have undergone glutathione conjugation. Although NI mode LC-ESI-MS/MS CID product ion mass spectra of m/z 660 and 644 precursors (corresponding to potential oxygenated and nonoxygenated GSH-glyceollins, respectively) were acquired from rat plasma, urine, and feces samples, no intact glutathione conjugates of glyceollins were detected. This can be attributed to the fast kinetics of enzymatic glutamate cleavage37 from the GSH–glyceollin complex that produces the cysteinylglyceine conjugate (m/z 531, Figure 2a). As mentioned above, the cysteinylglyceine conjugate can be subsequently metabolized to the cysteine conjugate. The product ion spectrum of the m/z 474 precursor (Figure 2b) corroborates the presence of cysteinyl conjugates of glyceollins. These proposed metabolites are observed in oxygenated forms (i.e., in addition to the cysteinyl sulfur linkage, an oxygen atom has been added). Complementing this finding, a +16 metabolite was also observed via precursor ion scanning following coincubation of 10 μM of the glyceollin isomeric mixture with NADPH in rat liver microsomes (data not shown). We propose that the addition of oxygen precedes the addition of GSH; initial formation of an epoxide would be consistent with this proposition. Enzymatic formation of epoxides followed by glutathione conjugation has been previously documented.38,39 Epoxide formation at a double bond represents a reactive intermediate that is highly susceptible to GSH complex formation.
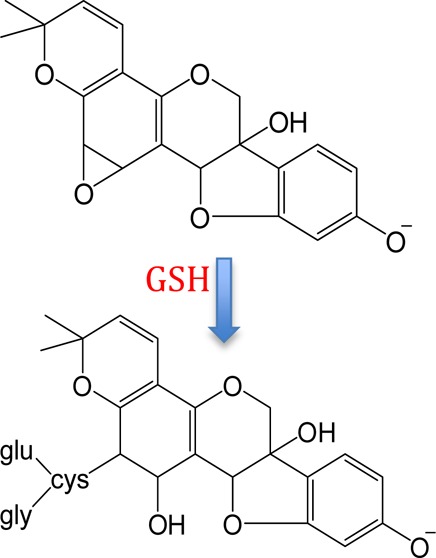
The CID product ion mass spectra of m/z 531 (Figure 2a) and 474 (Figure 2b) precursors each yield a fragment at m/z 353 corresponding to the loss of cysteinylglycine or cysteine, respectively, with abstraction of a neighboring hydrogen and double bond (or epoxide) formation on the glyceollins in each case. In addition, Figure 2a,b each shows the presence of m/z 149 (i.e., the B fragment ion formed from decomposition of the glyceollin backbone).17 In our previous study, the CID product ion spectrum of the sulfated metabolite of glyceollins with an additional oxygen (m/z 433) showed B fragments (m/z 148 and 149) which were the same as those found for unmetabolized deprotonated glyceollins; however, A fragments (m/z 191 and 243) were shifted higher by 16 m/z units. These combined observations allowed the localization of oxygen attachment on glyceollins.17 For the GSH enzymatic products, the appearance of the m/z 149 fragment suggests that the oxygen and cysteinylglyceine dipeptide or cysteine are not located on the B fragments. More importantly, the A fragment expected at m/z 21517,40 has been shifted to m/z 231 (Figure 2b), thus indicating that oxygen addition had occurred on the A fragment. On the basis of our evidence for initial epoxidation followed by GSH attachment, combined with the CID data presented above, we conclude that there are four possible attachment sites for the initial oxygenated glutathione conjugates of glyceollins (Scheme 1); the oxygenated cysteinylglyceine and oxygenated cysteinyl–glyceollin conjugates would maintain these same sites of conjugation.
Scheme 1. Glutathione Conjugation to the Two Most Favorable Epoxide Forms of Glyceollin I.
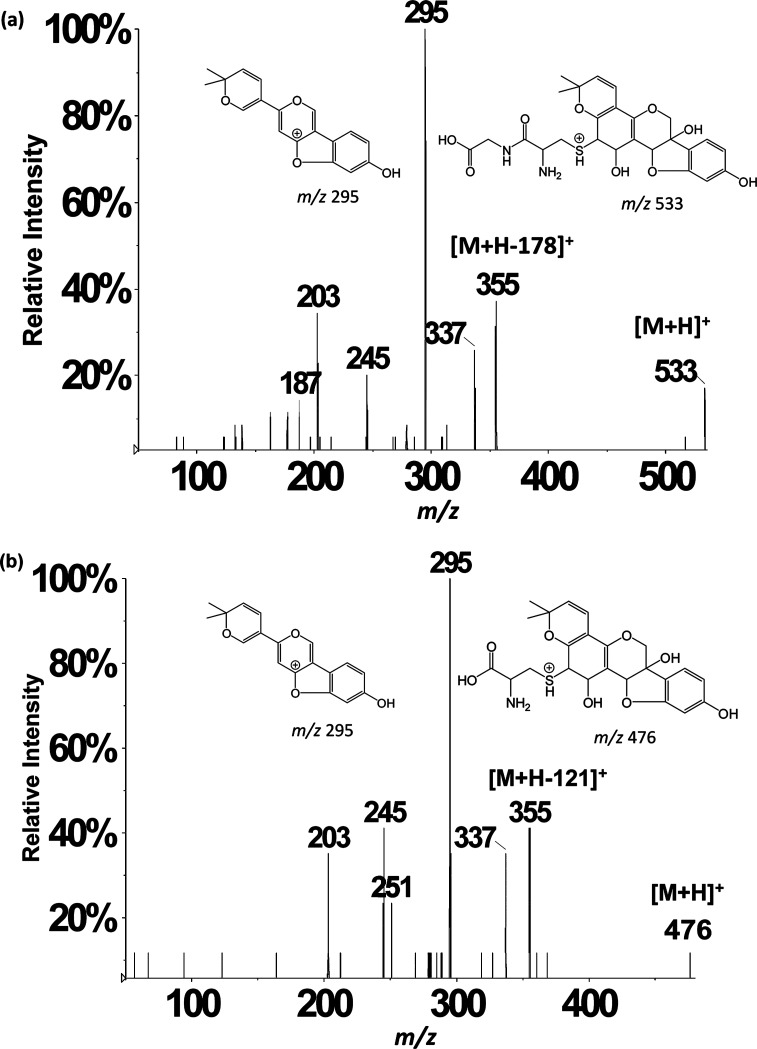
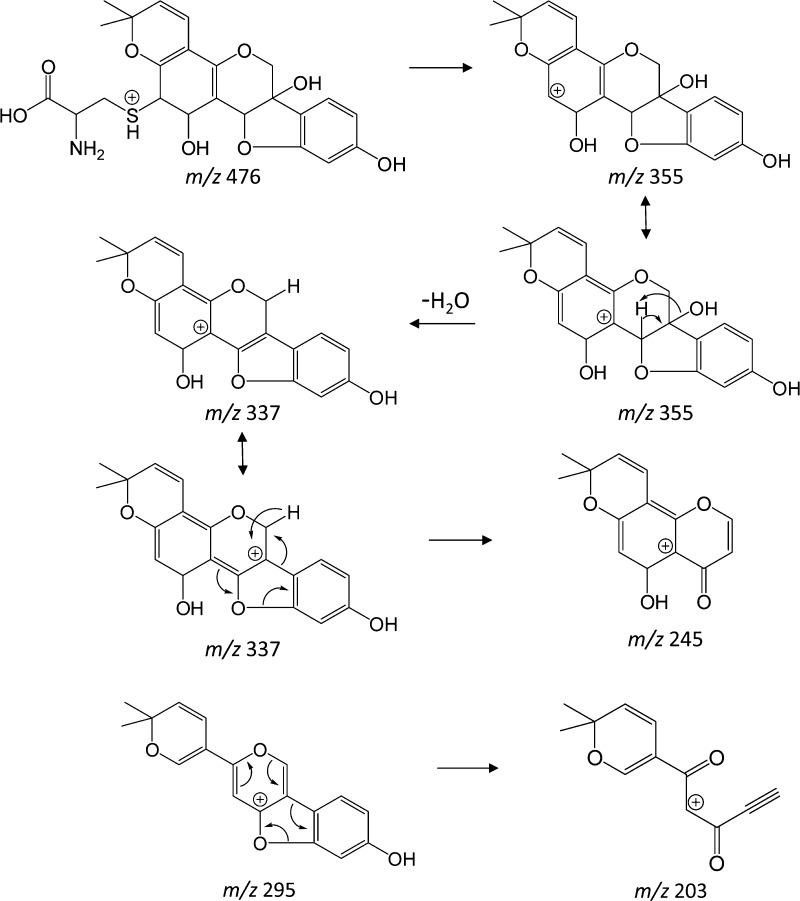
Assignments of oxygenated cysteinylglyceine- (m/z 531 in NI mode) and oxygenated cysteinyl–glyceollin conjugates (m/z 474 in NI mode) were further confirmed by acquiring data in the positive ion (PI) mode. Figure 3a,b show the PI mode LC-ESI-MS/MS CID product ion mass spectra of m/z 533 (protonated cysteinylglyceine glyceollins with an additional oxygen) and m/z 476 (protonated cysteinyl glyceollins with an additional oxygen). The appearance of m/z 355 corresponds to the loss of 178 Da from m/z 533 (Figure 3a) and 121 Da from m/z 476 (Figure 3b), indicating a loss of intact cysteinylglyceine or cysteine, respectively, that mirror the losses observed in the NI mode. Proposed fragment ion structures and decomposition mechanisms of oxygenated cysteinyl glyceollin are shown in Scheme 2. Because the CID product ion spectrum of oxygenated cysteinylglyceine glyceollins (m/z 533, Figure 3a) is similar to the CID product ion spectrum of oxygenated cysteinyl glyceollin (m/z 476, Figure 3b), the decomposition mechanisms for the two metabolites appear to be entirely analogous.
Figure 3.
LC-ESI-MS/MS positive ion mode product ion mass spectra of (a) m/z 533 precursor and (b) m/z 476 precursor. Other isomeric forms of the assigned structures may also exist (see Scheme 1).
Scheme 2. Proposed Structures and Collision-Induced Dissociation Mechanisms of Oxygenated Cysteinyl Glyceollin I.
One isomeric form of m/z 476 is shown, but others are possible (see Scheme 1).
Cysteine conjugates can be further metabolized and acetylated, resulting in mercapturic acid conjugates.41 However, these anticipated conjugates were not detected in precursor ion scans of m/z 148. Consequently, screening for mercapturic acid conjugates of glyceollins was directly performed by product ion scanning. The NI mode LC-ESI-MS/MS CID product ion mass spectrum of m/z 516 (corresponding to the previously detected oxygenated cysteinyl glyceollin, m/z 474, that had potentially undergone acetylation) was performed on rat plasma, urine, and feces samples. Only feces eluted a chromatographic peak corresponding to m/z 516 that appeared at 22.9 min. The NI mode LC-ESI-MS/MS CID product ion mass spectrum of the m/z 516 precursor showed a fragment at m/z 353 corresponding to the loss of mercapturic acid (163 Da), indicating that the precursor was indeed an oxygenated mercapturic acid conjugate of glyceollin. Other fragments similar to those in the CID product ion spectrum of deprotonated glyceollins were detected at m/z 148, 149, and 161; however, for reasons discussed below, in the case of glucuronide conjugation, the signal for m/z 148 was very low. Absence of the mercapturic acid metabolite in plasma and urine may be due to insufficient formation of this metabolite upon a single dose (in contrast to multiple dosing of the rats that provided the source of the feces samples).
Glucuronidation of Glyceollins
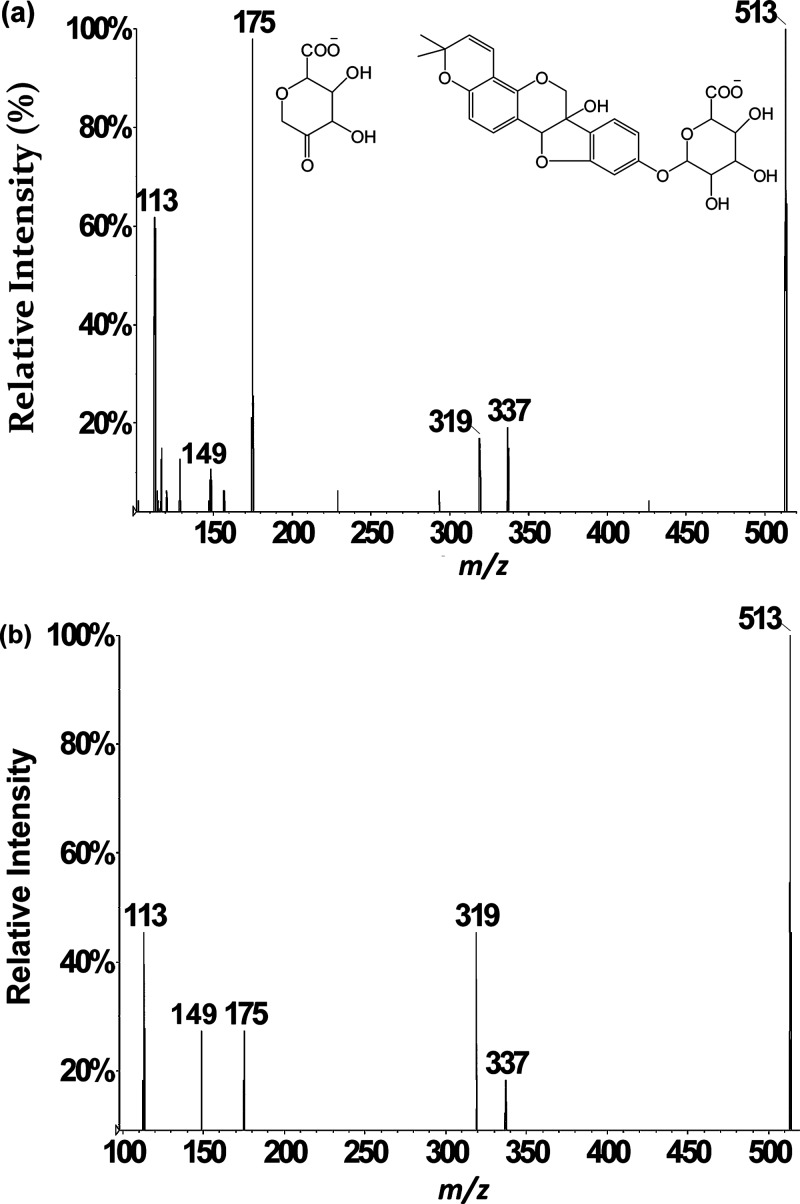
Because glucuronide conjugates have been reported for isoflavones,42−44 the decision was made to screen for glucuronide conjugates of glyceollins by performing product ion scans. In general, an addition of 176 Da in biological medium is well-documented to be characteristic of addition of glucuronic acid.45,46 Thus, the LC-ESI-MS/MS CID product ion scan of m/z 513 was carried out on rat plasma, urine, and feces samples. A corresponding chromatographic peak appeared at 27.6 min from rat plasma and urine samples only. Absence of the glucuronide conjugate in feces is attributed to high levels of β-glucuronidase in the colon from bacteria.26 The averaged product ion mass spectrum (Figure 4a) shows a peak at m/z 337 corresponding to deprotonated glyceollins produced after loss of glucuronic acid.33 In addition, the highest abundance fragment appears at m/z 175. Even though a low abundance product ion at m/z 175 had been observed during CID of deprotonated glyceollins (m/z 337),17,29 the high abundance of m/z 175 in Figure 4a is better rationalized as release of the glucuronate anion. No fragment ions in Figure 4 are shifted by 176 mass units relative to the product ions in the CID spectrum of m/z 337 (deprotonated glyceollins), indicating that the glucuronide moiety is the most labile substituent of the m/z 513 precursor. Accordingly, the other CID product ions are assigned as consecutive decompositions of m/z 337, including m/z 319 (water loss) and m/z 149 production. Interestingly, the m/z 148 ion was absent in these scans. This latter product ion is not always observed upon consecutive decompositions as it requires relatively high energy CID conditions.17 That is, owing to the energy consumed in decomposing m/z 513 to m/z 337, less energy remains for m/z 337 to undergo consecutive decomposition, which results in more favorable kinetics for m/z 149 production relative to m/z 148. This also rationalizes the absence of m/z 513 in the scan for precursors of m/z 148.
Figure 4.
LC-ESI-MS/MS negative ion mode product ion spectrum of m/z 513 precursor corresponding to glucuronic acid conjugates of glyceollins acquired from (a) rat urine and (b) rat liver microsomes.
Glucuronide conjugates of glyceollins for LC-ESI-MS/MS method development are not commercially available. Nonetheless, in vitro glucuronidation is often performed with the aid of uridine diphosphoglucuronosyl-transferase enzymes (UGTs).27 The UGT enzymes are present in abundance in rat liver microsomes. Using this approach, glyceollins were exposed to rat liver microsomes to generate glucuronide conjugates of glyceollins. LC-ESI-MS/MS analyses were then carried out. The retention time and the similar fragmentation pattern in the product ion spectrum of m/z 513 (Figure 4b) from these in vitro incubations confirmed our assignment of the glucuronidated metabolite of glyceollins from rat plasma and urine samples.
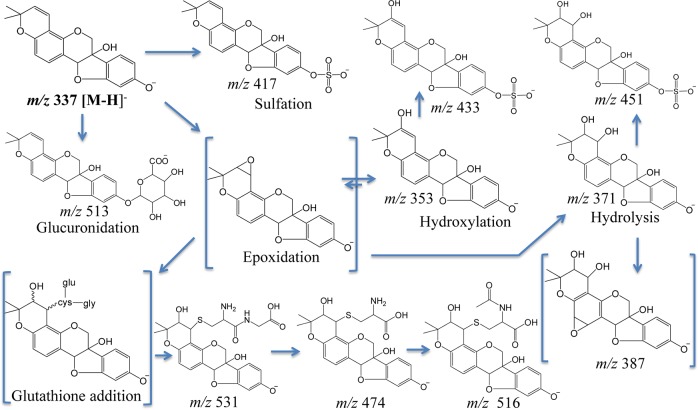
To summarize our findings, LC-ESI-MS/MS analyses were carried out on a triple quadrupole to identify glyceollins and their metabolites from plasma, urine, and feces samples obtained from a 90 mg/kg single oral dose to rats (plasma and urine) or from 90 mg/kg/day for 14 days of dosing (feces). The precursor ion scan of m/z 148 allowed screening for the majority of the glyceollin-related compounds. Table 1 compiles a list of all metabolites found in plasma, feces, and urine of male ZDSD rats. Peaks of interest found at m/z 474 and 531 in all three samples were further investigated by product ion scanning. Tandem mass spectra of m/z 474 and 531 acquired in negative ion mode provided evidence for the glutathione conjugation pathway, and these two metabolites were identified as cysteinyl and cysteinylglyceine conjugates, respectively, of glyceollins with an addition of an oxygen. These assignments were substantiated by examining these conjugates in the positive ion mode. On the basis of this thorough analysis of samples derived primarily from in vivo administration of glyceollins, we proposed that the formation of the GSH-derived metabolites is preceded by epoxide formation (phase I metabolism). Four possible isomeric structures of the conjugates are proposed on the basis of tandem mass spectrometry fragmentation patterns (Scheme 1). Oxygenated forms of mercapturic acid conjugates of glyceollins (m/z 516) were found in rat feces but not in rat plasma or urine. Notably, metabolism of another phytochemical (i.e., sulforaphane) via GSH-conjugation is thought to be associated with the potent anticancer activity of this agent via induction of phase II enzymes to remove reactive oxygen species.34 The possibility that glyceollin’s promising antiproliferative effects are similarly derived from an ability to induce phase II enzymes merits exploration. With respect to the glucuronidation pathway, glucuronide conjugates of glyceollins were detected in rat plasma and urine but not in feces. Unlike the GSH conjugation pathway, glucuronidation was independent of phase I oxidation, as confirmed by in vitro glucuronidation of glyceollins by rat liver microsomes. A summary of all metabolic pathways is presented in Scheme 3.
Table 1. List of All Metabolites of Glyceollins Found in Plasma, Urine, and Fecesa.
| m/z value | plasma | urine | feces | |
|---|---|---|---|---|
| phase I conjugation | ||||
| epoxidation or hydroxylation | 353 | √ | n.d. | √ |
| hydrolysis of a double bond | 355 | √ | n.d. | n.d. |
| diol addition at a double bond | 371 | n.d. | √ | √ |
| diol addition at a double bond plus epoxidation or hydroxylation | 387 | n.d. | √ | √ |
| phase II conjugation | ||||
| sulfate conjugates | 417 | √ | √ | √ |
| sulfate conjugates + oxygen | 433 | √ | n.d. | √ |
| sulfate conjugates with hydrolysis of a double bond | 451 | √ | √ | n.d. |
| glucuronide conjugate | 513 | √ | √ | n.d. |
| cysteinylglyceine + oxygen | 531 | √ | √ | √ |
| cysteine + oxygen | 474 | √ | √ | √ |
| mecapturic acid + oxygen | 516 | n.d. | n.d. | √ |
The m/z values correspond to negative ion mode mass spectrometry. “n.d.” indicates not detected.
Scheme 3. Summary of Glyceollin Metabolism in Male ZDSD Rats.
Brackets surround structures most susceptible to further reaction. Structures proposed in this diagram are not intended to exclude the presence of certain other isomeric forms (see Scheme 1).
To our knowledge, this is the first study to establish glutathione and glucuronide conjugation pathways of glyceollin metabolism. The scan for precursors of m/z 148 is thus a powerful method allowing the characterization of glyceollin metabolites, which may otherwise be difficult to pinpoint, such as the newly reported oxygenated GSH byproduct conjugates found here. These GSH byproduct conjugates yielded mostly neutral losses of the peptide portion during tandem mass spectrometry. Thus, these conjugates may have been overlooked if they were screened using conventional product ion scans that rely on the appearance of charged peptide fragments. Because the appearance of m/z 148 in precursor ion scans requires optimized CID energies, which may vary according to the particular metabolite, a caveat to this method is that all metabolites may not be detected using a single experimental condition (as was the case of mercapturic acid and glucuronide conjugates in this study). Moreover, if precursor CID does not release a conjugate that has adducted to the B fragment, then the m/z 148 ion may not be observed.
Acknowledgments
We thank Dr. Mark L. Heiman of NuMe Health for his expertise and input in designing the rat study. Dr. Denis McCann, Eli Lilly and Company, is also thanked for his advice concerning metabolite extraction procedures. We thank Xavier pharmacy students, Mr. Chukwuemezie Chimezie and Ms. Adina Ewing, for their support in conducting liver microsome incubations and preparing the fecal extracts.
Financial support for this research was provided by the the National Science Foundation through CHE-1058764 (RBC). Additional financial support was provided by the MetaboHUB-ANR-11-INBS-0010 project (France), a Louisiana Cancer Research Consortium Seed Grant (OSP-7011-003) and through NIH RCMI 8G12MD007595-04 from the National Institute on Minority Health (RES). Lastly, access to a TGE FT-ICR FR3624 facility (France) and support for conducting the research is gratefully acknowledged.
The authors declare no competing financial interest.
Funding Statement
National Institutes of Health, United States
References
- Hoyert D.; Xu J. National Vital Statistics Reports 2012, 61, 1–52. [PubMed] [Google Scholar]
- Xu X.; Duncan A. M.; Merz B. E.; Kurzer M. S. Cancer Epidemiol., Biomarkers Prev. 1998, 7, 1101–1108. [PubMed] [Google Scholar]
- Miyanaga N.; Akaza H.; Hinotsu S.; Fujioka T.; Naito S.; Namiki M.; Takahashi S.; Hirao Y.; Horie S.; Tsukamoto T.; Mori M.; Tsuji H. Cancer Sci. 2012, 103, 125–130. [DOI] [PMC free article] [PubMed] [Google Scholar]
- Barnes S.; Prasain J.; D’Alessandro T.; Arabshahi A.; Botting N.; Lila M. A.; Jackson G.; Janle E. M.; Weaver C. M. Food Funct. 2011, 2, 235–244. [DOI] [PMC free article] [PubMed] [Google Scholar]
- Qi W.; Weber C. R.; Wasland K.; Savkovic S. D. BMC Cancer 2011, 11, 219. [DOI] [PMC free article] [PubMed] [Google Scholar]
- Boue S. M.; Carter C. H.; Ehrlich K. C.; Cleveland T. E. J. Agric. Food Chem. 2000, 48, 2167–2172. [DOI] [PubMed] [Google Scholar]
- Burow M. E.; Boue S. M.; Collins-Burow B. M.; Melnik L. I.; Duong B. N.; Carter-Wientjes C. H.; Li S.; W. T. E.; Cleveland T. E.; McLachlan J. A. J. Clin. Endocrinol. Metab 2001, 86, 1750–1758. [DOI] [PubMed] [Google Scholar]
- Setchell K. D. R., Adlercreutz H. In The Role of Gut Microflora in Toxicity and Cancer;Rowland I. A., Ed.; New York: Academic Press, 1988; pp 315–345. [Google Scholar]
- Miksicek R. J. Proc Soc Exp Biol Med. 1995, 208, 44–50. [DOI] [PubMed] [Google Scholar]
- Cassidy A.; Bingham S.; Setchell K. Br. J. Nutr. 1995, 74, 587–601. [DOI] [PubMed] [Google Scholar]
- Rhodes L. V.; Tilghman S. L.; Boue S. M.; Wang S.; Khalili H.; Muir S. E.; Bratton M. R.; Zhang Q.; Wang G.; Burow M. E.; Collins-Burrow B. M. Oncol. Lett. 2012, 3, 163–171. [DOI] [PMC free article] [PubMed] [Google Scholar]
- Salvo V. A.; Boue S. M.; Fonseca J. P.; Elliott S.; Corbitt C.; Collins-Burow B. M.; Curiel T. J.; Srivastav S. K.; Shih B. Y.; Carter-Wientjes C.; Wood C. E.; Erhardt P. W.; Beckman B. S.; McLachlan J. A.; Cleveland T. E.; Burow M. E. Clin. Cancer Res. 2006, 12, 7159–7164. [DOI] [PubMed] [Google Scholar]
- Zimmermann C.; Tilghman S. L; Boue S. M; Salvo V. A; Elliott S.; Williams K. Y.; Skripnikova E. V.; Ashe H.; Payton-Stewart F.; Vanhoy-Rhodes L.; Fonseca J. P.; Corbitt C.; Collins-Burow B. M.; Howell M. H.; Lacey M.; Shih B. Y.; Carter-Wientjes C.; Cleveland T. E.; McLachlan J. A.; Wiese T. E.; Beckman B. S.; Burow M. E. J. Pharmacol. Exp. Ther. 2010, 332, 35–45. [DOI] [PMC free article] [PubMed] [Google Scholar]
- Tilghman S. L.; Boue S. M.; Burow M. E. Mol. Cell. Pharmacol. 2010, 2, 155–160. [Google Scholar]
- Wood C. E.; Clarkson T. B.; Appt S. E.; Franke A. A.; Boue S. M.; Burow M. E.; McCoy T.; Cline J. M. Nutr. Cancer 2006, 56, 74–81. [DOI] [PubMed] [Google Scholar]
- Kim H. J.; Lim J.; Kim W.; Kim J. Proc. Nutr. Soc. 2012, 71, 166–174. [DOI] [PubMed] [Google Scholar]
- Quadri S. S.; Stratford R. E.; Boué S. M.; Cole R. B. Anal. Chem. 2013, 85, 1727–1733. [DOI] [PMC free article] [PubMed] [Google Scholar]
- Gibson G.; Skett P.. Introduction to Drug Metabolism; Blackie Academic and Professional, Champan & Hall: London, 1994. [Google Scholar]
- Maarit H.; Antti H.; Kristiina W.; Herman A. J. Steroid Biochem. Mol. Biol. 2003, 87, 285–299.14698210 [Google Scholar]
- Hu M.; Krausz K.; Chen J.; Ge X.; Li J.; Gelboin H. L.; Gonzalez F. J. Drug Metab. Dispos. 2003, 31, 924–931. [DOI] [PubMed] [Google Scholar]
- Chen J.; Lin H.; Hu M. Cancer Chemother. Pharmacol. 2005, 55, 159–169. [DOI] [PubMed] [Google Scholar]
- Hernandez-Montes E.; Pollard S. E.; Vauzour D.; Jofre-Montseny L.; Rota C.; Rimbach G.; Weinberg P. D.; Spencer J. P. E. Biochem. Biophys. Res. Commun. 2006, 346, 851–859. [DOI] [PubMed] [Google Scholar]
- Graf B. A.; Ameho C.; Dolnikowski G. G.; Milbury P. E.; Chen C.; Blumberg J. B. J. Nutr. 2006, 136, 39–44. [DOI] [PubMed] [Google Scholar]
- Manach C.; Donovan J. L. Free Radical Res. 2004, 38, 771–785. [DOI] [PubMed] [Google Scholar]
- Kroon P. A.; Clifford M. N.; Crozier A.; Day A. J.; Donovan J. L.; Manach C.; Williamson G. Am. J. Clin. Nutr. 2004, 80, 15–21. [DOI] [PubMed] [Google Scholar]
- Liu Y.; Hu M. Drug Metab. Dispos. 2002, 30, 370–377. [DOI] [PubMed] [Google Scholar]
- Bolling B. W.; Court M. H.; Blumberg J. B.; Chen C.-Y.O. J. Nutr. Biochem. 2010, 21, 498–503. [DOI] [PMC free article] [PubMed] [Google Scholar]
- Patel K. R.; Adreadi C.; Britton R. G.; Horner-Glister E.; Karmokar A.; Sale S.; Brown V. A.; Brenner D. E.; Singh R.; Steward W. P.; Gescher A. J.; Brown K. Sci. Transl. Med. 2013, 5, 1–12. [DOI] [PubMed] [Google Scholar]
- Quadri S. S.; Stratford R. E.; Boué S. M.; Cole R. B.. Proceedings of the 60th ASMS Conference on Mass Spectrometry and Allied Topics, Vancouver, BC, May 22, 2012.
- Boué S. M.; Isakova I. A.; Burow M. E.; Cao H.; Bhatnagar D.; Sarver J. G.; Shinde K. V.; Erhardt P. W.; Heiman M. L. J. Agric. Food Chem. 2012, 60, 6376–6382. [DOI] [PubMed] [Google Scholar]
- Kemperman R. F. J.; Horvatovich P. L.; Hoekman B.; Reijmers T. H.; Muskiet F. A. J.; Bischoff R. J. Proteome Res. 2007, 6, 194–206. [DOI] [PubMed] [Google Scholar]
- Quadri S. S.; Stratford R. E.; S. M.; Cole R. B.. Proceedings of the 61th ASMS Conference on Mass Spectrometry and Allied Topics, Minneapolis, April 10, 2013.
- Dourado D. F. A. R.; Fernandes P. A.; Mannervik B.; Ramos M. J. Chemistry 2008, 14, 9591–9598. [DOI] [PubMed] [Google Scholar]
- Watson G. W.; Beaver L. M.; Williams D. E.; Dashwood R. H.; Ho E. AAPS Journal 2013, 10.1208/s12248-013-9504-4. [DOI] [Google Scholar]
- Fahey J. W.; Talalay P. Food Chem. Toxicol. 1999, 37, 973–979. [DOI] [PubMed] [Google Scholar]
- Guerrero-Beltran C. E.; Calderon-Oliver M.; Pedraza-Chaverri J.; Chirino Y. I. Exp. Toxicol. Pathol. 2012, 64, 503–508. [DOI] [PubMed] [Google Scholar]
- Binkley F.; Nakamura K. J. Biol. Chem. 1948, 173, 411. [PubMed] [Google Scholar]
- Boyland E.; Williams K. Biochem. J. 1965, 94, 190–197. [DOI] [PMC free article] [PubMed] [Google Scholar]
- Fjellstedt T A; Allen R H; Duncan B K; Jakoby W B. J. Biol. Chem. 1973, 248, 3702–3707. [PubMed] [Google Scholar]
- Simons R.; Vincken J.; Bohin M. C.; Kuijpers T. F. M.; Verbruggen M. A.; Gruppen H. Rapid Commun. Mass Spectrom. 2011, 25, 55–65. [DOI] [PubMed] [Google Scholar]
- Ketterer B.; Coles B.; Meyer D. J. Environ. Health Perspect. 1983, 49, 59–69. [DOI] [PMC free article] [PubMed] [Google Scholar]
- Shelnutt S. R.; Cimino C. O.; Wiggins P. A.; Ronis M. J.; Badger T. M. Am. J. Clin. Nutr. 2002, 76, 588–594. [DOI] [PubMed] [Google Scholar]
- Zhang Y.; Song T. T.; Cunnick J. E.; Murphy P. A.; Hendrich S. J. Nutr. 1999, 129, 399–405. [DOI] [PubMed] [Google Scholar]
- Zhang Y.; Hendrich S.; Murphy P. A. J. Nutr. 2003, 133, 399–404. [DOI] [PubMed] [Google Scholar]
- Yang P.; Ebbert J. O.; Sun Z.; Weinshilboum R. M. J. Clin. Oncol. 2006, 24, 1761–1769. [DOI] [PubMed] [Google Scholar]
- Gu J. K.; Zhong D. F.; Chen X. Y. Fresenius’ J. Anal. Chem. 1999, 365, 553–558. [Google Scholar]


