Abstract
Background
Gene expression profiling test scores have primarily been used to identify heart transplant recipients who have a low probability of rejection at the time of surveillance testing. We hypothesized that the variability of gene expression profiling test scores within a patient may predict risk of future events of allograft dysfunction or death.
Method
Patients from the IMAGE study with rejection surveillance gene expression profiling tests performed at 1- to 6-month intervals were selected for this cohort study. Gene expression profiling score variability was defined as the standard deviation of an individual’s cumulative test scores. Gene expression profiling ordinal score (range, 0–39), threshold score (binary value=1 if ordinal score ≥34), and score variability were studied in multivariate Cox regression models to predict future clinical events.
Results
Race, age at time of transplantation, and time posttransplantation were significantly associated with future events in the univariate analysis. In the multivariate analyses, gene expression profiling score variability, but not ordinal scores or scores over threshold, was independently associated with future clinical events. The regression coefficient P values were <0.001, 0.46, and 0.773, for gene expression profiling variability, ordinal, and threshold scores, respectively. The hazard ratio for a 1 unit increase in variability was 1.76 (95% CI, 1.4–2.3).
Discussion
The variability of a heart recipient’s gene expression profiling test scores over time may provide prognostic utility. This information is independent of the probability of acute cellular rejection at the time of testing that is rendered from a single ordinal gene-expression profiling test score.
Keywords: Transplant, Tests, Risk factors, Prognosis, Molecular diagnostics
Supplemental digital content is available in the article.
The standard care of adult heart transplant recipients has included surveillance for rejection with serial endomyocardial biopsies (1–3). Because of the risks and discomforts associated with the biopsy procedure, a noninvasive gene expression profiling test (AlloMap) of peripheral blood was developed to identify heart transplant recipients who have a low probability of rejection at the time of surveillance testing (4–6). We have noticed an association of low variability of gene expression profiling scores within an individual and the clinical stability of the individual (7). Therefore, we hypothesized that the variability of gene expression profiling scores within individuals may predict risk of future allograft events.
To test our hypothesis, we utilized the IMAGE (Invasive Monitoring Attenuation by Gene Expression Profiling) study database, which provided independently adjudicated clinical outcome events observed during surveillance of 602 heart transplant recipients (8). In IMAGE, recipients at least 6 months posttransplantation were randomized 1:1 to either surveillance with routine biopsy or gene expression profiling testing. The patients assigned to gene expression profiling underwent a surveillance biopsy only if the gene expression profiling score was equal to or above the specified threshold of 34. A primary outcome event was defined as an episode of rejection with hemodynamic compromise, graft dysfunction due to other causes, death, or retransplantation. Over a median of 19 months of observation, 297 patients monitored with gene expression profiling and 305 patients monitored with biopsies had similar 2-year cumulative rates of events (14.5% and 15.3%, respectively; hazard ratio with gene expression profiling=1.04; 95% confidence interval, 0.67–1.68) (8).
RESULTS
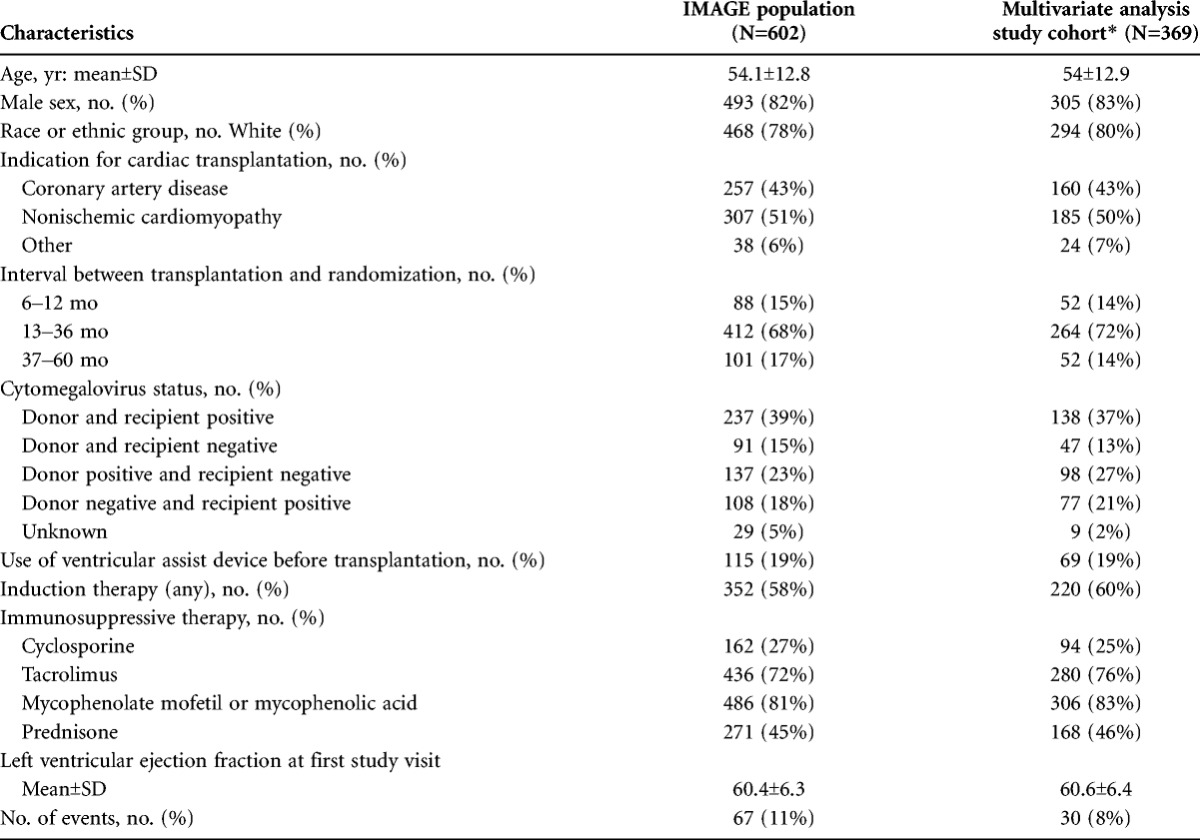
The demographics of the study cohort (N=369) were representative of the features of the parent IMAGE population (n=602) (Table 1). The cohort was predominantly white (80%) men (83%), 54 years of age at the time of transplantation. Study related surveillance began after 12 months posttransplantation in 86% of the cohort.
TABLE 1.
Demographics of study cohort compared to whole IMAGE population
Within Patient Gene-Expression Profile Scores and Variability
The cohort had a mean of 4.4 (SD, ±1.7) gene expression profiling tests and a mean ordinal score of 30.9(SD, ±0.7) (see Table S1 and Figure S1, SDC, http://links.lww.com/TP/A924). The gene expression profiling variability was 1.0 (SD, ±0.8); 74 patients (20%) had variability less than 0.5, 160 patients (43%) had variability greater than 1.0, 65 patients (18%) had variability greater than 1.5, and 26 patients (7%) had variability greater than 2.0. The variability was 1.6 (SD, ±1.4) units for the event and 1.0 (SD, ±0.7) units for the no events subgroups, respectively (P=0.0126, Mann-Whitney test). The within-patient variability scores were weakly associated with the respective within-patient median ordinal scores (Spearman’s correlation coefficient, r=0.14, P<0.001).
Base Clinical Risk Factors Model
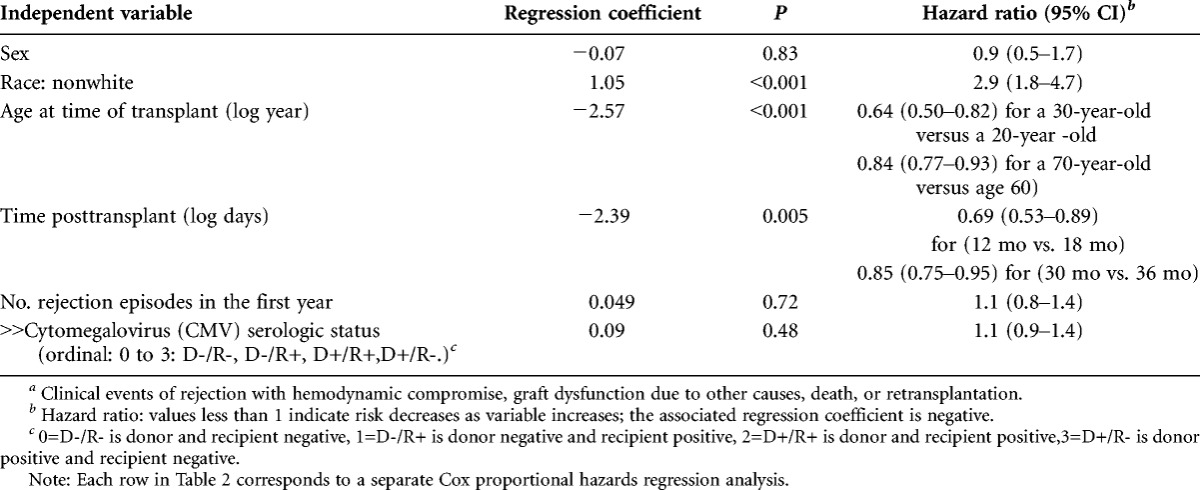
The univariate analyses revealed that nonwhite race, younger age at time of transplantation, and earlier time posttransplantation at study entry were significantly associated with a higher risk of events (Table 2). A nonwhite was 2.9 times more likely to have an event than a white. Sex, number of rejection episodes experienced in the first year posttransplantation, and cytomegalovirus serologic status were not significantly associated with events. The significant risk factors were included in the multivariate models below.
TABLE 2.
Univariate Cox proportional hazards regression analyses of features associated with clinical eventsa
Multivariate Models of Gene Expression Profiling Test Information to Predict Future Clinical Events
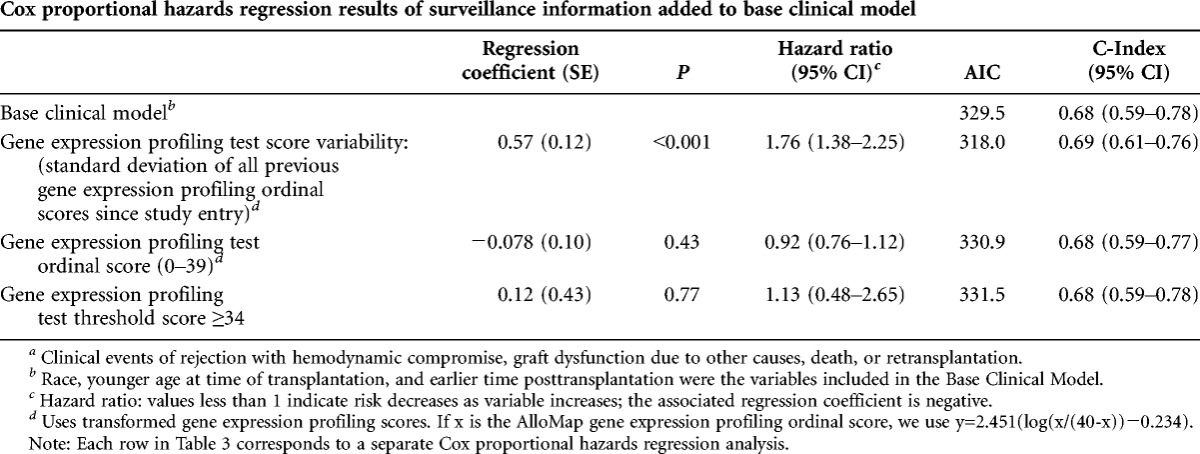
Among the multivariate models, only gene expression score variability was significantly predictive of future clinical events (regression coefficient, P<0.001; Table 3). Gene expression score variability had the lowest estimated information loss (Akaike information criterion (9)) and a predictive accuracy (concordance index) of 0.69 (95% CI, 0.61–0.76). Gene expression score variability was significant even when controlling for gene expression ordinal score (P<0.001; see Table S2, SDC, http://links.lww.com/TP/A924. The C-index for the base clinical risk factors was 0.68 (95% CI, 0.59–0.78).
TABLE 3.
Multivariate models to predict future clinical eventsa
The potential clinical utility of the variability score is illustrated in four cases from the IMAGE study (Fig. 1). The hazard ratio associated with the variability score and adjusted for base clinical risk factors was applied to estimate the probability of future events. The variability score is time varying: for example, in patient B, the variability score is 1.17 at visit 3 and 1.10 at visit 4. Only one example variability score is applied to project the probability of an event in each illustration.
FIGURE 1.
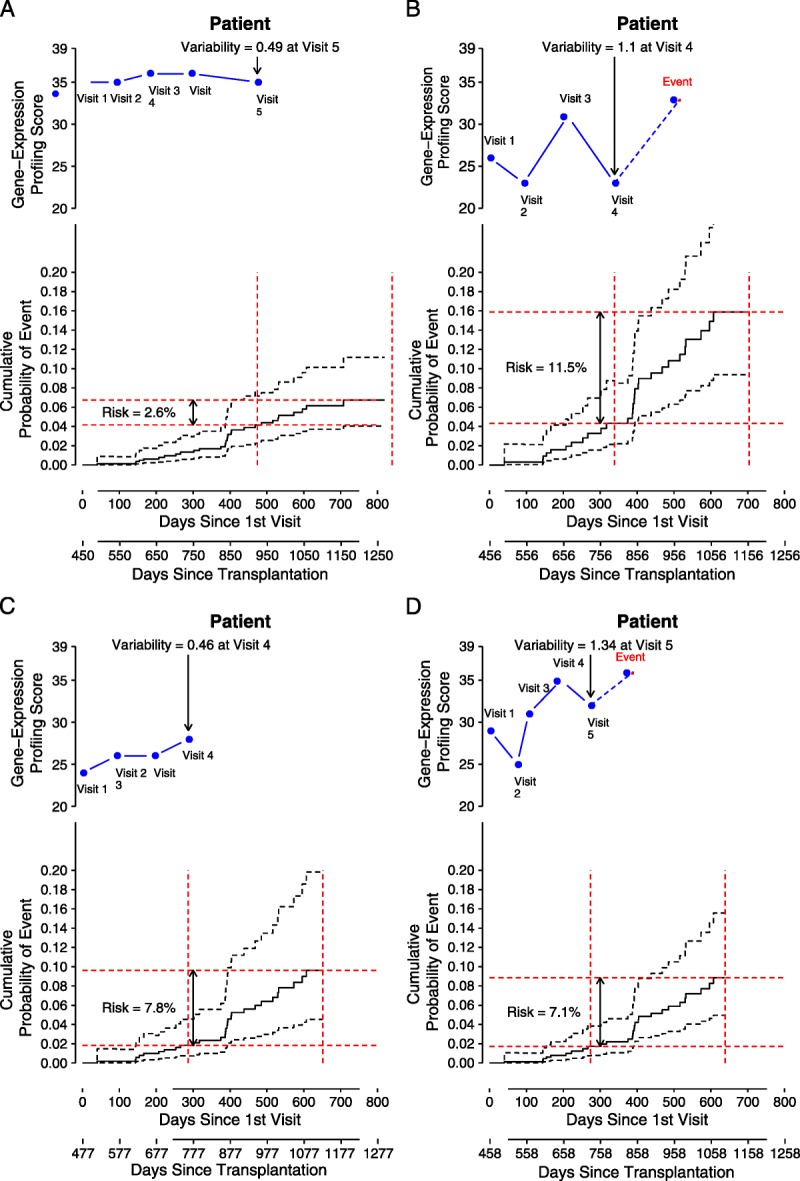
Examples of using gene expression profiling test score variability to predict future clinical events*. In each panel, the top inset graph shows the longitudinal visits and associated gene expression profiling ordinal test scores (the time of the first surveillance gene expression profiling test is treated as day 0). The index visit number and the associated variability score is indicated with the arrow. In the lower inset in each panel, the “probability of event” is plotted, along with 95% CI (dashed lines). The risk (e.g., 2.6%) of an event in the next 12 months for the patient is shown with the red lines.
Patient A
This white man, transplanted at age 57, was 15 months posttransplant at the time of study entry. Patient A had relatively high ordinal scores (35, 35, 36, 36, and 35); because the scores exceeded the nominal threshold (≥34), each triggered a per protocol endomyocardial biopsy. Patient A did not have biopsy-proven rejection in association with his 34 or higher scores (biopsy grades of 0, 0, 1R, 0 and 1R, respectively (10)). At visit 5, his score variability (0.49) was at the 20th percentile of the study cohort. Based on the multivariate model, patient A with this low variability of gene expression profiling scores had a relatively low probability (2.6 %) of a clinical event in the future 12 months from visit 5, although each of his individual ordinal scores exceeded the nominal threshold of 34, which indicated increased risk of moderate or severe (≥grade 2R) acute cellular rejection. This case illustrates that a relatively higher probability of acute cellular rejection associated with an ordinal score 34 or higher (i.e., a 6% to 10% positive predictive value, established from the CARGO population study) may coexist with a relatively low probability of future clinical events. The probability of future clinical events is adjusted for the patient’s underlying clinical risk factors in this model. The risk for future events (defined clinically, without requirement of histologic evidence of rejection) based on the variability of an individual’s gene expression scores may be independent and uncoupled from the risk of acute cellular rejection (defined by histology) based on single gene expression profiling ordinal scores at the time of testing.
Patient B
This white man, transplanted at age 34, was 15 months posttransplant at study entry. His ordinal scores (26, 23, 31, 23, and 33) render a higher variability score (1.10 at visit 4, which is at the 64th percentile of the population) compared with patient A. Patient B’s overall higher risk of having a future event (11.5%) after visit 4 is due to his younger age at time of transplantation (age 34) and his higher gene expression profiling score variability compared with patient A. Patient B went on to incur a clinical event of hemodynamic compromise without rejection about 4 months after his visit 4. Six months later (∼day 1050 posttransplant), he experienced another episode of hemodynamic compromise with histologic evidence of grade 3A acute cellular rejection.
Patient C
This African American woman, transplanted at age 57, was 16 months posttransplant at study entry. Her ordinal scores were 24, 26, 26, and 28. Her low score variability (0.46) at visit 4 was similar to that of patient A. The multivariate model yields a net 12-month probability of a future event of 7.8% forward from visit 4 for patient C. Patient C’s race factor drives her higher risk for future events compared with patient A, the white middle-aged man with a similarly low score variability (0.49). In contrast, patient C has lower risk than patient B, a younger white man, with higher gene expression score variability.
Patient D
Patient D, a white man, was age 66 at the time of transplantation and 15 months posttransplant at study entry. His ordinal scores were 29, 25, 31, 35, and 32. Based on only conventional clinical risk factors, Patient D would be considered to be at lower risk for future events compared with patient C, the African American woman. His one ordinal score of 35 had an associated biopsy rejection grade of 1R. However, from the multivariate model, the probability of a future event (7.1%) in patient D is similar to that of patient C (7.8%) and higher than patient A (2.6%). His gene expression profiling variability score was 1.34, which is at the 77th percentile of the study cohort. Patient D went on to incur a clinical event of rejection with hemodynamic compromise, 3 months after his visit 5.
DISCUSSION
The above anecdotal cases help to illustrate the potential use of gene expression profiling variability to predict the probability of future clinical events in heart transplant recipients. For example, a recipient predicted to be at low risk for future events may become a candidate for further minimization of his/her immunosuppressive maintenance regimen. Conversely, an individual predicted to be at higher risk for future events may receive further evaluation to detect possible underlying causes of the variability such as overlooked infections or noncompliance to medications. Our analyses so far have not enabled us to define the specific causes of a high variability of gene expression profiling scores.
Future mechanistic studies, using a larger number of cases, should focus on identifying individual gene pathways associated with global score variability, to further understand the relationship between score variability and clinical outcomes. The expression levels of the 11 genes that are the core of the AlloMap gene expression profiling test were chosen for their performance in linear discriminant analysis for the probability of the presence or absence of acute cellular rejection (4). The changing expression levels of the genes over time in certain circumstances may reflect a change in the status of the recipient’s immune system that is not directly associated with acute cellular rejection. Up until now, the best characterized specific factors that influence background gene expression profiling scores independent of acute cellular rejection include corticosteroid doses above 20 mg/d of prednisone, which is known to suppress the ordinal score, and cytomegalovirus seropositivity of donor and/or recipient, which raises the average ordinal score relative to cytomegalovirus seronegative recipients (11, 12). Race, sex, age, and blood levels of calcineurin inhibitors have relatively minor influence on AlloMap scores (13).
In the future, we may be able to identify further correlations of the gene expression profiling score, its subcomponent genes, and/or score variability to predict more specific events (e.g., morbidity or death from cancer or cardiac allograft vasculopathy). It will be useful to further characterize gene expression profiling score patterns in larger heart transplant cohorts that include more specific categories of clinical end point events collected over longer follow-up periods to confirm and extend the current model findings. The next studies should also determine how variability is affected by the number and time intervals for repeat testing. The Cardiac Allograft Rejection Gene Expression Observational (CARGO II) observational trial and the early IMAGE (EIMAGE) will provide further data on the gene expression profiling score variability associated with earlier (2–6 months posttransplantation) and more frequent (interval of every 2–4 weeks) use of the gene expression profiling test; ClinicalTrials.gov Identifier NCT00761787 and ClinicalTrials.gov Identifier NCT00962377, respectively (14–16).
The further investigation of gene expression profiling scores and score variability on future clinical events is a worthy endeavor because advances in the understanding of the determinants of long-term outcomes have been identified to be among the highest priorities for future heart transplantation research (17).
The small increase in C-index (0.01) when the variability score is added to the base clinical model indicates limited improvement in discrimination of patients who will have events from those who will not have events. However, the 95 % confidential intervals range from 0.59 to 0.78, so it is possible that with a larger dataset, a larger difference in the C-index may be demonstrated. The variability factor seems to have promise, based on its highly significant regression coefficient and its favorable AIC score. The clinical utility of the variability score may be assessed based not only on its discrimination performance but also on its calibration performance (agreement between predicted and observed risks across subgroups with varying baseline risk) and/or the new test’s reclassification performance (assessment of the proportion of individuals moved between risk categories relevant to treatment decisions) (18). These additional metrics are beyond the scope of this report.
Our analysis does not distinguish if the variability observed is attributed to a temporal increasing (or decreasing) trend or to variability without a trend. The association of score trends with clinical outcomes has not been anecdotally reported and was not proposed in the main clinical hypothesis of this paper. Trend analyses thus awaits assessment in a future study, where availability of more than four or five test results per patient would enhance the power of the analysis.
Based on the results from the current study, we speculate that independent from the established association of ordinal scores over a threshold value with higher risk of acute cellular rejection at the time of testing, the low variability of a set of gene-expression profiling scores within an individual may be associated with future clinical quiescence in an individual. A low gene expression profiling variability score may predict the clinical stability of an allograft recipient, independent of the fundamental interpretation of single ordinal test scores for risk of acute cellular rejection.
In conclusion, the variability of gene expression profiling scores from an individual may help predict the risk of clinically defined future allograft dysfunction or death in the individual. This prognostic information is independent from and complementary to the original use of single gene expression profiling ordinal test scores to estimate the probability of histologically defined acute cellular rejection at the time of testing. To our knowledge, the current report is the first study of the utility of the variability of a biomarker score that is derived from a multivariable gene expression profile. Further development and validation of this prognostic test may enable improvement in the long-term management and clinical outcomes of heart transplant recipients.
MATERIALS AND METHODS
Study Design
The current study was a cohort analysis of patients from the IMAGE study (8). Surveillance visits occurred at 1- and 2-month intervals for patients who were between month 6 and 12 posttransplantation, and at 3-, 4- or 6-month intervals after the first year posttransplantation. The gene expression profiling test (AlloMap) was provided by XDx, Inc., Brisbane, CA (19).
Patient Population and Surveillance Testing
The current study cohort, n=369, was drawn from the 602 patients from 13 US centers in the IMAGE study (8). These 369 patients were selected for inclusion because they had at least two gene expression profiling tests before an event or study end, and at least one endomyocardial biopsy and one echocardiogram were included (Fig. 2). During the course of surveillance of this cohort, primary clinical events were documented in 30 patients. Patients in both IMAGE study arms provided blood samples for gene expression profiling testing at surveillance visits; samples from both arms of the IMAGE study were included in the current analyses.
FIGURE 2.
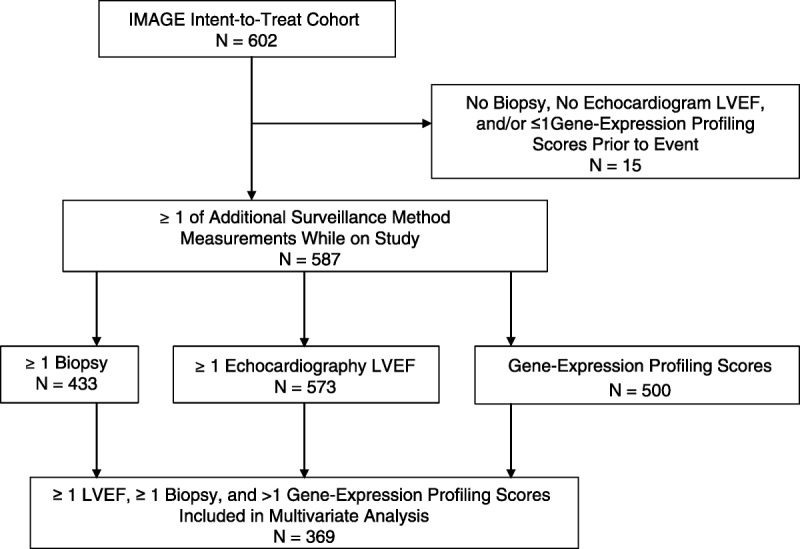
Source of N=369 patients included in the modeling of prediction of future events of allograft failure.
Clinical Events
The definition of clinical events was taken directly from the IMAGE study. The composite end point was composed of a patient’s first event(s) of the following: rejection with hemodynamic compromise, graft dysfunction due to other causes, death, and/or retransplantation. An independent end-points committee had adjudicated all primary events (8).
Statistics
The association of clinical risk factors with clinical events was assessed in a univariate Cox regression model (R-2.13.1, R foundation, Vienna, Austria). The factors included patient’s race, sex, age at time of transplantation, number of prior rejections in first year, cytomegalovirus serologic status, and time posttransplantation. Age at time of transplant and time posttransplantation were log transformed to better fit the risk of events in these analyses. These factors were selected based on prior published evidence of association with risk of poor allograft outcomes and availability of IMAGE data (8, 20).
The factors that reached significance (P<0.05) in the univariate analyses were included with the gene expression profiling scores in the multivariate Cox proportional hazards models. These models provide a prediction of the risk of future events expressed as a hazard ratio from the gene expression profiling scores, adjusted for the base clinical risk factors. The underlying time variable in the Cox regression model was the time since enrollment in the study, rather than time since transplant. This analysis method was selected because, per the IMAGE study protocol inclusion criteria, no patients were enrolled until after 6 months posttransplantation.
The gene expression profiling scores were analyzed in three ways: 1) the ordinal score, an integer ranging from 0 to 39; 2) the threshold score, assigned a binary value of 0 if the ordinal score was less than 34 and assigned a value of 1 if the ordinal score is 34 or higher; and 3) the variability score, which is the standard deviation of all ordinal scores measured within a patient, before incurring a clinical event. The method for computing the variability score is as follows. First, collect the gene expression profiling ordinal scores from the previous visits of an individual: for example, x =24, 23, 31, and 23. Second, transform each ordinal score by the inverse logit transformation, where for ordinal score x, y=2.451(log(x/(40-x))-0.234) is the transformed score. In the example, y=0.42, 0.17, 2.5, and 0.17. This transformation is necessary to better satisfy the modeling assumptions of the Cox model. Third, calculate variability score, which is the standard deviation of the transformed scores:
 , where xi are the N=4 transformed scores, and μ is the mean of the scores. In the example, the variability score is 1.11. The variability score is a time-varying covariate. Beginning with the second visit, one may compute the variability score and use that to predict the risk of events from then until the time of visit 3 or first event, whichever occurs first. If there is no prior event, then at visit 3, one may compute a new variability score based on three ordinal scores to predict an event up to the time of visit 4 (or first event) and so on.
The multivariate models render a regression coefficient and hazard ratio for risk of future events for each of the gene expression profiling score variables, adjusted for the base clinical risk factors. The comparative performance of the three models was assessed by the Akaike information criterion (AIC) and the concordance index (C-index). The AIC is a measure of the estimated information loss in the statistical model; the smaller the AIC, the less is the information loss by the model relative to other models (9). The C-index is a generalization of the area under the receiver operator characteristic curve and measures how well the model performs in predicting future clinical events (21).
Supplementary Material
Footnotes
This study was supported by XDx.
Dr. Deng has received grant support, consulting fees, and honorarium from XDx. Ms Elashoff has received consulting fees from XDx. Dr. Pham has received grant support from XDx. Dr. Teuteberg has received grant support from XDx and has served on an advisory board to XDx. Dr. Kfoury has received grant support, consulting fees, and honorarium from XDx; Dr. Starling has received grant support from XDx. Dr. Cappola has received grant support from XDx and Celladon. A patent on gene expression assays to diagnose and track cardiac allograft rejection arising from independent research is pending. Dr. Cappola is one of the inventors. Dr. Kao has received grant support, consulting fees, and honorarium from XDx. Dr. Anderson has received grant support from XDx. Dr. Cotts has received grant support from XDx. Dr. Ewald has received grant support from XDx. Dr. Baran has received grant support from XDx. Dr. Bogaev has received grant support, consulting fees, and financial support for a Texas Heart Institute CME conference from XDx. Dr. Shahzad has received grant support from XDx. Dr. Hiller is an employee in XDx, and Dr. Yee is an employee and owns equity in XDx. Dr. Valantine has received grant support from XDx and has served on an advisory board to XDx.
CLINICAL TRIAL REGISTRATION: ClinicalTrials.gov number, NCT00351559.
Supplemental digital content (SDC) is available for this article. Direct URL citations appear in the printed text, and links to the digital files are provided in the HTML text of this article on the journal’s Web site (www.transplantjournal.com).
REFERENCES
- 1. Costanzo MR, Dipchand A, Starling R, et al. The International Society of Heart and Lung Transplantation Guidelines for the care of heart transplant recipients. J Heart Lung Transplant 2010; 29: 914. [DOI] [PubMed] [Google Scholar]
- 2. Kirklin JK. Is biopsy-proven cellular rejection an important clinical consideration in heart transplantation? Curr Opin Cardiol 2005; 20: 127. [DOI] [PubMed] [Google Scholar]
- 3. Hamour IM, Burke MM, Bell AD, et al. Limited utility of endomyocardial biopsy in the first year after heart transplantation. Transplantation 2008; 85: 969. [DOI] [PubMed] [Google Scholar]
- 4. Deng MC, Eisen HJ, Mehra MR, et al. Noninvasive discrimination of rejection in cardiac allograft recipients using gene expression profiling. Am J Transplant 2006; 6: 150. [DOI] [PubMed] [Google Scholar]
- 5. Starling RC, Pham M, Valantine H, et al. Molecular testing in the management of cardiac transplant recipients: initial clinical experience. J Heart Lung Transplant 2007; 26: 204. [DOI] [PubMed] [Google Scholar]
- 6. Austin B, Wang E, Arnold PJ, et al. Impact of time post transplant on gene expression profile scores, an analysis of 34,567 tests. J Heart Lung Transplant 2012; 31: S35 [Google Scholar]
- 7. Deng MC, Alexander G, Wolters H, et al. Low variability of inter individual longitudinal leukocyte gene expression profiling cardiac allograft rejection scores. Transplantation 2010; 90: 459. [DOI] [PubMed] [Google Scholar]
- 8. Pham MX, Teuteberg JJ, Kfoury AG, et al. , for the IMAGE Study Group Gene expression profiling for rejection surveillance after cardiac transplantation. N Engl J Med 2010; 362: 1890. [DOI] [PubMed] [Google Scholar]
- 9. Akaike H. A new look at the statistical model identification. IEEE Transactions on Automatic Control 1974; 19: 716 [Google Scholar]
- 10. Stewart S, Winters GL, Fishbein MC, et al. Revision of the 1990 Working Formulation for the Standardization of Nomenclature in the Diagnosis of Heart Rejection. J Heart Lung Transplant 2005; 24: 1710. [DOI] [PubMed] [Google Scholar]
- 11. Mehra MR, Kobashigawa JA, Deng MC, et al. Transcriptional signals of T-cell and corticosteroid-sensitive genes are associated with future acute cellular rejection in cardiac allografts. J Heart Lung Transplant 2007; 26: 1255. [DOI] [PubMed] [Google Scholar]
- 12. Cotts W, Deng M, Elashoff B, et al. Correlation of cytomegalovirus (CMV) serologic status of heart transplant recipients to gene-expression profiling scores and clinical outcomes: results from the IMAGE Multicenter Study. J Heart Lung Transplant 2012; 31: S165 [Google Scholar]
- 13. Khush K, Pham MX, Teuteberg JJ, et al. Racial disparities after heart transplant: evidence from IMAGE. J Heart Lung Transplant 2013; 32: S102 [Google Scholar]
- 14. Crespo-Leiro MG, Schulz U, Zuckermann A, et al. Prediction of allograft clinical outcomes and risk of acute cellular rejection with a non-invasive gene expression profiling test (AlloMap): results from the CARGO 2 European-Based Multicenter Trial. J Heart Lung Transplant 2012; 31: S113 [Google Scholar]
- 15. Crespo-Leiro MG, Stypmann J, Zuckermann A, et al. Utility of gene expression profiling test (GEP) score instability to predict future clinical outcomes in heart transplant: results from the CARGO 2 European-based multicenter trial. J Heart Lung Transplant 2013; 32: S113 [Google Scholar]
- 16. Kobashigawa J, Patel J, Kittleson M, et al. Results of a randomized trial of Allomap vs heart biopsy in the 1st year after heart transplant: early invasive monitoring attenuation through gene expression trial. J Heart Lung Transplant 2013; 32: S203. [DOI] [PubMed] [Google Scholar]
- 17. Shah MR, Starling R, Schwartz Longacre L, et al. Working group participants heart transplantation research in the next decade—a goal to achieving evidence-based outcomes: National Heart, Lung, and Blood Institute Working Group. J Am Coll Cardiol 2012; 59: 1263. [DOI] [PMC free article] [PubMed] [Google Scholar]
- 18. Wang TJ. Assessing the role of circulating, genetic, and imaging biomarkers in cardiovascular risk prediction. Circulation 2011; 123: 551. [DOI] [PMC free article] [PubMed] [Google Scholar]
- 19.XDx AlloMap Laboratory Services Guide, LQ10004 revision 1. [Google Scholar]
- 20. Stehlik J, Edwards LB, Kucheryavaya AY, et al. The registry of the international society for heart and lung transplantation: twenty-eighth adult heart transplant report—2011. J Heart Lung Transplant 2011; 30: 1078. [DOI] [PubMed] [Google Scholar]
- 21. Cook NR. Statistical evaluation of prognostic versus diagnostic models: beyond the ROC curve. Clin Chem 2008; 54: 17. [DOI] [PubMed] [Google Scholar]
Associated Data
This section collects any data citations, data availability statements, or supplementary materials included in this article.


