

Abstract
Although some long noncoding RNAs (lncRNAs) have been shown to regulate gene expression in cis, it remains unclear whether lncRNAs can directly regulate transcription in trans by interacting with chromatin genome-wide independently of their sites of synthesis. Here, we describe the genomically local and more distal functions of Paupar, a vertebrate-conserved and central nervous system-expressed lncRNA transcribed from a locus upstream of the gene encoding the PAX6 transcription factor. Knockdown of Paupar disrupts the normal cell cycle profile of neuroblastoma cells and induces neural differentiation. Paupar acts in a transcript-dependent manner both locally, to regulate Pax6, as well as distally by binding and regulating genes on multiple chromosomes, in part through physical association with PAX6 protein. Paupar binding sites are enriched near promoters and can function as transcriptional regulatory elements whose activity is modulated by Paupar transcript levels. Our findings demonstrate that a lncRNA can function in trans at transcriptional regulatory elements distinct from its site of synthesis to control large-scale transcriptional programmes.
Keywords: CHART, CNS, lncRNA, PAX6, transcription
Introduction
The resolution of two key questions would greatly improve our understanding of the functions of long noncoding RNAs (lncRNAs; ≥200 nucleotides). First, is it more often the RNA product or else the act of transcription that conveys lncRNA function? Second, is any given lncRNA more likely to control transcription locally (in the vicinity of its locus) or else more distally in the genome?
A number of lncRNAs have been shown to regulate transcription of neighbouring genes on the same chromosome in an apparent cis-acting mechanism (Lai et al, 2013; Melo et al, 2013; Wang et al, 2011). These lncRNAs appear to function near their site of synthesis, in either an RNA-dependent manner to mediate looping onto the promoter regions of their transcriptional targets, or by using RNA-independent mechanisms to locally alter chromatin status. By contrast, lncRNA transcripts have also been proposed to regulate gene expression in trans, without influencing transcription of their genomically neighbouring genes (Guttman et al, 2011; Hung et al, 2011). Trans-acting lncRNAs include p53-induced lncRNAs involved in mediating the DNA damage response (Huarte et al, 2010; Hung et al, 2011), lncRNAs transcribed from within the promoters of cell cycle genes (Hung et al, 2011), lncRNAs that function in the control of pluripotency and lineage differentiation (Guttman et al, 2011) and those that are regulators of dosage compensation (Chu et al, 2011; Simon et al, 2011). Other examples include Evf-2 which binds and modulates the activity of the homeodomain containing transcription factor Dlx2 (Feng et al, 2006), and Hotair, a lncRNA transcribed from the HoxC locus, which regulates the activity of HoxD cluster genes in trans and interacts with chromatin at over 800 regions genome-wide (Chu et al, 2011; Rinn et al, 2007). LncRNAs therefore have the potential to interact with chromatin and specifically target multiple different loci genome-wide.
LncRNA loci that are transcribed in the developing mouse central nervous system (CNS) show a preference to be located adjacent to transcription factor genes and thus may regulate their transcription (Ponjavic et al, 2009). Here, we investigate the transcriptional function of a CNS expressed, unspliced, and chromatin-associated intergenic lncRNA termed Paupar that is divergently transcribed 8.5 kb upstream of Pax6. Paupar was prioritised for detailed experimental investigation from among those we catalogued previously (Ponjavic et al, 2009) owing to the atypical evolutionary conservation of its sequence and transcription and because of its physical proximity to the transcription factor Pax6.
Pax6 is required for eye and diencephalon specification and is known to control progenitor cell potency, progenitor cell proliferation, neuronal cell sub-type specification and spatial patterning in a dosage-sensitive manner (Georgala et al, 2011; Hill et al, 1991; Sansom et al, 2009; Shaham et al, 2012). Heterozygous human PAX6 mutations can result in aniridia and in a variety of structural brain abnormalities that closely resemble those seen in Small eye (sey) mice heterozygous for Pax6 mutations (Georgala et al, 2011; Hingorani et al, 2012). The proximity of the Paupar gene to Pax6 suggested to us that it may be involved in the spatiotemporal control of Pax6 expression and hence that it may be important for nervous system development and neurological disease.
Our results demonstrate functions for Paupar in the control of growth and differentiation in neural cells. In addition to conveying these functions locally, via transcriptional regulation of Pax6, we unexpectedly discovered that Paupar also functions distally in trans to control neural gene expression on a large scale. We mapped genome-wide Paupar occupancy in N2A neuroblastoma cells and identified hundreds of genes that are both bound and regulated by Paupar. We discovered that the Paupar transcript physically associates with PAX6 protein and that Paupar and PAX6 co-occupy specific genomic binding sites. Our results also revealed that Paupar associates in trans with functional elements involved in transcriptional control and that the Paupar transcript can modulate these elements’ activity. Our data therefore demonstrate that a single lncRNA transcript can bind and regulate the activity of multiple transcriptional regulatory elements on different chromosomes distinct from its site of synthesis.
Results
Conserved Paupar genomic organisation and transcription
RNA polymerase II-transcribed, CNS-expressed mouse lncRNAs tend to be evolutionarily constrained and to be preferentially located adjacent to transcriptional regulatory genes in the genome (Ponjavic et al, 2009, 2007). One of these lncRNAs (GenBank: AK032637), which we term Paupar (Pax6 Upstream Antisense RNA), is a single exon lncRNA transcribed from 8.5 kb upstream of the Pax6 gene in mouse which lies entirely within the first intron of Pax6os1, a previously defined non-coding Pax6 natural antisense transcript locus (Fig1A; Alfano et al, 2005). Rapid amplification of cDNA ends (RACE) experiments in mouse neuroblastoma cells extended AK032637 by approximately 700 bp at the 5′ end revealing mouse Paupar to be a 3.48 kb transcript (Fig1B). The Paupar locus contains two regions of high DNA sequence conservation across diverse vertebrates that unusually include fish and birds as well as mammals (Fig1B). The first of these regions lies just 5′ upstream of the Paupar transcriptional start site and is likely to contain this transcript's promoter sequence. The second lies within the transcribed sequence and encompasses both a previously identified Pax6 neuroretina enhancer element (Plaza et al, 1999) and a region of the transcript that we predicted to contain a stem loop secondary structure (Ponjavic et al, 2009). The orthologous human transcript, transcribed from 8.6 kb upstream of the human PAX6 gene, was identified in foetal brain using RT-PCR and RACE and shows three regions of high sequence identity to its mouse orthologue (Fig1C). Paupar transcripts are known from dog, as well as from more distantly related vertebrates, frog and zebrafish (Fig1C). Paupar therefore is unusual in exhibiting higher degrees of sequence and transcriptional conservation than most lncRNA loci (Cabili et al, 2011; Marques & Ponting, 2009; Ulitsky et al, 2011).
Figure 1.

- A Schematic illustration of the mouse Pax6 genomic territory displaying coding and non-coding transcript structures (NCBI37/mm9).
- B A detailed view of the mouse Paupar locus (red) indicating regions of vertebrate DNA sequence conservation and the location of sequence (blue) that, in human and quail, is a Pax6 neuroretina enhancer (Plaza et al, 1999).
- C Conservation and relative sizes of identified Paupar transcripts in vertebrates. For human and mouse Paupar, transcript start sites (arrows) and transcript ends were confirmed by RACE (primer sequences in Supplementary Table 1). The identified orthologous ESTs from dog (DN871729), frog (CX414799, DN054151 and DN054152), and zebrafish (CT684153 and CT684154) are unlikely to represent full-length transcripts. Each of these Paupar orthologues displays conserved genomic location and transcriptional orientation relative to Pax6.
- D, E Paupar is a brain-expressed lncRNA. Paupar (D) and Pax6 (E) expression levels were measured across a panel of adult mouse tissues using quantitative RT-PCR (qRT-PCR). Results are presented relative to the average value of Gapdh and Tbp reference genes. Mean values ± standard error (s.e.) shown, n = 3 replicates.
- F, G Similarly to Pax6, Paupar is up-regulated during neuronal differentiation of mouse ES cells. Neuronal differentiation of mouse ES cells was induced using RA. We determined the levels of Paupar (F) and Pax6 (G) using qRT-PCR. Results are expressed relative to an Idh1 control which does not change significantly during differentiation. Mean ± s.e., n = 3.
- H, I Paupar is a chromatin-associated transcript that functions to regulate Pax6 expression. N2A cells were biochemically separated into cytoplasmic, nucleoplasm, 420 mM salt and chromatin fractions. The relative levels of Paupar (H) and a control mRNA (Tbp) (I) in each fraction were determined by qRT-PCR. Mean values ± s.e. of three independent experiments. RT, reverse transcriptase.
Paupar transcript is chromatin associated and co-expressed with Pax6 in the neural lineages
To begin our investigation of Paupar function we first characterised its expression profile and sub-cellular localisation. We found that mouse Paupar is most highly expressed in the adult brain (Fig1D) and shows a clear correspondence in expression profile with Pax6 (Fig1E). Notably, Paupar is expressed in the developing cerebellum in both the internal and external granular layers, where Pax6 is also strongly expressed (Supplementary Fig S1A). Given the apparent spatial co-expression of Paupar and Pax6, we then asked whether their expression is temporally coordinated during retinoic acid (RA)-induced differentiation of mouse E14 embryonic stem (ES) cells. While Paupar expression is undetectable in self-renewing ES cells, it is rapidly and transiently up-regulated after 1 day of RA treatment before increasing again at 4 days (Fig1F), a profile similar to that observed for Pax6 (Fig1G). Mouse neuro 2A (N2A) neuroblastoma cells express both Paupar (at an average level of approximately 15 copies per cell [Supplementary Fig S1B]) and Pax6, but not Pax6OS1 (Supplementary Fig S1C), and are widely used as an in vitro model of neuronal differentiation. In these cells, we found Paupar RNA (Fig1H), but not a control mRNA (Tbp; Fig1I), to be nuclear-enriched and located mainly in the chromatin fraction, and noted that ENCODE data show human Paupar to be similarly present in the nucleus and chromatin (ENCODE Project Consortium, 2012). Together, these data suggest that Paupar may act locally to regulate Pax6 expression or that it may regulate similar biological processes as Pax6.
Paupar regulates neural gene expression
To investigate the functional importance of the Paupar transcript we performed transcriptome profiling of Paupar knockdown in N2A cells. We reduced Paupar expression by approximately 52%, using transient transfection of a Paupar-targeting shRNA expression vector (Fig2A), and verified that the chromatin-associated fraction of Paupar is depleted using this approach (Supplementary Fig S2A). Paupar knockdown resulted in statistically significant changes in the expression levels of 942 genes (False Discovery Rate [FDR] < 5%) compared to a non-targeting control (Supplementary Table 2); 654 (69%) of these genes were down-regulated and 288 (31%) were up-regulated (Fig2B).
Figure 2.
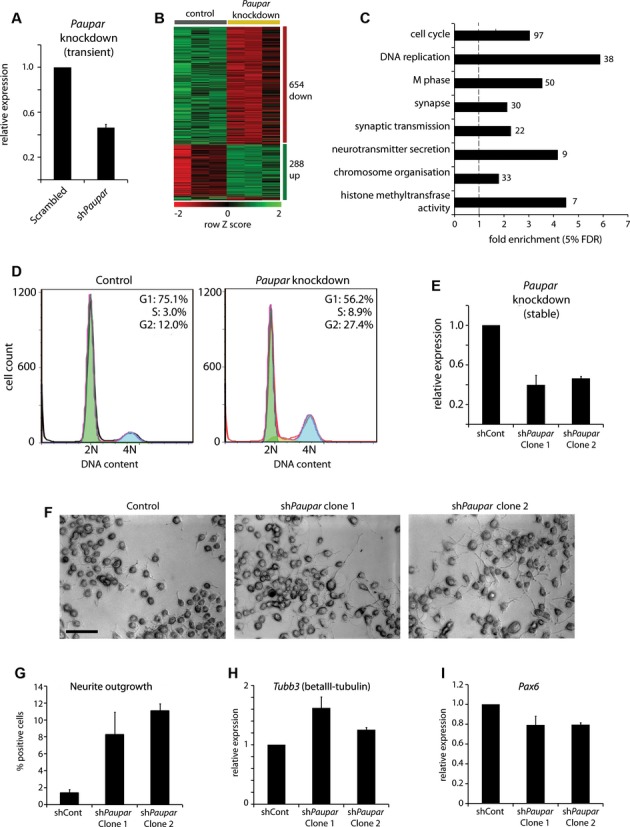
- A N2A cells were transfected with either a non-targeting control or a Paupar-targeting shRNA expression vector (sh408) and Paupar levels were determined by qRT-PCR 3 days later.
- B Paupar knockdown induces statistically significant changes in the expression of 942 genes in N2A cells (5% FDR; Supplementary Table 2).
- C Significant Gene Ontology annotation enrichments of Paupar-regulated genes (5% FDR, Supplementary Table 3).
- D Paupar is important for normal S-phase progression and entry into mitosis. Mouse N2A cells were transfected with either a control or a Paupar-targeting shRNA expression vector. Three days later cells were fixed, stained with propidium iodide and the DNA content measured using flow cytometry.
- E Paupar loss-of-function cell lines were generated by stable co-transfection of shRNA expression plasmids against either Paupar or a non-targeting control and a hygromycin expression vector for selection. qRT-PCR analysis confirms the generation of two clonal cell lines expressing reduced levels of Paupar. Mean values ± s.e.
- F Paupar knockdown cells display increased neurite outgrowth. Control and Paupar knockdown cells were imaged using bright field microscopy. Scale bar, 50 μm.
- G Quantification of neurite outgrowth. Cells with one or more neurites of length greater than twice the cell body diameter were scored as positive. Average values ± s.e., n = 3. A total of 100–200 cells were counted in each case.
- H, I The relative levels of the neuronal differentiation marker Tubb3 (H) and Pax6 (I) were quantified in Paupar knockdown and control cells using qRT-PCR. Samples were normalised using Gapdh and are presented relative to expression in control cells (set arbitrarily to 1). Mean values ± s.e., n = 3.
Paupar-regulated genes are significantly enriched in those involved in cell cycle control, specifically DNA replication and mitosis, those playing a role in synaptic function, and those modifying chromatin and chromosome organisation (Fig2C, Supplementary Table 3). To validate the changes in expression observed from the microarrays, we performed qRT-PCR for 12 Paupar-regulated genes with two additional Paupar-targeting shRNA expression constructs (Supplementary Fig S2B). We observed consistent changes for all 12 genes and saw changes in expression commensurate with the strength of Paupar knockdown indicating that transcript level changes are specific and are not likely to result from off-target effects. Furthermore, Paupar overexpression induced dose-dependent changes in the expression of six out of eleven Paupar-regulated genes tested (Supplementary Fig S2C). The Paupar transcript therefore appears to function as a large-scale regulator of gene expression in neural cells.
Paupar regulates neural growth and differentiation in N2A cells
We next investigated the role of Paupar in cell cycle control by assaying the effect of Paupar knock-down on the proliferation of N2A cells. Paupar knockdown cells accumulate in S and G2 phases (Fig2D) indicating that this transcript is necessary for normal passage through S phase and entry into mitosis. Taken together with the temporally regulated expression of Paupar during neural differentiation, these data indicate that Paupar may be important for the control of neural progenitor cell proliferation and differentiation.
To further investigate this hypothesis we generated stable Paupar loss-of-function N2A cell lines and analysed the role of the Paupar transcript in neural differentiation. We isolated and expanded two independent clones in which Paupar levels had been reduced by 50–60% (Fig2E). Strikingly, the Paupar knockdown clones showed a clear increase in neurite outgrowth, a well-characterised feature of neuronal differentiation, compared to a non-targeting control line (Fig2F and G). Additionally, the Paupar knockdown clones also showed increased levels of the neuronal differentiation marker Tubb3 (encoding tubulin beta-3 chain) and a moderate reduction in Pax6 which is known to be down-regulated upon neuronal differentiation (Fig2H and I). Together, these results indicate that Paupar regulates gene expression programmes that control neural growth and differentiation, acting to maintain the self-renewal of N2A cells.
Paupar and Pax6 have both common and distinct transcriptional targets
Given the known roles of Pax6 in controlling neural stem cell fate, we next sought to further investigate the effect of Paupar RNA reduction on the expression of Pax6. While we observed a small decrease in Pax6 transcript levels following stable Paupar knockdown (Fig2I), this finding cannot be interpreted unambiguously given that neural progenitor cells can down-regulate Pax6 as they become neurogenic (Hsieh & Yang, 2009) and that Pax6 is known to auto-regulate its own expression (Aota et al, 2003; Manuel et al, 2007). We therefore reduced Paupar levels with two distinct shRNAs transfected into N2A cells (Fig3A) and used qRT-PCR to measure acutely induced changes in Pax6 expression. Transient reduction in Paupar RNA levels up-regulated Pax6 in a dose-dependent manner: a maximum 54% reduction in Paupar levels resulted in an 80% increase in Pax6 expression (Fig3A). These observations agreed with a small (1.2-fold), yet genome-wide non-significant, increase in Pax6 expression detected on the Paupar knock-down microarrays.
Figure 3.

- Paupar knockdown leads to an increase in Pax6 expression. N2A cells were transfected with two independent shRNA expression constructs targeting different regions of the Paupar transcript. The levels of Paupar and the adjacent Pax6 gene were quantified using qRT-PCR 3 days later. Samples were normalised using Gapdh and the results are presented relative to a non-targeting control (set at 1). Mean values ± s.e., n = 4, one-tailed t-test, unequal variance.
- Cells were transfected with either a non-targeting control or a Pax6-targeting shRNA expression vector and PAX6 protein levels were analysed by Western blotting 3 days later. Lamin B1 expression was used as a loading control.
- Pax6 knockdown resulted in statistically significant changes in the expression of 925 genes in N2A cells (10% FDR, Supplementary Table 2).
- Intersection of Pax6 and Paupar targets reveals a significant (Fisher's exact test) overlap approximately five times as large as expected by chance alone.
- Target genes for both Paupar and Pax6 show correlated expression, with the majority being positively regulated by both factors. +, positive dependency; −, negative dependency.
- Enrichments of Gene Ontology categories in Pax6 and Paupar target genes.
Given the ability of Paupar to regulate Pax6 expression, we sought to determine the extent to which this could explain the Paupar transcriptional response. Reduction of PAX6 protein levels in N2A cells by approximately 70%, through the transient transfection of a Pax6-targeting shRNA expression vector (Fig3B), resulted in statistically significant expression level changes in 925 genes (FDR < 10%; Fig3C and Supplementary Table 2). Importantly, we noted no change in the levels of Paupar transcript upon Pax6 knockdown (Supplementary Fig S3). Genes changing in expression, as expected from the role of PAX6 as a key neuro-developmental transcription factor, were enriched for genes involved in neurogenesis and transcription factor binding (Fig3F, Supplementary Table 3).
The set of genes showing significant expression changes in both Paupar and Pax6 knock-downs was 5.1-fold greater than expected by chance (P < 2.2 × 10⁻¹⁶; Fig3D), consistent with Paupar regulating Pax6 expression. A large majority of these genes showed positively correlated changes in expression for both Paupar and Pax6 knock-down (Fig3E) indicating that while Paupar may repress Pax6 transcription, Paupar RNA and PAX6 protein cooperate to coordinate the expression of a common set of target genes. However, notwithstanding the significant overlap between genes regulated by Pax6 and Paupar, a large majority of Paupar responsive genes are not significantly altered by Pax6 knockdown suggesting that Paupar may also possess Pax6-independent trans-acting functions. Notably, genes regulated by Paupar but not by Pax6 are enriched for regulators of cell cycle control and chromatin organisation, while genes whose expression are controlled by both Paupar and Pax6 include many with synaptic functions (Fig3F, Supplementary Table 3).
Genome-wide binding profile of the Paupar lncRNA in N2A cells
We next investigated whether Paupar might function as a trans-acting transcriptional regulator by binding to genomic locations distal to its own locus. We first mapped the genome-wide binding profile of Paupar using the recently described Capture Hybridisation Analysis of RNA Targets (CHART)-Seq technique (Simon, 2013; Simon et al, 2011) in N2A cells. This approach uses anti-sense oligonucleotides to purify target lncRNAs and their associated chromatin complexes and thus identifies both direct and indirect genomic associations. We mapped accessible regions of the Paupar transcript based on RNase H sensitivity and designed four biotinylated DNA oligonucleotides, complementary to these regions (Supplementary Fig S4). For a control oligonucleotide, we used a sequence corresponding to Escherichia coli LacZ which is absent from the mouse genome. Paupar probes showed strong enrichment (17-fold) of the Paupar transcript compared to the LacZ control (Fig4A), and did not enrich for negative control transcripts, Malat1, a nuclear lncRNA, or Gapdh mRNA. As expected from physical association of a nascent transcript with its site of synthesis, we observed specific enrichment of Paupar at its DNA locus (Supplementary Fig S4).
Figure 4.

- A Specific enrichment of Paupar RNA using oligonucleotides complementary to accessible regions of Paupar, as determined by RNase H mapping (see Supplementary Fig S4), compared to the LacZ control. Mean value ± s.e., n = 4.
- B Sequencing of Paupar-bound DNA (RNase H elution) reveals peaks of Paupar binding, including those at the promoter of E2f2, upstream of Sox2 and downstream of Hes1.
- C–E Peaks were called by comparing with sequences both from control CHART-seq experiments and from input DNA. Here we only consider the 2,849 peaks common to both comparisons (C, and Supplementary Table 4). Paupar peaks are broadly distributed across the mouse genome (D) but are particularly enriched in 5′ UTRs and gene promoters (E). Red arrowheads in (D) indicate the position of the Paupar locus. Asterisks in (E) indicate significance at 5% FDR (Benjamini-Hochberg).
- F The width distribution of Paupar binding peaks.
- G Representative categories from Gene Ontology analysis of genes associated with Paupar binding sites reveal enrichments for stem cell and neuronal categories amongst others (Supplementary Table 6).
Following the CHART-seq protocol, we used RNase H elution to recover genomic DNA associated with endogenous Paupar transcripts and genomic DNA associated with the control oligonucleotide, sequencing replicate samples using the Illumina HiSeq system. Using the paired-end peak caller MACS2 (Zhang et al, 2008), we identified Paupar binding sites in comparison both to DNA recovered using the control LacZ oligonucleotide and to input DNA from N2A cells. We discovered thousands of peaks across the genome, for example at the transcriptional start site (TSS) of E2f2, and at sites upstream of Sox2 and downstream of Hes1 (Fig4B) and defined Paupar binding sites as those peaks found in comparison to both input DNA and the control oligonucleotide samples (Fig4C). Paupar occupancy at nine candidate binding sites was validated using CHART-qPCR in two further independent experiments (Supplementary Fig S4).
These 2,849 candidate Paupar binding sites (Supplementary Table 4) are generally widely distributed across the genome, show a significant three-fold depletion on the X chromosome (P < 0.001 by genome-wide simulation accounting for mappability and GC biases (Heger et al (2013); Supplementary Table 5; Fig4D), and occur preferentially within the promoters and 5′ UTRs of protein-coding genes (Fig4E). Candidate Paupar binding sites range from narrower focal peaks of 200–1,000 bp, similar to those previously described for Hotair and Terc lncRNAs (Chu et al, 2011), to broader genomic regions of up to 9.5 kb (Fig4F).
We examined the sequence of the Paupar binding locations for clues as to its genomic targeting. Using a local alignment approach (see Materials and Methods), we did not find evidence for sequence complementarity between Paupar and its binding locations. However, de novo motif discovery (Supplementary Fig S5) identified a motif closely resembling a known PAX6 DNA binding motif in 9.2% of the top 500 scoring Paupar binding locations (Supplementary Fig S5C). Further analysis of Paupar CHART-Seq peaks for the presence of known vertebrate transcription factor motifs revealed enrichment of motifs for several neural transcription factors (Supplementary Table 7). Together, these results suggest that Paupar is not targeted to the genome through direct RNA-DNA interactions but that instead it interacts with PAX6 and other neural transcription factors to target specific genomic regions in a context-dependent manner.
Paupar binding sites are associated with genes and regulatory regions of known stem cell and neural function
Using Gene Ontology assignments (Ashburner et al, 2000), we next sought to characterise the set of genes associated with Paupar binding locations (Fig4G, Supplementary Table 6). This analysis revealed enriched stem cell categories with peaks associated with many key stem cell genes such as Sox2, Nanog, Hes1, Hes5, Rbpj and Lif. We also found Paupar peaks to be enriched for neuronal gene categories as well as in genes whose products are important for the epigenetic regulation of gene expression. Intriguingly, Paupar binding sites are also enriched in genes associated with insulin secretion, a process in which Pax6 has an established role (Gosmain et al, 2012).
To gain insight into the mechanism by which Paupar regulates gene expression, we examined its binding in relation to known functional regulatory regions. Firstly, we found that the majority of Paupar binding sites overlap DNase I hypersensitivity (HS) sites and cis-regulatory elements identified by the Mouse ENCODE Project (Shen et al, 2012; Fig5A, Supplementary Table 4). A large subset of binding sites are significantly associated with neuronal DNase I HS sites and a further subset are associated with DNase I HS sites found in embryonic stem cells (Fig5B and 5C). In agreement with the enrichment of Paupar binding sites at 5′ UTRs and promoters, we also observed a set of binding sites associated with features characteristic of transcriptional start sites including Pol II, predicted CpG islands, and tri-methylation of histone H3 at lysine 4 (H3K4me3; Fig5D). Additionally, we saw significant overlaps with Ctcf-binding regulatory elements and tissue-specific enhancers, defined using ratios of H3K4 mono- and tri-methylation (Shen et al, 2012).
Figure 5.
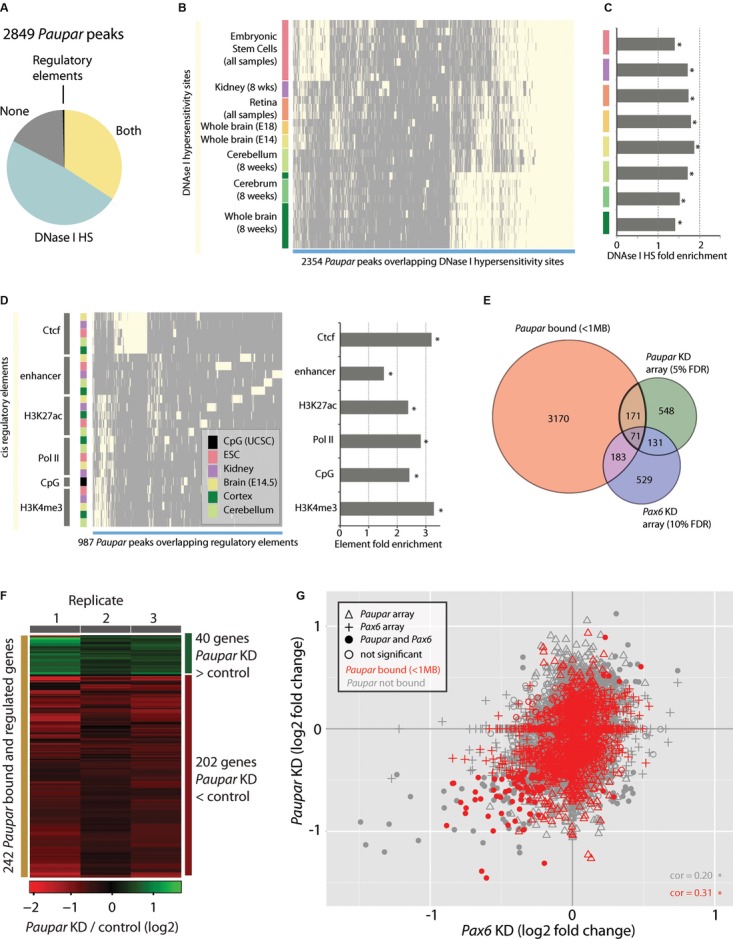
- The majority of Paupar binding sites overlap with DNase I HS sites and transcriptional regulatory elements as identified by the ENCODE project (selected tissues; Supplementary Table 5).
- Hierarchical clustering of HS sites intersecting Paupar binding sites (light yellow) reveals large clusters of HS sites identified in neural tissues and embryonic stem cells that are bound by Paupar in N2A cells.
- Fold enrichment of Paupar CHART-Seq-DNase I HS site associations.
- Hierarchical clustering of cis-regulatory elements and Paupar peaks show groups of Paupar peaks associated with promoter-like features (H3K4me3, Pol II binding, CpG island predictions), peaks associated with Ctcf and peaks associated with tissue-specific enhancer elements.
- The intersection of genes proximal (< 1 Mb) to Paupar peaks and genes changing expression upon Paupar (5% FDR) and Pax6 (10% FDR) knockdown.
- Heatmap displaying expression changes in the 242 Paupar bound and regulated genes from (E).
- Analysis of Paupar-associated genes and changes in expression from Paupar and Pax6 knockdown array experiments reveals a set of genes positively regulated by both Paupar and Pax6 and directly bound by Paupar (red circles, lower left). Correlations (cor) are significant at P < 2 × 10⁻¹⁶.
A subset of Paupar-regulated genes is also associated with Paupar binding
To investigate the functional consequences of Paupar binding we intersected the Paupar CHART-Seq peak-set with our microarray analysis of Paupar and Pax6-mediated gene expression changes. This identified 242 Paupar-bound and -regulated genes (5% FDR), representing likely direct transcriptional targets, and 254 Paupar-bound and Pax6-regulated genes (10% FDR; Fig5E). Hierarchical clustering of the 242 Paupar-bound and -regulated genes indicated that while Paupar predominantly activates the expression of target genes it can also function to repress certain loci (Fig5F). In accordance with this, genes associated with Paupar binding sites showed significantly higher expression in N2A cells than other genes (Supplementary Fig S6A, P < 2 × 10⁻¹⁶).
Notably, genes regulated by both Paupar and Pax6 showed a small but significant enrichment for associated Paupar binding sites (Supplementary Fig S6B). To dissect the relationship between gene expression changes in the Paupar and Pax6 knockdown experiments and the association of genes with Paupar binding further, we plotted these observations (Fig5G). First, we noted a moderate significant correlation (0.20, P < 2.2 × 10⁻¹⁶) between all genes tested for differential expression in the two knockdown experiments, and that this correlation was stronger for genes also associated with Paupar binding sites (0.31, P < 2.2 × 10⁻¹⁶). Secondly, we noted a distinct group of genes that are significantly positively regulated by both Paupar (5% FDR) and Pax6 (10% FDR) and associated with Paupar binding (red circles, lower left Fig5G). In line with the observed intersection between genes regulated by Paupar and Pax6 (Fig3), these findings suggest that Paupar and Pax6 co-operate to regulate a set of common target genes (red circles, Fig5G) and further that Paupar can act independently of Pax6 to directly regulate the expression of a separate set of genes (red triangles).
Paupar and PAX6 co-occupy specific genomic binding sites
The identification of 71 Paupar and Pax6 co-regulated genes that are also bound by Paupar in their regulatory regions (Fig5E) together with the discovery of the known PAX6 DNA binding motif from Paupar bound sequences (Supplementary Fig S5) suggested a functional interaction between PAX6 and Paupar. To investigate this, we first tested for a physical association between PAX6 protein and the Paupar transcript using UV cross-linking RNA immunoprecipitation (UV-RIP) in N2A cells and detected a fourfold enrichment of Paupar using an anti-PAX6 antibody compared to an isotype control (Fig6A). The Paupar-PAX6 interaction appears to be specific as we observed no enrichment of a negative control U1 snRNA transcript.
Figure 6.
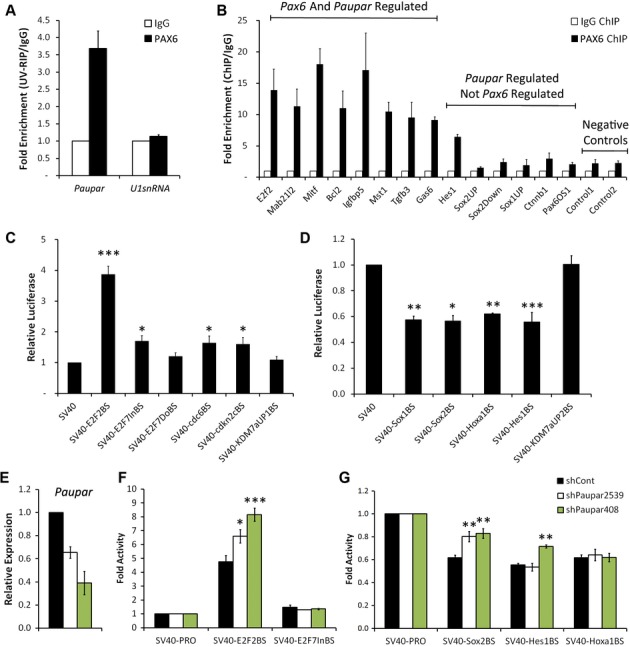
- A Paupar interacts with PAX6 protein in N2A cells. Nuclear extracts were prepared from UV cross-linked cells and immuno-precipitated using either anti-PAX6 or control IgG antibodies. Associated RNAs were purified and the levels of Paupar and control U1 snRNA detected in each UV-RIP using qRT-PCR. Results are expressed as fold enrichment relative to an isotype IgG control antibody.
- B PAX6 and Paupar co-occupy a specific set of genomic binding sites. ChIP assays were performed in N2A cells using either an antibody against PAX6 or an isotype-specific control. The indicated DNA fragments were amplified using qPCR. Fold enrichment was calculated as 2−ΔΔCt (IP/IgG).
- C, D Paupar binding sites act as transcriptional regulatory elements. N2A cells were transfected with the indicated reporter constructs in a luciferase assay. Luciferase activity was compared to that of the empty SV40 promoter construct.
- E–G Paupar transcript modulates the transcriptional activity of its binding sites in trans. Luciferase reporters were co-transfected into N2A cells together with either a non-targeting control or two independent Paupar targeting shRNA expression vectors. Paupar depletion was confirmed using qRT-PCR. For these reporter assays, a Renilla expression vector was used as a transfection control and the total amount of DNA transfected in each case was made equal. Data information: Results are presented as mean values ± s.e., n = 3 (A–D) or n = 4 (E–G); ***P < 0.001, **P < 0.01, *P < 0.05, one-tailed t-test, unequal variance.
We next measured PAX6 occupancy at a set of Paupar binding sites within the regulatory regions of genes whose expression changes in Paupar knockdown cells (Fig6B). Using chromatin immunoprecipitation (ChIP), we found a strong enrichment of PAX6 at Paupar binding sites within the regulatory regions of genes whose expression changes significantly upon both Pax6 and Paupar knockdown. By contrast, the majority of the assayed Paupar binding locations associated with genes that changed in expression upon Paupar but not Pax6 knockdown showed little enrichment for PAX6 (Fig6B).
Several lncRNAs titrate DNA binding transcription factors away from their genomic targets (Hung et al, 2011; Rapicavoli et al, 2013; Sun et al, 2013). We therefore examined PAX6 occupancy at a number of Paupar binding sites following Paupar knockdown and discovered that Paupar depletion does not significantly affect PAX6 chromatin occupancy at the regions tested (Supplementary Fig S7). In a similar manner, the androgen receptor (AR)-associated lncRNAs Prncr1 and Pcgem1 do not affect AR DNA binding but instead function to recruit transcriptional co-factors to DNA bound AR (Yang et al, 2013). Taken together, these findings indicate that PAX6 and Paupar specifically co-occupy a subset of Paupar binding sites associated with genes whose expression change upon Pax6 and Paupar knockdown, and that PAX6 protein plays a role in targeting Paupar to the genome.
Paupar modulates in trans the activity of transcriptional regulatory elements of neuro-developmental genes
We next tested whether Paupar CHART-Seq peaks function as transcriptional regulatory elements. To do this, we first selected 11 Paupar binding sites, ranging from 170 bp to 2.5 kb in length, located within the regulatory regions of genes controlling neural growth and differentiation (E2f2, E2f7 [2 peaks], Cdc6, Cdkn2c, Kdm7a [2 peaks], Sox1, Sox2, Hoxa1, Hes1) and cloned each upstream of a heterologous SV40 promoter in a pGL3 luciferase vector. All of these genes, except Sox2 whose expression is undetectable in N2A cells, showed evidence of being regulated by Paupar using microarray profiling. The transcriptional activity of these constructs was then compared to that of the SV40 promoter alone following transient transfection in N2A cells. One (E2f2BS) out of six focal peaks of < 600 bp in length strongly activated (3.9-fold) the SV40 promoter, a further three displayed a small, but significant (1.3–1.7-fold), increase in SV40 promoter activity (Fig6C), while four out of five broad peaks > 1 kbp (Fig6D) reproducibly repressed the SV40 promoter (1.6–1.8-fold). Consistent with the observed enrichment of Paupar CHART-Seq peaks at neuronal DNase I HS sites and cis-regulatory elements (Fig5) these results indicate that Paupar binding sites function in transcriptional control and can operate as both transcriptional enhancers and repressors.
Finally, we examined whether the Paupar transcript plays a trans-acting role in modulating the transcriptional response of its genomic binding sites. For this we chose to investigate the dependence on the Paupar transcript of the transcriptional activity of the strong E2f2 enhancer element as well as the weak E2f7 activating region and the repressor elements associated with the Sox2, Hes1 and Hoxa1 genes. To achieve this, reporters were co-transfected into N2A cells along with either a non-targeting control or two independent Paupar-targeting shRNA expression vectors in a luciferase assay. Strikingly, depletion of the endogenous Paupar transcript led to a dose-dependent increase in the enhancer activity of the SV40-E2f2BS reporter (Fig6E and F). In accordance with this, E2f2 displayed one of the greatest expression changes (1.9-fold up-regulation; Supplementary Table 2) in our transcriptome profiling of Paupar knockdown cells. The activity of the SV40-E2f7BS reporter was not altered by Paupar loss of function in this assay. Furthermore, Paupar depletion suppressed the ability of both the SV40-Sox2BS and SV40-Hes1BS reporters to function as transcriptional repressors, in a manner dependent on the levels of the Paupar transcript, while the repressive function of the SV40-Hoxa1BS reporter was not altered (Fig6G). These findings demonstrate a transcriptional regulatory function for the Paupar transcript at its genomic binding sites in trans and reveal that a lncRNA can function at transcriptional regulatory regions on different chromosomes distinct from its site of synthesis to control target gene expression.
Discussion
The extent by which lncRNAs contribute to genome function remains unclear. Here, we have used shRNA mediated knockdown, microarray profiling, genome-wide mapping and reporter assays to detail the RNA-dependent mode of action of Paupar, a chromatin-associated CNS expressed lncRNA transcript, in the regulation of gene transcription. Our findings that the Paupar transcript acts both locally, to regulate Pax6 expression, and distally in a transcript- and Pax6-dependent manner, reveal that lncRNAs can be functionally complex and will not always fall exclusively into cis- or trans-acting categories. Our data indicate that the Paupar transcriptional response is driven by at least three contributing components: downstream gene expression changes arising from Paupar regulation of Pax6 expression; Pax6- and Paupar-dependent trans-acting gene expression changes likely mediated through a physical interaction between Paupar and PAX6 protein at Paupar associated loci; and trans-acting Pax6-independent Paupar functions at many bound transcriptional regulatory regions genome-wide.
Consistent with a role for Paupar in regulating Pax6 expression, the Paupar locus has characteristics of a transcriptional enhancer. It spans both a previously defined Pax6 neuroretina specific enhancer conserved between human and quail (Plaza et al, 1999) and a known N2A cell DNase I HS site (McBride et al, 2011). Furthermore, ENCODE data indicate its locus to be marked by a high ratio of histone H3K4me1 compared to H3K4me3, with high levels of H3K27me3 and an absence of H3K27ac in the mouse E14.5 brain. Different classes of enhancer-associated cis-acting ncRNAs have been described to date. Enhancer RNAs (eRNAs) are relatively short polymerase II-transcribed, predominantly non-polyadenylated, bidirectional transcripts, first identified at neuronal enhancers (Kim et al, 2010) while enhancer-like lncRNAs are strand-specific, polyadenylated transcripts (De Santa et al, 2010; Orom et al, 2010) which in these respects are more similar to Paupar. The chromatin signature of the Paupar locus, along with the finding that Paupar regulates Pax6 expression, implies that Paupar may play an important role in nervous system development. Furthermore, the widespread effect on over 900 genes when Paupar transcript levels were reduced by 52% may be associated with the haploinsufficiency and dosage-sensitivity of Pax6 (Georgala et al, 2011).
We show that Paupar associates with approximately 2800 sites in the genome and, where tested, these regions operate as transcriptional regulatory elements whose activity can be modulated by Paupar transcript levels. Our data are consistent with a model in which Paupar is indirectly targeted to the genome through RNA-protein interactions with multiple different neural transcription factors including PAX6. In accordance with this, we discovered a motif resembling a known PAX6 DNA binding motif within approximately 9% of the 500 top-scoring Paupar bound sequences and showed that Paupar and PAX6 co-occupy specific genomic sites within the regulatory regions of genes whose expression change upon both Pax6 and Paupar knockdown. Furthermore, our data show that Paupar does not affect PAX6 chromatin occupancy and suggest that Paupar may regulate the association of PAX6 with its transcriptional cofactors to control target gene expression.
It is likely that other nuclear enriched lncRNAs operate in a similar manner to Paupar. The CTBP1-AS lncRNA has recently been demonstrated to possess cis- as well as trans-acting functions (Takayama et al, 2013) while Prncr1 and Pcgem1 have been shown to bind the AR and associate with androgen responsive enhancers genome-wide (Yang et al, 2013). Hotair and Terc occupy hundreds of short genomic regions of up to 1 kb in length across multiple chromosomes while Drosophila roX2 interacts with Chromosome Entry Sites on the X-chromosome (Chu et al, 2011; Simon et al, 2011), regions that can recruit the dosage compensation machinery when inserted into autosomes (Fagegaltier & Baker, 2004). Human Alu RNA, transcribed from short interspersed elements, binds polymerase II and therefore has the potential to function as a general transcriptional repressor (Mariner et al, 2008) while the lateral mesoderm specific lncRNA Fendrr interacts in vitro with Foxf1 promoter fragments in trans (Grote et al, 2013). We therefore propose that Paupar is a member of a class of nuclear enriched lncRNAs that can interact with multiple transcriptional enhancers and silencers to regulate gene expression in trans in a transcript-dependent manner.
LncRNAs that play important roles in the development and function of the nervous system may be dysregulated in neurological disorders. We have shown that Paupar loss of function disrupts the normal cell cycle profile of N2A neuroblastoma cells and induces neuronal differentiation. Furthermore, its transcript binds and modulates the activity of Sox2, Hes1 and E2f2 gene transcriptional regulatory elements in trans, in addition to regulating the expression of Paupar's adjacent Pax6 gene. Although the roles of Sox2 and Hes1 in neural progenitor cell maintenance and neurogenesis are well characterised (Pevny & Nicolis, 2010; Kageyama et al, 2008), the function of the E2f2 gene in neural lineages has been less well studied. We found that E2f2, and the related E2f7 and E2f8 genes, are up-regulated upon Paupar knockdown in our profiling experiments and that the Paupar transcript operates to restrict the activity of an E2f2 enhancer element. E2f2 functions as a pro-survival factor during retinal development (Chen et al, 2009) and is involved in maintaining the differentiated state of post-mitotic neurons in cells in culture (Persengiev et al, 2001). Furthermore, E2f2 over-expression promotes cell cycle arrest and inhibits S-phase progression in PC12 neurons (Persengiev et al, 2001). Up-regulation of E2f family members in Paupar knockdown N2A cells may thus contribute to the accumulation of cells in S and G2 phases of the cell cycle and the observed neural differentiation phenotype.
The mechanisms of action of a growing number of cis-acting lncRNAs have been studied and have revealed roles for both the RNA molecule and lncRNA transcription in regulating the expression of genomically neighbouring genes (Lai et al, 2013; Melo et al, 2013; Wang et al, 2011). By way of contrast, we have uncovered the mode of action of a lncRNA molecule that is able to regulate the expression of genomically local as well as distal genes and suggest that lncRNAs which modulate cellular functions via genome-wide targets may be more widespread than previously anticipated.
Materials and Methods
Plasmid construction
To generate shRNA expression plasmids we first used the Whitehead Institute siRNA selection program to design shRNAs targeting multiple regions of Paupar and Pax6. Selected sequences were filtered to eliminate off-target effects by performing a BLAST search of the NCBI RefSeq database and removing hits with >15 matched bases of the anti-sense strand. Double stranded DNA oligonucleotides containing sense-loop-antisense targeting sequences were then cloned downstream of the U6 promoter in pBS-U6-CMVeGFP (Sarker et al, 2005) by linker ligation. To generate the Paupar expression plasmid the full length Paupar transcript was PCR amplified as a XhoI fragment from mouse N2A cell cDNA and inserted into pCAGGS. Paupar CHART-Seq peak regions were PCR cloned from N2A genomic DNA and inserted upstream of the SV40 promoter in pGL3-Pro (Promega) to generate a panel of luciferase reporters to test for transcriptional regulatory activity. The sequences of all oligonucleotides used for cloning are shown in Supplementary Table 1.
Cell culture
N2A mouse neuroblastoma cells were grown in DMEM supplemented with 10% fetal bovine serum. E14 mouse ES cells were grown on 0.1% gelatin-coated dishes in DMEM supplemented with 15% fetal calf serum, Leukemia-Inhibitor factor, 1× non-essential amino acids, 2 mM l-glutamine, 50 mg/ml penicillin/streptomycin and 50 μM 2-mercaptoethanol. To induce neuronal differentiation ES cells were seeded onto gelatinised plates and grown in differentiation medium (DMEM supplemented with 10% fetal calf serum, 1× non-essential amino acids, 2 mM l-glutamine, 50 mg/ml penicillin/streptomycin, 50 μM 2-mercaptoethanol and 10−7 M all-trans retinoic acid).
Transcriptomic analysis
Total RNA was isolated using the Qiagen Mini RNeasy kit following the manufacturer's instructions and RNA integrity assessed on a BioAnalyzer (Agilent Technologies). 200 ng RNA was used to generate labelled sense single stranded DNA (ssDNA) for hybridization with the Ambion WT Expression Kit, the Affymetrix WT Terminal Labelling and Controls Kit and the Affymetrix Hybridization, Wash, and Stain Kit as described by the manufacturer. Sense ssDNA was fragmented and the distribution of fragment lengths was measured on a BioAnalyzer. Fragmented ssDNA was then labelled and hybridized to the Affymetrix GeneChip Mouse Gene 1.0 ST Array (Affymetrix). Chips were processed on an Affymetrix GeneChip Fluidics Station 450 and Scanner 3000. Affymetrix CEL files were analysed using the Limma, oligo, and genefilter R Bioconductor packages (Carvalho & Irizarry, 2010; Smyth, 2004). Arrays were RMA background corrected, quantile normalised and summary expression values calculated for Refseq and full length mRNAs. Genes changing upon Paupar knockdown were filtered to remove genes showing little variation in expression (variance cut off of 0.5), while for the Pax6 knockdown analysis, genes with consistently low expression were removed before the identification of significant changes. In each case, differential expression between three knockdown and three control samples (biological replicates) was tested using the Limma Ebayes algorithm. Gene Ontology analyses were performed using GOToolBox, and representative significantly enriched categories selected from a hypergeometric test with a Benjamini-Hochberg corrected P-value threshold of 0.05 (http://genome.crg.es/GOToolBox/).
CHART-seq and analysis
CHART Enrichment and RNase H Mapping experiments were performed as previously described (Simon, 2013). CHART extract was prepared from approximately 8 × 10⁷ N2A cells per pull down and hybridized with 810 pmol biotinylated oligonucleotide cocktail (Supplementary Table 1) overnight with rotation at room temperature. Complexes were captured using 250 μl MyOneC1 streptavidin beads (Invitrogen) overnight at room temperature with rotation. Bound material was extensively washed and eluted using RNase H (New England Biolabs) for 30 min at room temperature. Samples were treated with Proteinase K and cross-links were reversed. RNA was purified from 1/5 total sample volume using the Qiagen miRNeasy kit while DNA was purified from the remaining sample by Phenol:CHCl3:isoamyl extraction and ethanol precipitation. DNA was sheared to an average fragment size of 150–300 bp using a Bioruptor (Diagenode) and sequenced on an Illumina HiSeq.
CHART-seq was performed in replicate with two independent pull down samples and matched controls using non-targeting LacZ oligos. A single sample of input DNA from N2A cells was prepared and sequenced separately. 50 bp, paired-end reads were mapped to the mouse genome (mm9) using bowtie with the options ‘–m1 –v2 –best –strata –a’. For each Paupar sample, peaks were called against the matched LacZ control and against the N2A input sample. Peak calls were made using the MACS2 algorithm (Zhang et al, 2008; https://github.com/taoliu/MACS/blob/master/README) with the options ‘–mfold 10 30 –gsize=2.39e9 –qvalue=0.01’ using the CGAT pipeline ‘pipeline_mapping.py’ (https://github.com/CGATOxford/cgat). Peak calls were then filtered such that only peak calls with a −log10 q value > 5 were retained (FDR 0.001%).
Characterisation of Paupar binding sites
The chromosomal distribution of Paupar peaks was visualised using the R Bioconductor package ‘ggbio’ (Yin et al, 2012). Genome territory enrichments were identified using the Genome Association Tester (GAT; Heger et al, 2013), using a mappability filtered workspace, an isochore file partitioning the genome into 8 bins based on regional GC content and 10,000 simulations. Chromosomal enrichments were analysed by proportionally assigning chromosomal territories to a single virtual meta-chromosome before using GAT to test for GC and mappability corrected enrichments as before. Peak shapes were visualised using read count normalised (MACS2–SPMR), background subtracted (MACS2–bdgcmp) coverage tracks from which regions covering peaks were extracted and centred based on the location of the peak maximum. Gene ontology categories enriched for Paupar binding were identified by intersecting regulatory regions for known coding genes with Paupar binding sites. Regulatory regions for genes were defined as a basal domain surrounding the TSS of −5 kb to +1 kb plus an extended domain of upstream and downstream to the nearest gene's basal domain or to a maximum distance of 1 Mb, following the GREAT definition (McLean et al, 2010). Enrichments were identified with GAT using the regulatory regions of all genes as the workspace, and 10,000 simulations. Because we noted some correspondence between Paupar binding and gene expression level, we supplied GAT with a file stratifying the workspace into six bins based on gene expression level in N2A cells under the ‘–isochore’ option to conservatively avoid associations solely due to expression level.
Paupar peaks were characterised using DNase I hypersensitivity sites identified by the Stamatoyannopoulos lab at the University of Washington and regulatory elements identified by the Ren lab at the Ludwig Institute for Cancer Research (ENCODE Project Consortium, 2011). Enrichments of DNase I HS and regulatory elements overlapping Paupar peaks were assessed using GAT to control for mappability and regional GC content as before.
Complementarity of Paupar sequence and binding locations was assessed using the EMBOSS Water algorithm (Rice et al, 2000) to perform Smith-Waterman alignment with a range of gap opening and extension penalties. De novo motif discovery was performed using the MEME-ChIP (Machanick & Bailey, 2011) algorithm to examine the unmasked DNA sequence of the central regions of top scoring (MACS2 peak score) peak locations. MEME-ChIP was run with the options ‘-meme-mod zoops -meme-minw 5 -meme-maxw 30—meme-nmotifs 50’ using a custom background file prepared from regions flanking the peak locations using the command ‘fasta-get-markov -m 2’. Enrichment of known vertebrate transcription factor binding sites from the TRANSFAC Professional database (Matys et al, 2006) was assessed using the AME algorithm (McLeay & Bailey, 2010) with the options ‘–method fisher –length-correct’ using the sequence and background file prepared for MEME-ChIP analysis.
Paupar knockdown and flow cytometry
Approximately 2 × 10⁵ cells were plated per well in a six well plate. 16–24 h later cells were transfected with 1.5 μg shRNA expression construct using FuGENE 6 (Promega) according to the manufacturer's instructions. Total RNA was extracted from the cells 2–3 days later using the Qiagen Mini RNeasy kit according to the manufacturer's instructions. For stable transfections, N2A cells were co-transfected with a 5:1 ratio of pBSU6-sh408 expression vector and pTK-Hyg (Clontech). Three days after transfection 200 μg/ml Hygromycin B was added to the cells and individual drug resistant clones were isolated and expanded under selection conditions. Individual clones were characterized for Paupar expression using qRT-PCR. For flow cytometry, cells were harvested by trypsinization, washed twice with PBS and fixed as a single cell suspension in −20°C filtered 70% ethanol. After incubation at 4°C for 10 min cells were pelleted, treated with 40 μg/ml RNase A and propidium iodide (40 μg/ml) for 30 min at room temperature and then analysed using a FACSCalibur (BD Biosciences) flow cytometer.
qRT-PCR and RACE
The QuantiTect Reverse Transcription Kit (Qiagen) was used for reverse transcription and followed by SYBR Green quantitative PCR using a Step One Plus Real-Time PCR System (Applied Biosystems). RACE was performed using the GeneRacer Kit (Invitrogen) following the manufacturer's instructions. Human foetal brain RNA was obtained from Promega. Primers are shown in Supplementary Table 1.
Cell fractionation
Approximately 2.5 × 10⁶ cells were pelleted, washed with PBS, resuspended in 250 μl Lysis Buffer (15 mM HEPES pH7.5, 10 mM KCl, 5 mM MgCl2, 0.1 mM EDTA, 0.5 mM EGTA, 250 mM Sucrose, 0.4% Igepal, 1 mM DTT, 40 U/ml RNaseOUT (Invitrogen), protease inhibitor cocktail [Roche]) and incubated on ice for 20 min. Nuclei were centrifuged at 2,000 g for 10 min at 4°C and the supernatant was collected as the cytoplasmic fraction. Nuclei were then resuspended in 50 μl Nuclei Lysis Buffer (10 mM HEPES pH7.5, 0.1 mM EDTA, 0.1 mM EGTA, 1 mM DTT, 40 U/ml RNaseOUT (Invitrogen), protease inhibitor cocktail [Roche]) and incubated on ice for 5 min. Nuclei were pelleted at 17,000 g for 5 min at 4°C and the supernatant was removed as the nucleoplasm fraction. The pellet was then resuspended in 50 μl Salt Extraction Buffer (25 mM HEPES pH7.5, 10% glycerol, 420 mM NaCL, 5 mM MgCl2, 0.1 mM EDTA, 1 mM DTT, 40 U/ml RNaseOUT (Invitrogen), protease inhibitor cocktail [Roche]) and incubated for 30 min at 4°C with rotation. The sample was then centrifuged at 17,000 g for 20 min at 4°C. The supernatant was collected as the salt extracted fraction and the pellet resuspended in 50 μl Salt Extraction Buffer to generate the chromatin fraction. RNA was isolated from each fraction using the Qiagen Mini RNeasy kit following the manufacturer's instructions.
UV-RIP
UV-RIP was performed as described in (Zhao et al, 2010) with minor modifications. Approximately 1 × 10⁷ N2A cells per UV-RIP were UV crosslinked in ice-cold PBS at 254 nm, 120 mjoules/cm2 using a Stratalinker (Stratagene). Nuclei were isolated, disrupted by sonication (three cycles, 30 sec ON/OFF) using a Bioruptor (Diagenode) and treated with 20 μl Turbo DNase (Ambion) before overnight incubation with either anti-rabbit PAX6 (AB2237) or rabbit IgG (both Millipore) polyclonal antibodies. Complexes were captured using Protein-A magnetic beads (Pierce), washed using low- and high-stringency buffers and then treated with RNA grade Proteinase K (Invitrogen). RNA was extracted using Trizol (Invitrogen) and analysed by qRT-PCR.
ChIP
ChIP was performed using approximately 1 × 10⁷ N2A cells per assay. Cells were trypsinized, resuspended in 10 ml PBS containing 1% final concentration formaldehyde and incubated for 10 min at room temperature with rotation. Cross-linking reactions were quenched with 0.125 M glycine for 5 min at room temperature and washed twice with ice-cold PBS. Nuclei were then isolated and chromatin was sheared to approximately 500 bp using a Bioruptor (Diagenode). Cross-linked chromatin was immunoprecipitated using 5 μg anti-rabbit PAX6 or anti-rabbit IgG control antibodies (both Millipore) overnight at 4°C. Complexes were collected using Protein-A magnetic beads (Pierce) pre-blocked with BSA (New England Biolabs) and transfer RNA (Roche), then washed and eluted. Cross-links were reversed at 65°C overnight and DNA was precipitated, treated with Proteinase K (Roche) and then purified using a PCR Purification Kit (Qiagen).
Luciferase assays
Approximately 5 × 10⁴ N2A cells were seeded per well in a 12-well plate. On the next day, cells were transfected with the indicated ratios of reporter constructs and expression vectors using FuGENE 6 (Promega) according to the manufacturer's instructions. The pRL-tk plasmid (Promega) was co-transfected into each well to normalize for transfection efficiency. The total amount of DNA was made up to 1 μg for each transfection by the addition of empty expression vector. Forty-eight hours after transfection lysates were prepared and assayed for firefly and renilla luciferase activity.
Data deposition
Microarray and CHART-Seq data have been deposited in the GEO database under accession number GSE52571 (http://www.ncbi.nlm.nih.gov/geo/query/acc.cgi?acc=GSE52571).
Acknowledgments
We thank Drs Andrew Bassett, Ana Marques and Wilfried Haerty for critical reading of the manuscript and Dr Matthew Simon (Yale University) for his invaluable help and advice in establishing the CHART protocol. We thank the High-Throughput Genomics Group at the Wellcome Trust Centre for Human Genetics for the generation of the sequencing data and OXION for use of their microarray facility. We also thank Dr Ana Marques for the non-targeting control shRNA expression vector, Dr Shirin Bonni (University of Calgary) for the pBS-U6-CMVeGFP plasmid and Prof Veronica van Heyningen, Dr Dirk-Jan Kleinjan and Shipra Bhatia (University of Edinburgh) for helpful discussions. This project has been funded by the European Research Council (Project Reference 249869, DARCGENs; KWV, VC, LK), the Medical Research Council (CPP, SNS; and MRC Hub Grant G0900747 91070 for Sequencing) and the Wellcome Trust (Grant Reference 090532/Z/09/Z for Sequencing).
Author contributions
KWV and CPP conceived the study. KWV designed experiments with input from SNS. KWV, SNS and CPP interpreted data and wrote the manuscript. KWV, SL, VC and PLO performed experiments. SNS performed computational analysis of expression and CHART-seq data with input from KWV. LK conducted EST profiling. SEC provided reagents.
Conflict of interest
The authors declare that they have no conflict of interest.
Supporting Information
Supplementary Figure S1
Supplementary Figure S2
Supplementary Figure S3
Supplementary Figure S4
Supplementary Figure S5
Supplementary Figure S6
Supplementary Figure S7
Supplementary Table S1
Supplementary Table S2
Supplementary Table S3
Supplementary Table S4
Supplementary Table S5
Supplementary Table S6
Supplementary Table S7
Review Process File
References
- Alfano G, Vitiello C, Caccioppoli C, Caramico T, Carola A, Szego MJ, McInnes RR, Auricchio A, Banfi S. Natural antisense transcripts associated with genes involved in eye development. Hum Mol Genet. 2005;14:913–923. doi: 10.1093/hmg/ddi084. [DOI] [PubMed] [Google Scholar]
- Aota S, Nakajima N, Sakamoto R, Watanabe S, Ibaraki N, Okazaki K. Pax6 autoregulation mediated by direct interaction of Pax6 protein with the head surface ectoderm-specific enhancer of the mouse Pax6 gene. Dev Biol. 2003;257:1–13. doi: 10.1016/s0012-1606(03)00058-7. [DOI] [PubMed] [Google Scholar]
- Ashburner M, Ball CA, Blake JA, Botstein D, Butler H, Cherry JM, Davis AP, Dolinski K, Dwight SS, Eppig JT, Harris MA, Hill DP, Issel-Tarver L, Kasarskis A, Lewis S, Matese JC, Richardson JE, Ringwald M, Rubin GM, Sherlock G. Gene ontology: tool for the unification of biology. The Gene Ontology Consortium. Nat Genet. 2000;25:25–29. doi: 10.1038/75556. [DOI] [PMC free article] [PubMed] [Google Scholar]
- Cabili MN, Trapnell C, Goff L, Koziol M, Tazon-Vega B, Regev A, Rinn JL. Integrative annotation of human large intergenic noncoding RNAs reveals global properties and specific subclasses. Genes Dev. 2011;25:1915–1927. doi: 10.1101/gad.17446611. [DOI] [PMC free article] [PubMed] [Google Scholar]
- Carvalho BS, Irizarry RA. A framework for oligonucleotide microarray preprocessing. Bioinformatics. 2010;26:2363–2367. doi: 10.1093/bioinformatics/btq431. [DOI] [PMC free article] [PubMed] [Google Scholar]
- Chen D, Pacal M, Wenzel P, Knoepfler PS, Leone G, Bremner R. Division and apoptosis of E2f-deficient retinal progenitors. Nature. 2009;462:925–929. doi: 10.1038/nature08544. [DOI] [PMC free article] [PubMed] [Google Scholar]
- Chu C, Qu K, Zhong FL, Artandi SE, Chang HY. Genomic maps of long noncoding RNA occupancy reveal principles of RNA-chromatin interactions. Mol Cell. 2011;44:667–678. doi: 10.1016/j.molcel.2011.08.027. [DOI] [PMC free article] [PubMed] [Google Scholar]
- De Santa F, Barozzi I, Mietton F, Ghisletti S, Polletti S, Tusi BK, Muller H, Ragoussis J, Wei CL, Natoli G. A large fraction of extragenic RNA pol II transcription sites overlap enhancers. PLoS Biol. 2010;8:e1000384. doi: 10.1371/journal.pbio.1000384. [DOI] [PMC free article] [PubMed] [Google Scholar]
- ENCODE Project Consortium. A user's guide to the encyclopedia of DNA elements (ENCODE) PLoS Biol. 2011;9:e1001046. doi: 10.1371/journal.pbio.1001046. [DOI] [PMC free article] [PubMed] [Google Scholar]
- ENCODE Project Consortium. An integrated encyclopedia of DNA elements in the human genome. Nature. 2012;489:57–74. doi: 10.1038/nature11247. [DOI] [PMC free article] [PubMed] [Google Scholar]
- Fagegaltier D, Baker BS. X chromosome sites autonomously recruit the dosage compensation complex in Drosophila males. PLoS Biol. 2004;2:e341. doi: 10.1371/journal.pbio.0020341. [DOI] [PMC free article] [PubMed] [Google Scholar]
- Feng J, Bi C, Clark BS, Mady R, Shah P, Kohtz JD. The Evf-2 noncoding RNA is transcribed from the Dlx-5/6 ultraconserved region and functions as a Dlx-2 transcriptional coactivator. Genes Dev. 2006;20:1470–1484. doi: 10.1101/gad.1416106. [DOI] [PMC free article] [PubMed] [Google Scholar]
- Georgala PA, Carr CB, Price DJ. The role of Pax6 in forebrain development. Dev Neurobiol. 2011;71:690–709. doi: 10.1002/dneu.20895. [DOI] [PubMed] [Google Scholar]
- Gosmain Y, Katz LS, Masson MH, Cheyssac C, Poisson C, Philippe J. Pax6 is crucial for beta-cell function, insulin biosynthesis, and glucose-induced insulin secretion. Mol Endocrinol. 2012;26:696–709. doi: 10.1210/me.2011-1256. [DOI] [PMC free article] [PubMed] [Google Scholar]
- Grote P, Wittler L, Hendrix D, Koch F, Wahrisch S, Beisaw A, Macura K, Blass G, Kellis M, Werber M, Herrmann BG. The tissue-specific lncRNA Fendrr is an essential regulator of heart and body wall development in the mouse. Dev Cell. 2013;24:206–214. doi: 10.1016/j.devcel.2012.12.012. [DOI] [PMC free article] [PubMed] [Google Scholar]
- Guttman M, Donaghey J, Carey BW, Garber M, Grenier JK, Munson G, Young G, Lucas AB, Ach R, Bruhn L, Yang X, Amit I, Meissner A, Regev A, Rinn JL, Root DE, Lander ES. lincRNAs act in the circuitry controlling pluripotency and differentiation. Nature. 2011;477:295–300. doi: 10.1038/nature10398. [DOI] [PMC free article] [PubMed] [Google Scholar]
- Heger A, Webber C, Goodson M, Ponting CP, Lunter G. GAT: a simulation framework for testing the association of genomic intervals. Bioinformatics. 2013;29:2046–2048. doi: 10.1093/bioinformatics/btt343. [DOI] [PMC free article] [PubMed] [Google Scholar]
- Hill RE, Favor J, Hogan BL, Ton CC, Saunders GF, Hanson IM, Prosser J, Jordan T, Hastie ND, van Heyningen V. Mouse small eye results from mutations in a paired-like homeobox-containing gene. Nature. 1991;354:522–525. doi: 10.1038/354522a0. [DOI] [PubMed] [Google Scholar]
- Hingorani M, Hanson I, van Heyningen V. Aniridia. Eur J Hum Genet. 2012;20:1011–1017. doi: 10.1038/ejhg.2012.100. [DOI] [PMC free article] [PubMed] [Google Scholar]
- Hsieh YW, Yang XJ. Dynamic Pax6 expression during the neurogenic cell cycle influences proliferation and cell fate choices of retinal progenitors. Neural Dev. 2009;4:32. doi: 10.1186/1749-8104-4-32. [DOI] [PMC free article] [PubMed] [Google Scholar]
- Huarte M, Guttman M, Feldser D, Garber M, Koziol MJ, Kenzelmann-Broz D, Khalil AM, Zuk O, Amit I, Rabani M, Attardi LD, Regev A, Lander ES, Jacks T, Rinn JL. A large intergenic noncoding RNA induced by p53 mediates global gene repression in the p53 response. Cell. 2010;142:409–419. doi: 10.1016/j.cell.2010.06.040. [DOI] [PMC free article] [PubMed] [Google Scholar]
- Hung T, Wang Y, Lin MF, Koegel AK, Kotake Y, Grant GD, Horlings HM, Shah N, Umbricht C, Wang P, Kong B, Langerod A, Borresen-Dale AL, Kim SK, van de Vijver M, Sukumar S, Whitfield ML, Kellis M, Xiong Y, Wong DJ, et al. Extensive and coordinated transcription of noncoding RNAs within cell-cycle promoters. Nat Genet. 2011;43:621–629. doi: 10.1038/ng.848. [DOI] [PMC free article] [PubMed] [Google Scholar]
- Kageyama R, Ohtsuka T, Kobayashi T. Roles of Hes genes in neural development. Dev Growth Differ. 2008;50(Suppl. 1):S97–S103. doi: 10.1111/j.1440-169X.2008.00993.x. [DOI] [PubMed] [Google Scholar]
- Kim TK, Hemberg M, Gray JM, Costa AM, Bear DM, Wu J, Harmin DA, Laptewicz M, Barbara-Haley K, Kuersten S, Markenscoff-Papadimitriou E, Kuhl D, Bito H, Worley PF, Kreiman G, Greenberg ME. Widespread transcription at neuronal activity-regulated enhancers. Nature. 2010;465:182–187. doi: 10.1038/nature09033. [DOI] [PMC free article] [PubMed] [Google Scholar]
- Lai F, Orom UA, Cesaroni M, Beringer M, Taatjes DJ, Blobel GA, Shiekhattar R. Activating RNAs associate with Mediator to enhance chromatin architecture and transcription. Nature. 2013;494:497–501. doi: 10.1038/nature11884. [DOI] [PMC free article] [PubMed] [Google Scholar]
- Machanick P, Bailey TL. MEME-ChIP: motif analysis of large DNA datasets. Bioinformatics. 2011;27:1696–1697. doi: 10.1093/bioinformatics/btr189. [DOI] [PMC free article] [PubMed] [Google Scholar]
- Manuel M, Georgala PA, Carr CB, Chanas S, Kleinjan DA, Martynoga B, Mason JO, Molinek M, Pinson J, Pratt T, Quinn JC, Simpson TI, Tyas DA, van Heyningen V, West JD, Price DJ. Controlled overexpression of Pax6 in vivo negatively autoregulates the Pax6 locus, causing cell-autonomous defects of late cortical progenitor proliferation with little effect on cortical arealization. Development. 2007;134:545–555. doi: 10.1242/dev.02764. [DOI] [PMC free article] [PubMed] [Google Scholar]
- Mariner PD, Walters RD, Espinoza CA, Drullinger LF, Wagner SD, Kugel JF, Goodrich JA. Human Alu RNA is a modular transacting repressor of mRNA transcription during heat shock. Mol Cell. 2008;29:499–509. doi: 10.1016/j.molcel.2007.12.013. [DOI] [PubMed] [Google Scholar]
- Marques AC, Ponting CP. Catalogues of mammalian long noncoding RNAs: modest conservation and incompleteness. Genome Biol. 2009;10:R124. doi: 10.1186/gb-2009-10-11-r124. [DOI] [PMC free article] [PubMed] [Google Scholar]
- Matys V, Kel-Margoulis OV, Fricke E, Liebich I, Land S, Barre-Dirrie A, Reuter I, Chekmenev D, Krull M, Hornischer K, Voss N, Stegmaier P, Lewicki-Potapov B, Saxel H, Kel AE, Wingender E. TRANSFAC and its module TRANSCompel: transcriptional gene regulation in eukaryotes. Nucleic Acids Res. 2006;34:D108–D110. doi: 10.1093/nar/gkj143. [DOI] [PMC free article] [PubMed] [Google Scholar]
- McBride DJ, Buckle A, van Heyningen V, Kleinjan DA. DNaseI hypersensitivity and ultraconservation reveal novel, interdependent long-range enhancers at the complex Pax6 cis-regulatory region. PLoS One. 2011;6:e28616. doi: 10.1371/journal.pone.0028616. [DOI] [PMC free article] [PubMed] [Google Scholar]
- McLean CY, Bristor D, Hiller M, Clarke SL, Schaar BT, Lowe CB, Wenger AM, Bejerano G. GREAT improves functional interpretation of cis-regulatory regions. Nat Biotechnol. 2010;28:495–501. doi: 10.1038/nbt.1630. [DOI] [PMC free article] [PubMed] [Google Scholar]
- McLeay RC, Bailey TL. Motif Enrichment Analysis: a unified framework and an evaluation on ChIP data. BMC Bioinformatics. 2010;11:165. doi: 10.1186/1471-2105-11-165. [DOI] [PMC free article] [PubMed] [Google Scholar]
- Melo CA, Drost J, Wijchers PJ, van de Werken H, de Wit E, Oude Vrielink JA, Elkon R, Melo SA, Leveille N, Kalluri R, de Laat W, Agami R. eRNAs are required for p53-dependent enhancer activity and gene transcription. Mol Cell. 2013;49:524–535. doi: 10.1016/j.molcel.2012.11.021. [DOI] [PubMed] [Google Scholar]
- Orom UA, Derrien T, Beringer M, Gumireddy K, Gardini A, Bussotti G, Lai F, Zytnicki M, Notredame C, Huang Q, Guigo R, Shiekhattar R. Long noncoding RNAs with enhancer-like function in human cells. Cell. 2010;143:46–58. doi: 10.1016/j.cell.2010.09.001. [DOI] [PMC free article] [PubMed] [Google Scholar]
- Persengiev SP, Li J, Poulin ML, Kilpatrick DL. E2F2 converts reversibly differentiated PC12 cells to an irreversible, neurotrophin-dependent state. Oncogene. 2001;20:5124–5131. doi: 10.1038/sj.onc.1204663. [DOI] [PubMed] [Google Scholar]
- Pevny LH, Nicolis SK. Sox2 roles in neural stem cells. Int J Biochem Cell Biol. 2010;42:421–424. doi: 10.1016/j.biocel.2009.08.018. [DOI] [PubMed] [Google Scholar]
- Plaza S, Saule S, Dozier C. High conservation of cis-regulatory elements between quail and human for the Pax-6 gene. Dev Genes Evol. 1999;209:165–173. doi: 10.1007/s004270050240. [DOI] [PubMed] [Google Scholar]
- Ponjavic J, Oliver PL, Lunter G, Ponting CP. Genomic and transcriptional co-localization of protein-coding and long non-coding RNA pairs in the developing brain. PLoS Genet. 2009;5:e1000617. doi: 10.1371/journal.pgen.1000617. [DOI] [PMC free article] [PubMed] [Google Scholar]
- Ponjavic J, Ponting CP, Lunter G. Functionality or transcriptional noise? Evidence for selection within long noncoding RNAs. Genome Res. 2007;17:556–565. doi: 10.1101/gr.6036807. [DOI] [PMC free article] [PubMed] [Google Scholar]
- Rapicavoli NA, Qu K, Zhang J, Mikhail M, Laberge RM, Chang HY. A mammalian pseudogene lncRNA at the interface of inflammation and anti-inflammatory therapeutics. Elife. 2013;2:e00762. doi: 10.7554/eLife.00762. [DOI] [PMC free article] [PubMed] [Google Scholar]
- Rice P, Longden I, Bleasby A. EMBOSS: the European molecular biology open software suite. Trends Genet. 2000;16:276–277. doi: 10.1016/s0168-9525(00)02024-2. [DOI] [PubMed] [Google Scholar]
- Rinn JL, Kertesz M, Wang JK, Squazzo SL, Xu X, Brugmann SA, Goodnough LH, Helms JA, Farnham PJ, Segal E, Chang HY. Functional demarcation of active and silent chromatin domains in human HOX loci by noncoding RNAs. Cell. 2007;129:1311–1323. doi: 10.1016/j.cell.2007.05.022. [DOI] [PMC free article] [PubMed] [Google Scholar]
- Sansom SN, Griffiths DS, Faedo A, Kleinjan DJ, Ruan Y, Smith J, van Heyningen V, Rubenstein JL, Livesey FJ. The level of the transcription factor Pax6 is essential for controlling the balance between neural stem cell self-renewal and neurogenesis. PLoS Genet. 2009;5:e1000511. doi: 10.1371/journal.pgen.1000511. [DOI] [PMC free article] [PubMed] [Google Scholar]
- Sarker KP, Wilson SM, Bonni S. SnoN is a cell type-specific mediator of transforming growth factor-beta responses. J Biol Chem. 2005;280:13037–13046. doi: 10.1074/jbc.M409367200. [DOI] [PubMed] [Google Scholar]
- Shaham O, Menuchin Y, Farhy C, Ashery-Padan R. Pax6: a multi-level regulator of ocular development. Prog Retin Eye Res. 2012;31:351–376. doi: 10.1016/j.preteyeres.2012.04.002. [DOI] [PubMed] [Google Scholar]
- Shen Y, Yue F, McCleary DF, Ye Z, Edsall L, Kuan S, Wagner U, Dixon J, Lee L, Lobanenkov VV, Ren B. A map of the cis-regulatory sequences in the mouse genome. Nature. 2012;488:116–120. doi: 10.1038/nature11243. [DOI] [PMC free article] [PubMed] [Google Scholar]
- Simon MD. Capture hybridization analysis of RNA targets (CHART) Curr Protoc Mol Biol. 2013;Chapter 21:Unit 21–Unit 25. doi: 10.1002/0471142727.mb2125s101. [DOI] [PubMed] [Google Scholar]
- Simon MD, Wang CI, Kharchenko PV, West JA, Chapman BA, Alekseyenko AA, Borowsky ML, Kuroda MI, Kingston RE. The genomic binding sites of a noncoding RNA. Proc Natl Acad Sci USA. 2011;108:20497–20502. doi: 10.1073/pnas.1113536108. [DOI] [PMC free article] [PubMed] [Google Scholar]
- Smyth GK. Linear models and empirical bayes methods for assessing differential expression in microarray experiments. Stat Appl Genet Mol Biol. 2004;3:Article3. doi: 10.2202/1544-6115.1027. [DOI] [PubMed] [Google Scholar]
- Sun S, Del Rosario BC, Szanto A, Ogawa Y, Jeon Y, Lee JT. Jpx RNA activates Xist by evicting CTCF. Cell. 2013;153:1537–1551. doi: 10.1016/j.cell.2013.05.028. [DOI] [PMC free article] [PubMed] [Google Scholar]
- Takayama KI, Horie-Inoue K, Katayama S, Suzuki T, Tsutsumi S, Ikeda K, Urano T, Fujimura T, Takagi K, Takahashi S, Homma Y, Ouchi Y, Aburatani H, Hayashizaki Y, Inoue S. Androgen-responsive long noncoding RNA CTBP1-AS promotes prostate cancer. EMBO J. 2013;32:1665–1680. doi: 10.1038/emboj.2013.99. [DOI] [PMC free article] [PubMed] [Google Scholar]
- Ulitsky I, Shkumatava A, Jan CH, Sive H, Bartel DP. Conserved function of lincRNAs in vertebrate embryonic development despite rapid sequence evolution. Cell. 2011;147:1537–1550. doi: 10.1016/j.cell.2011.11.055. [DOI] [PMC free article] [PubMed] [Google Scholar]
- Wang KC, Yang YW, Liu B, Sanyal A, Corces-Zimmerman R, Chen Y, Lajoie BR, Protacio A, Flynn RA, Gupta RA, Wysocka J, Lei M, Dekker J, Helms JA, Chang HY. A long noncoding RNA maintains active chromatin to coordinate homeotic gene expression. Nature. 2011;472:120–124. doi: 10.1038/nature09819. [DOI] [PMC free article] [PubMed] [Google Scholar]
- Yang L, Lin C, Jin C, Yang JC, Tanasa B, Li W, Merkurjev D, Ohgi KA, Meng D, Zhang J, Evans CP, Rosenfeld MG. lncRNA-dependent mechanisms of androgen-receptor-regulated gene activation programs. Nature. 2013;500:598–602. doi: 10.1038/nature12451. [DOI] [PMC free article] [PubMed] [Google Scholar]
- Yin T, Cook D, Lawrence M. ggbio: an R package for extending the grammar of graphics for genomic data. Genome Biol. 2012;13:R77. doi: 10.1186/gb-2012-13-8-r77. [DOI] [PMC free article] [PubMed] [Google Scholar]
- Zhang Y, Liu T, Meyer CA, Eeckhoute J, Johnson DS, Bernstein BE, Nusbaum C, Myers RM, Brown M, Li W, Liu XS. Model-based analysis of ChIP-Seq (MACS) Genome Biol. 2008;9:R137. doi: 10.1186/gb-2008-9-9-r137. [DOI] [PMC free article] [PubMed] [Google Scholar]
- Zhao J, Ohsumi TK, Kung JT, Ogawa Y, Grau DJ, Sarma K, Song JJ, Kingston RE, Borowsky M, Lee JT. Genome-wide identification of polycomb-associated RNAs by RIP-seq. Mol Cell. 2010;40:939–953. doi: 10.1016/j.molcel.2010.12.011. [DOI] [PMC free article] [PubMed] [Google Scholar]
Associated Data
This section collects any data citations, data availability statements, or supplementary materials included in this article.
Supplementary Materials
Supplementary Figure S1
Supplementary Figure S2
Supplementary Figure S3
Supplementary Figure S4
Supplementary Figure S5
Supplementary Figure S6
Supplementary Figure S7
Supplementary Table S1
Supplementary Table S2
Supplementary Table S3
Supplementary Table S4
Supplementary Table S5
Supplementary Table S6
Supplementary Table S7
Review Process File