

Abstract
Acetylcholine is a neuromodulatory transmitter that controls synaptic plasticity and sensory processing in many brain regions. The dorsal cochlear nucleus (DCN) is an auditory brainstem nucleus that integrates auditory signals from the cochlea with multisensory inputs from several brainstem nuclei and receives prominent cholinergic projections. In the auditory periphery, cholinergic modulation serves a neuroprotective function, reducing cochlear output under high sound levels. However, the role of cholinergic signaling in the DCN is less understood. Here we examine postsynaptic mechanisms of cholinergic modulation at glutamatergic synapses formed by parallel fiber axons onto cartwheel cells (CWCs) in the apical DCN circuit from mouse brainstem slice using calcium (Ca) imaging combined with two-photon laser glutamate uncaging onto CWC spines. Activation of muscarinic acetylcholine receptors (mAChRs) significantly increased the amplitude of both uncaging-evoked EPSPs (uEPSPs) and spine Ca transients. Our results demonstrate that mAChRs in CWC spines act by suppressing large-conductance calcium-activated potassium (BK) channels, and this effect is mediated through the cAMP/protein kinase A signaling pathway. Blocking BK channels relieves voltage-dependent magnesium block of NMDA receptors, thereby enhancing uEPSPs and spine Ca transients. Finally, we demonstrate that mAChR activation inhibits L-type Ca channels and thus may contribute to the suppression of BK channels by mAChRs. In summary, we demonstrate a novel role for BK channels in regulating glutamatergic transmission and show that this mechanism is under modulatory control of mAChRs.
Introduction
The dorsal cochlear nucleus (DCN) is the initial site in which signals from the auditory nerve are integrated with proprioceptive and descending auditory projections in the central auditory pathway and is thought to act as a spectral filter, suppressing self-generated noise and permitting orientation toward sounds (Oertel and Young, 2004; Requarth and Sawtell, 2011). Cartwheel cells (CWCs) in the apical DCN are inhibitory interneurons that strongly inhibit fusiform cells, the principal neurons of DCN that send axons to the inferior colliculus. Therefore, CWC activity plays an important role in regulating DCN output (Davis et al., 1996; Kuo and Trussell, 2011). CWC firing rates are strongly enhanced by agonists of muscarinic acetylcholine receptors (mAChRs; Chen et al., 1994, 1995). This has primarily been interpreted as a result of excitation of presynaptic granule cells because glutamate receptor antagonists mostly abolish the effects of cholinergic agonists on CWCs (Chen et al., 1998, 1999; Kőszeghy et al., 2012). However, mAChRs are expressed in the superficial layer of DCN (Yao and Godfrey, 1996; Yao et al., 1996), suggesting that mAChRs may also be expressed postsynaptically on CWCs.
Two primary sources of cholinergic fibers in the cochlear nucleus (CN) have been identified. One consists of medial olivocochlear (MOC) neurons that target granule cell-rich regions (Benson and Brown, 1990; Brown, 1993), dendrites of T-stellate neurons (Fujino and Oertel 2001), and apical dendrites of fusiform cells (Zhao and Tzounopoulos, 2011). Recently, a second cholinergic input to the CN has been identified that originates in the midbrain pontomesencephalic tegmentum (PMT), a region that regulates sleep–wake cycles and attention (Schofield et al., 2011). Cholinergic neurons from the PMT are likely to have distinct roles from the MOC pathway in modulating auditory function and therefore target different elements in the DCN circuit. Moreover, it was shown recently that a cholinergic agonist can reverse the effects of noise-induced hyperactivity in the DCN (Manzoor et al., 2013). Therefore, understanding the targets of ACh and mechanisms of cholinergic signaling in DCN may be of clinical relevance for treatment of tinnitus. However, the postsynaptic effects of mAChR activation on parallel fiber (PF)–CWC synapses are not known.
To directly examine the role of postsynaptic mAChRs at the PF–CWC synapse, here we used two-photon laser uncaging of caged glutamate to evoke localized glutamate transients on dendritic spines that mimic synaptic glutamate release. This approach allows us to bypass the presynaptic terminal and investigate postsynaptic signaling mechanisms in CWC spines that are involved in mAChR modulation of synaptic transmission. We found that mAChR activation enhances the magnitude of synaptic potentials and Ca influx by inhibiting large-conductance calcium-activated potassium (BK) channels fueled by a tightly coupled L-type Ca channel localized in spines. This mAChR-dependent inhibition of BK channels was mediated through the cAMP/protein kinase A (PKA) signaling pathway. Overall, our studies clarify the effects of mAChRs on postsynaptic signaling at PF–CWC synapses and reveal a mechanism by which their activation likely contributes to plasticity in auditory processing.
Materials and Methods
Slice preparation.
All experiments were conducted in accordance with procedures approved by the National Institutes of Health Animal Care and Use Committee. Postnatal day 14 (P14) to P18 CBA/J mice were anesthetized by inhalation of isoflurane. Coronal brainstem slices (200–250 μm thick) were prepared as described previously (Sedlacek et al., 2011). Dissections were performed in an ice-cold ACSF containing the following (in mm): 125 NaCl, 26 NaHCO3, 25 glucose, 2.5 KCl, 1.25 NaH2PO4, 1 MgCl2, and 2 CaCl2 (∼320 mOsm). Slices were then incubated in N-methyl-d-glucamine (NMDG)–HEPES solution for 10 min at 34°C, [in mm: 93 NMDG, 30 NaHCO3, 25 glucose, 3 sodium pyruvate, 20 HEPES, 2.5 KCl, 1.2 NaH2PO4, 10 MgSO4, and 0.5 CaCl2 (300–310 mOsm, pH adjusted with 10N HCl to 7.3–7.4)] and then transferred to ACSF, incubated for an additional 15 min at 34°C, and then left at room temperature until recordings were performed. All solutions were equilibrated with 5% O2/95% CO2.
Electrophysiology.
Whole-cell recordings were made from CWCs visualized under infrared differential interference contrast on a combined two-photon imaging and uncaging microscope. For voltage-clamp recordings, patch pipettes (open pipette resistance, 2.5–4.5 MΩ) were filled with an internal solution containing the following (in mm): 125 KMeSO4, 10 HEPES, 5 NaCl, 0.2 EGTA, 1 MgCl2, 4 Mg-ATP, 0.4 Na-GTP, and 14 Tris-phosphocreatine (∼310 mOsm), pH adjusted to 7.3 with KOH. For experiments involving imaging and uncaging glutamate, 300 μm Fluo-5F (Invitrogen) and 20 μm Alexa Fluor-594 (Invitrogen) were included in the internal solution. In the voltage-step imaging experiments (see Fig. 7E,F), the internal solution consisted of 120 mm CsMeSO4, 10 mm tetraethylammonium (TEA)-Cl, 10 mm HEPES, 2 mm QX-314, 4 mm MgCl2, 4 mm Mg-ATP, 0.4 mm Na-GTP, 14 mm phosphocreatine, pH 7.3, 20 μm Alexa Fluor-594, and 300 μm Fluo-5F. All recordings were done in ACSF containing strychnine (1 μm) and picrotoxin (40 μm) to block glycinergic and GABAergic synaptic transmission, unless indicated. Input resistance was measured under current clamp by injecting −50 pA. For voltage step-evoked response, ACSF was supplemented with TTX (0.5 μm). Electrophysiology data were filtered at 3 kHz using a MultiClamp 700B amplifier (Molecular Devices) and sampled at 10 kHz. Cells were held at −70 mV in voltage-clamp mode, and current was injected to hold cells at approximately −80 mV in current-clamp mode. Cells were rejected if holding currents exceed −300 pA. All experiments were performed at 32 ± 2°C.
Figure 7.
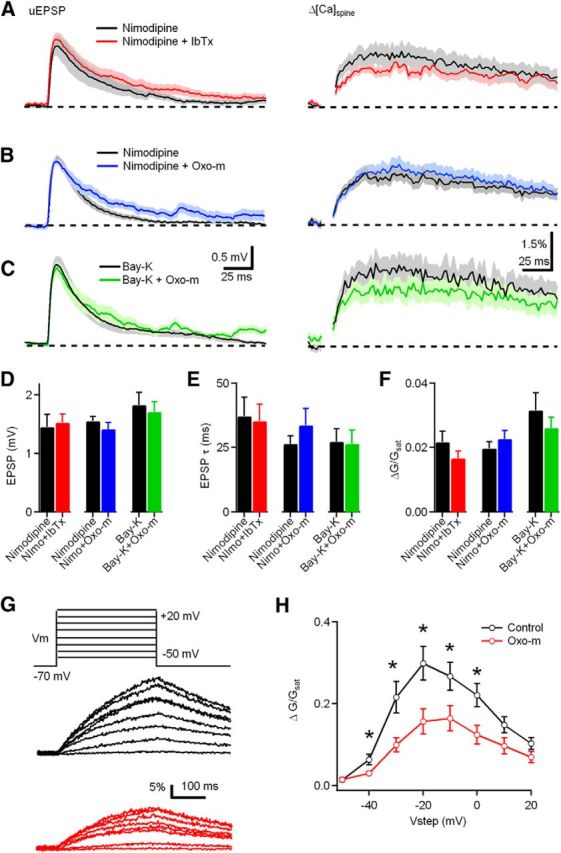
The effect of mAChR activation and BK channel blockade on synaptic potential and Ca influx are occluded by the L-type Ca channel blocker nimodipine (Nimo). A, uEPSP (left) and ΔCaspine (right) measured in the presence of nimodipine (black) and nimodipine plus iberiotoxin (IbTx) (red). B, uEPSP (left) and ΔCaspine (right) measured in the presence of nimodipine (black) and nimodipine plus Oxo-m (blue). C, uEPSP (left) and ΔCaspine (right) measured in the presence of Bay-K 8644 (black) and Bay-K plus Oxo-m (green). D–F, Summary plots of uEPSP amplitude, uEPSP decay time constant, and ΔCaspine measured in the condition shown in A–C. G, Voltage steps from −70 mV to a potential of −50 to +20 mV (300 ms in 10 mV increments) evoked Ca influx into the spine head in control (black) and Oxo-m (red) through L-type Ca channels (p = 0.03, 0.02, 0.01, 0.04, 0.02 at −40, −30, −20, −10, and 0 mV respectively). H, Summary data for ΔCaspine measured in control conditions and in the presence of Oxo-m.
Pharmacology.
Pharmacological agents were used in the extracellular solution at the following final concentrations (in μm) as indicated: 1 oxotremorine-m (Oxo-m; Tocris Cookson), 40 picrotoxin (Tocris Cookson), 1 strychnine (Sigma), 10 3-((R)-2-carboxypiperazine-4-yl)-propyl-1-phosphonic acid (R-CPP; Tocris Cookson), 10 DNQX (Tocris Cookson), 0.1 apamin (Alomone Labs), 0.5 TTX (Abcam), 6 mibefradil (Tocris Cookson), 10 nimodipine (Tocris Cookson), 0.1 iberiotoxin (Alomone Labs), 50 d-APV (Tocris Cookson), 10 H89 (N-[2-[[3-(4-bromophenyl)-2-propenyl]amino]ethyl]-5-isoquinolinesulfonamidedihydrochloride) (Tocris Cookson), 1 TTX (Abcam), 0.3 SNX-482 (Alomone Labs), 0.2 ω-agatoxin IVA (Alomone Labs), 1 TTA-P2 [3,5-dichloro-N-[1-(2,2-dimethyl-tetrahydro-pyran-4-ylmethyl)-4-fluoro-piperidin-4-ylmethyl]-benzamide] (provided by Merck), and 5 Bay-K 8644 [1,4-dihydro-2,6-dimethyl-5-nitro-4-[2-(trifluoromethyl)phenyl]-3-pyridinecarboxylic acid, methyl ester] (Alomone Labs).
Two-photon uncaging and imaging.
We used a two-photon laser scanning microscope with 60×, 0.9 numerical aperture objective (Olympus) and a titanium:sapphire pulsed laser (Chameleon; Coherent) tuned to 840 nm for excitation. Imaging and physiology were controlled with custom software written in MATLAB (MathWorks). Intracellular recording solutions were supplemented with Alexa Fluor-594 (20 μm) to visualize the cell morphology and the Ca indicator Fluo-5F (300 μm). EGTA was omitted from intracellular solutions during imaging experiments. Ca transients were measured in line scan mode at 500 Hz across a spine and a parent dendritic shaft of CWCs. Combined two-photon uncaging of 4-methoxy-7-nitroindolinyl (MNI)-glutamate and two-photon imaging was performed using a custom microscope. MNI-glutamate (Tocris Cookson) was included in the bath at 3.75 mm for experiments conducted at 31–33°C. MNI-glutamate was uncaged using 1 ms pulses of 720 nm light. Alexa Fluor-594 and Fluo-5F were excited at a wavelength of 840 nm, and stimulus-evoked changes in fluorescence were quantified as increases in green (Fluo-5F) fluorescence from baseline divided by red (Alexa Fluor-594) fluorescence (ΔG/R). G/R was also measured in saturating Ca (Gsat/R) for each dye combination and batch of intracellular solution by imaging a sealed pipette filled with internal solution containing 10 mm CaCl2. ΔG/R measurements were divided by Gsat/R, giving the reported fluorescence measurement of ΔG/Gsat. Data are reported as mean ± SEM. To test for significance, we used the two-tailed t test at a significance level of p = 0.05. In the majority of experiments, the laser power was adjusted to evoke a current of 25–30 pA at an optimal uncaging location near the spine head. Subsequently, each spine was stimulated 5–10 times (interstimulus interval of 15 s) at that location, and the uEPSCs were averaged. The experiment was repeated in current clamp, and the uncaging-evoked EPSPs (uEPSPs) and uEPSP-evoked Ca transients were recorded. Spines on secondary and tertiary apical dendrites within 100 μm of the soma were selected for analysis to improve the ability of voltage-clamp potentials in the spine.
Immunocytochemistry (EM).
Preparation of DCN tissue for transmission electron microscope (TEM) study was done as described previously (Petralia et al., 1996, 2010, 2012). All animal procedures were done in accordance with the National Institutes of Health Guide for the Care and Use of Laboratory Animals (Publication 85-23) under National Institute on Deafness and Other Communication Disorders Protocol 1167-10. For preembedding EM immunoperoxidase/DAB labeling, male Sprague Dawley rats were anesthetized with a mixture of ketamine and xylazine and perfused with 4% paraformaldehyde. Brain sections were cut at 50 μm thickness in PBS, kept for 24 h in 30% sucrose in PBS, and frozen using dry ice and an acetone bath, and the sections were stored at −80°C. Sections were thawed and washed in PBS, incubated in 10% normal goat serum (NGS), placed in the primary antibody to BK or BK b2 subunit (rabbit, 1:100; Alomone Labs) overnight at 4°C, and processed for immunoperoxidase labeling using Vectastain kit and ImpacDAB (Vector Laboratories). Control sections lacking the primary antibody were unlabeled. Silver/gold toning was performed after the DAB step: sections were washed in cacodylate buffer, incubated for 10 min at 60°C in 0.2% silver nitrate/0.2% sodium borate/2.6% hexamethylenetetramine, rinsed in water and incubated in 0.05% gold chloride for 2 min, and rinsed and incubated in 3% sodium thiosulfate for 2 min. Then sections were washed in cacodylate buffer, fixed in 2% glutaraldehyde and then in 1% osmium tetroxide, dehydrated in alcohols and propylene oxide, and finally embedded in Epon. Thin sections from two animals were cut on a Leica Ultracut microtome and examined with a Jeol JSM-1010 TEM and Advanced Microscopy Techniques digital camera.
For postembedding immunogold, rats were perfused with 4% paraformaldehyde plus 0.5% glutaraldehyde, and sections were cut at 350 μm, cryoprotected, and frozen in a Leica EM CPC, and further processed and embedded in Lowicryl HM-20 resin using a Leica AFS freeze-substitution instrument. Thin sections were incubated in 0.1% sodium borohydride plus 50 mm glycine in Tris-buffered saline plus 0.1% Triton X-100 (TBST), followed by 10% NGS in TBST, and primary antibody to BK or BK b2 subunit (rabbit, 1:20; Alomone Labs) in 1% NGS/TBST overnight, followed by immunogold labeling using either F(ab′)2 fragments or whole antibodies bound to gold conjugates (Ted Pella) in 1% NGS in TBST plus 0.5% polyethylene glycol (20,000 molecular weight). Finally, sections were stained with uranyl acetate and lead citrate. Sections from two animals were examined and photographed with a TEM.
Data acquisition and statistical analysis.
The amplitudes of uncaging-evoked potentials and currents were measured as averages around their peak values. The peaks of uncaging-evoked Ca transients were calculated by averaging 20–50 ms post-uncaging pulses. Electrophysiology data were acquired and analyzed using custom routines written in IGOR Pro (Wavemetrics) and MATLAB (MathWorks). All data are expressed as means ± SEM. In the figures, average traces are shown as the mean (solid line) ± the SEM (shaded regions or bars). A two-tailed t test was used to determine significance of differences in uEPSPs, uEPSCs, and ΔG/Gsat across conditions. p < 0.05 was considered statistically significant.
Results
Enhancement of synaptic potentials and Ca transients at dendritic spines of CWCs by activation of mAChRs
Whole-cell recordings were made from DCN CWCs in acute brain slices prepared from P14–P18 CBA/J mice. Neurons were filled through the patch pipette with the green-fluorescing Ca indicator Fluo-5F (300 μm) and the red fluorophore Alexa Fluor-594 (20 μm). Two-photon laser scanning microcopy was used to visualize cellular and dendritic morphology and to monitor intracellular Ca transients (Bloodgood and Sabatini, 2007). Red fluorescence was used to visualize the cellular morphology and to identify spines within 100 μm of the proximal dendrite (Fig. 1A). Neurons were transiently held in voltage clamp at −70 mV after break-in, and the position of the spot of glutamate uncaging was systematically varied around the spine to determine the location that produced the maximal uEPSC. Laser power then was subsequently adjusted so that a 1 ms laser pulse directed at this hotspot elicited a 25–30 pA uEPSC. The amplitude of the uEPSC was very close to the mean mEPSC amplitude recorded from CWCs in the presence of TTX (−28.9 ± 1.3 pA; data not shown). By standardizing the laser power in this way using voltage clamp, we were able to experimentally deliver a standard uncaging-evoked glutamate pulse to different spines that produced a synaptic conductance with similar amplitude and time course as vesicular release from the presynaptic terminal. Thus, the two-photon uncaging method enabled us to examine direct effects of channel blockers and pharmacological agents on postsynaptic mechanisms independent of any potential presynaptic effects.
Figure 1.
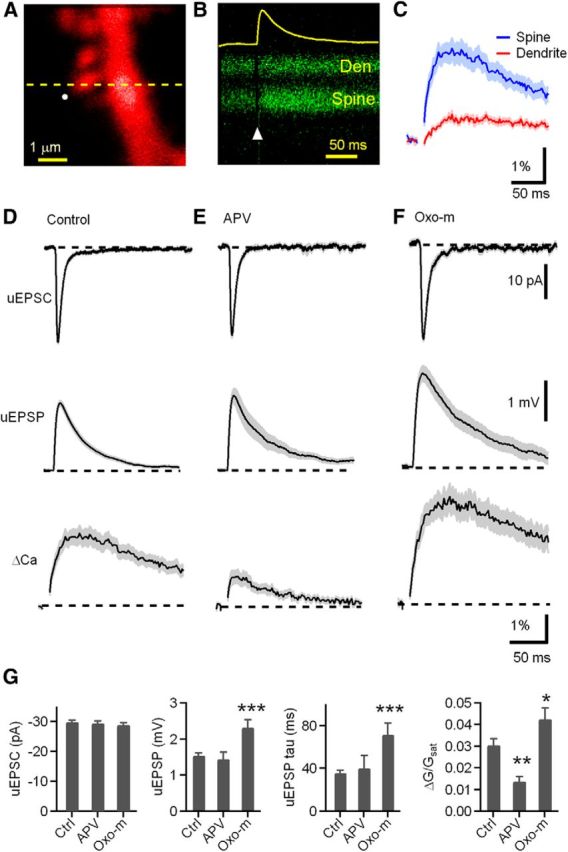
Synaptic potentials and Ca transients evoked at individual dendritic spines of CWCs are enhanced by activation of mAChRs. A, High-magnification image of a spiny region of a dendrite of a CWC neuron filled with 20 μm Alexa Fluor-594 (red). B, Green fluorescence (Fluo-5F, 300 μm) during a line scan, as indicated by the dashed line in A, that intersects the spine head (Spine) and neighboring dendrite (Den) during glutamate uncaging onto the spine head. The circle in A and arrowhead in B indicate the location and timing, respectively, of a 1 ms pulse of 720 nm laser light used to trigger two-photon-mediated photolysis of MNI-glutamate. The increase in green fluorescence indicates increased intracellular Ca. The yellow trace shows the uEPSP recorded simultaneously at the soma. C, Quantification of the green fluorescence in the spine head and dendrite (n = 25 spines/7 cells, dendrite ΔG/Gsat = 0.6 ± 0.06% vs spine ΔG/Gsat = 3.1 ± 0.3%, p < 0.001). In this and all subsequent figures, the solid line and shaded regions depict the average ± SEM, respectively. D–F, uEPSC (top), uEPSP (middle), and ΔGuEPSP/Gsat (bottom) measured, respectively, in control conditions, in the presence of NMDAR antagonist d-APV (50 μm), and in the presence of the mAChR agonist Oxo-m (1 μm). G–J, Summary of uEPSC amplitude, uEPSP amplitude, uEPSP decay time constant, and ΔCaspine, measured in control conditions (Ctrl), d-APV, and Oxo-m. For this and subsequent figures, asterisks indicate a significant difference from control: *p < 0.05, **p < 0.01, ***p < 0.001.
The amplifier was then switched to current clamp for the rest of the experiment. This resulted in a uEPSP recorded at the soma and increases in green fluorescence in the spine head and neighboring dendrite (Fig. 1B), indicative of elevated Ca in each compartment (ΔCaspine and ΔCaden, respectively) (Fig. 1C). Because the Ca transient in the dendrite is much smaller (Fig. 1C) and occurs primarily by diffusion from the neighboring spine (Sabatini et al. 2001), only ΔCaspine is reported in the below experiments. Fluorescence transients were quantified relative to maximal green fluorescence at saturating levels of Ca (ΔG/Gsat), a measure that, because of the high concentration of low-affinity indicator used, is linearly proportional to evoked changes in Ca (Higley and Sabatini, 2008). In control conditions, this stimulation protocol resulted in uEPSC = −29.9 ± 0.57 pA and uEPSP = 1.5 ± 0.07 mV (n = 25 spines/7cells; Fig. 1D). The uEPSP was accompanied by a fluorescence increase in the spine head, indicative of Ca entry (ΔG/Gsat = 3.1 ± 0.3%). Recordings obtained in the presence of the NMDA receptor (NMDAR) antagonist d-APV (uEPSC = −28.4 ± 0.7 pA; n = 18 spines/6 cells) revealed a similar uEPSP (1.4 ± 0.2 mV, p = 0.60) but greatly reduced ΔCaspine (ΔG/Gsat = 1.4 ± 0.2%, p = 0.0001; Fig. 1E), consistent with a prominent contribution of Ca influx through NMDARs to synaptically evoked Ca transients in the spine head, also observed in other brain regions, such as hippocampus (Oertner et al., 2002). Uncaging-evoked potentials and Ca transients were measured in the presence of the broad-spectrum mAChR agonist Oxo-m (1 μm; Fig. 1F). In the presence of Oxo-m, both the uEPSP and ΔG/Gsat in the spine were significantly increased (n = 19 spines/5 cells; uEPSP = 2.3 ± 0.2 mV, p = 0.0002; spine ΔG/Gsat = 4.3 ± 0.5%, p = 0.03) relative to control (Fig. 1G). The exponential decay time constant of the EPSP was also increased by Oxo-m (τ = 71.8 ± 10.8 ms) relative to control (τ = 35.8 ± 2.4 ms, p = 0.001). However, these effects were not attributable to changes in CWC intrinsic membrane properties because resting membrane potential and input resistance were unaffected by Oxo-m (control, Vm = −76.5 ± 0.4 mV; Oxo-m, Vm = −77.6 ± 0.5 mV, p = 0.08; control, Rinput = 125.6 ± 6.86 MΩ; Oxo-m, Rinput = 147.3 ± 13.7 MΩ, p = 0.12).
The effects of mAChRs are mimicked and occluded by blocking BK channels
In hippocampal CA1 pyramidal neurons, synaptic potentials and Ca influx are regulated by Ca influx through R-type Ca channels that are highly localized and open small-conductance calcium-activated potassium (SK) channels. Blockade of either SK channels or R-type Ca channels enhances both the amplitude of the EPSP and the spine Ca transient (Ngo-Anh et al., 2005; Bloodgood and Sabatini, 2007). Moreover, this signaling pathway is under modulatory control of mAChRs (Giessel and Sabatini, 2010). Therefore, we used whole-cell current-clamp recordings and Ca imaging to examine whether the SK channel was involved in mAChR-induced enhancement of synaptic potential and Ca influx in CWCs (Fig. 2). To our surprise, blocking SK channels with apamin (100 nm) had no effect on the peak amplitude of uEPSP (n = 19 spines/4 cells; 1.5 ± 0.1 mV, p = 0.80) and Ca influx (ΔG/Gsat = 3.1 ± 0.4%, p = 0.92) compared with control conditions (Fig. 2A,C).
Figure 2.

BK channel blockade mimics the mAChR activation effects, whereas SK channels have no effect on uEPSP and Ca signal in CWC spines. A, B, uEPSC (left), uEPSP (middle), and ΔGuEPSP/Gsat (right) measured in the presence of apamin (A) and iberiotoxin (B). The range of amplitudes ± SEM of the uEPSP and ΔGuEPSP/Gsat measured in control conditions are shown by the gray shaded bars. C, Summary of the uEPSC amplitude, uEPSP amplitude, uEPSP decay time constant, and ΔGuEPSP/Gsat in each pharmacological condition.
CWCs express both SK and BK channels that contribute to generation of complex spikes (Kim and Trussell, 2007). Therefore, we examined the role of BK channels in regulating uEPSPs and spine Ca transients using the selective BK channel blocker iberiotoxin (100 nm; Fig. 2B,C). In contrast to apamin, iberiotoxin enhanced the uEPSP and spine Ca transient (n = 30 spines/6 cells; uEPSP = 2.1 ± 0.1 mV, control vs iberiotoxin, p = 0.029; Ca influx, ΔG/Gsat = 4.1 ± 0.4%, p = 0.001), mimicking the effects of mAChR activation. Similar to mAChR activation, iberiotoxin also prolonged the uEPSP decay time (decay τ = 49.2 ± 4.6 ms, p = 0.03 compared with control).
To test whether mAChRs and BK channels act through a common pathway in CWC spines, we tested the ability of iberiotoxin to occlude the effects of Oxo-m on CWC uEPSPs and ΔCaspine. Indeed, in the presence of iberiotoxin, Oxo-m had no effect on the uEPSP amplitude (Fig. 3B; iberiotoxin alone, n = 14 spines/8 cells, uEPSP = 1.3 ± 0.1 mV; iberiotoxin and Oxo-m, n = 14 spines/6 cells, uEPSP = 1.3 ± 0.1 mV, p = 0.87). Iberiotoxin also occluded the effect of Oxo-m on the uEPSP decay time constant (iberiotoxin, τ = 35.76 ± 2.26 ms; iberiotoxin and Oxo-m, τ = 42.69 ± 2.77 ms, p = 0.08). In addition, effects of Oxo-m on ΔCaspine were occluded by iberiotoxin (Fig. 3B; iberiotoxin alone, spine ΔG/Gsat = 3.0 ± 0.3%; iberiotoxin and Oxo-m, spine ΔG/Gsat = 2.4 ± 1.6%, p = 0.1). Together, these results suggest that the mechanisms of enhancement of synaptic responses by activation of mAChRs and blockade of BK channels share common elements. Furthermore, it suggests that activation of mAChRs causes inhibition of BK channels located in CWC spines.
Figure 3.

Effects of mAChR activation on synaptic potentials and Ca influx are occluded by blocking BK channels. A, uEPSC, uEPSP, and ΔGuEPSP/Gsat measured in the presence of the antagonists iberiotoxin (IbTx; black) and iberiotoxin plus Oxo-m (red). B, Summary of the uEPSC amplitude, uEPSP amplitude, uEPSP decay time constant, and ΔGuEPSP/Gsat in each condition.
NMDAR activity is required for iberiotoxin-induced uEPSP and ΔCaspine increases
Dendritic spines are specialized neuronal compartments that compartmentalize large, rapid Ca fluctuations that regulate synaptic plasticity and other biochemical signaling cascades (Sabatini et al., 2001). The results presented above suggest that BK channels are activated by glutamatergic signaling at CWC spines under control conditions, suppressing the amplitude of the uEPSP and the spine Ca transient. The majority of CWC spine Ca influx is mediated by NMDARs, which exhibit a voltage-dependent magnesium block. Therefore, BK channel blockade by iberiotoxin may enhance spine depolarization and increase current and Ca flux through NMDARs. To test whether BK channels influence NMDAR activation, we examined the effects of iberiotoxin following application of the NMDAR antagonist d-APV (50 μm; Fig. 4A). In the presence of d-APV, iberiotoxin did not affect uEPSP amplitude (d-APV, n = 14 spines/3 cells, uEPSP = 1.1 ± 0.1 mV; d-APV plus iberiotoxin, n = 11 spines/3 cells, uEPSP = 1.1 ± 0.1 mV; p = 0.73) or ΔCaspine (d-APV, n = 14 spines/3 cells, ΔG/Gsat = 0.9 ± 0.09%; d-APV plus iberiotoxin, n = 11 spines/3 cells, ΔG/Gsat = 1.0 ± 0.18%, p = 0.32). This result contrasts with the effect of iberiotoxin when NMDARs are unblocked (Fig. 2B) and indicates that BK channels influence current and Ca flux through NMDARs by their effects on spine voltage.
Figure 4.
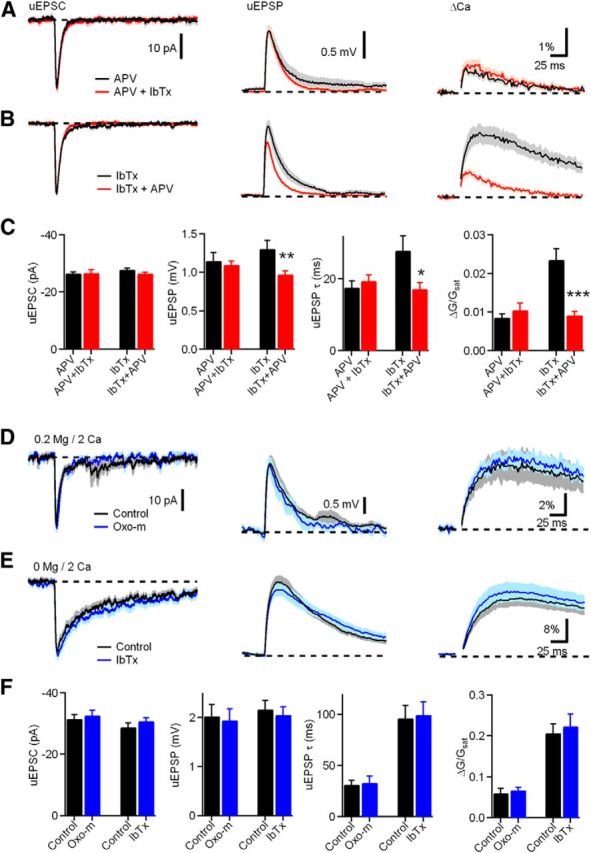
NMDAR activity is required for iberiotoxin (IbTx)-induced uEPSP and ΔCaspine increases. A, uEPSC (left), uEPSP (middle), and ΔGuEPSP/Gsat (right) measured in the presence of d-APV (black) and d-APV plus iberiotoxin (red). B, uEPSC (left), uEPSP (middle), and ΔGuEPSP/Gsat (right) measured in the presence of iberiotoxin (black) and iberiotoxin plus d-APV(red). C, Summary plots of uEPSC amplitude, uEPSP amplitude, uEPSP decay time constant, and ΔGuEPSP/Gsat measured as indicated in A and B. D, uEPSC (left), uEPSP (middle), and ΔGuEPSP/Gsat (right) measured in control (black) and Oxo-m (blue) in ACSF containing 0.2 mm magnesium and 2 mm Ca. E, uEPSC (left), uEPSP (middle), and ΔGuEPSP/Gsat (right) measured in control (black) and iberiotoxin (blue) in nominally magnesium-free (0 mm Mg, 2 mm Ca) ACSF. F, Summary plots of amplitudes of uEPSCs, uEPSPs, uEPSP decay time constant, and ΔGuEPSP/Gsat (bottom) measured in the condition shown in D and E.
To further test our hypothesis that BK channels negatively regulate the NMDAR contribution to ΔCaspine, we next examined the effects of d-APV when BK channels were blocked (Fig. 4B). Addition of d-APV in the presence of iberiotoxin decreased the uEPSP amplitude (n = 25 spines/10 cells, 1.0 ± 0.05 mV, compared with iberiotoxin only, n = 27 spines/9 cells, 1.3 ± 0.1 mV, p = 0.008). This result contrasts with the application of d-APV under control conditions (Fig. 1D,E) in which d-APV had no significant effect on uEPSP amplitude. Moreover, addition of d-APV in the presence of iberiotoxin also reduced the uEPSP decay time constant (17.2 ± 1.72 ms vs iberiotoxin alone, 27.89 ± 4.09 ms, p = 0.03) and reduced the Ca transient (0.9 ± 0.09% compared with iberiotoxin alone, 2.4 ± 0.3%, p = 0.00003). These findings indicate that NMDAR activation is enhanced by blockade of the outward BK potassium current. Moreover, subsequent application of an NMDAR antagonist causes a decrease in EPSP amplitude and spine Ca transient.
The complementary findings in Figure 4, A and B, demonstrate that BK channels provide negative feedback on NMDARs through their effects on spine voltage. To further underscore the importance of BK channels in regulating current and Ca flux through NMDARs, we conducted two additional sets of experiments. First, we predicted that reducing the voltage dependence of NMDARs by lowering magnesium would prevent the effects of Oxo-m on EPSP amplitudes and spine Ca transients observed in Figure 1. As expected, when bath magnesium was reduced to 0.2 mm, Oxo-m did not increase uEPSPs (Fig. 4D,F; 0.2 mm magnesium, n = 7 spines/3 cells, 2.0 ± 0.2 mV compared with Oxo-m, n = 7 spines/3 cells, 1.9 ± 0.2 mV, p = 0.80) or ΔCaspine (Fig. 4D,F; 6.0 ± 1.1% compared with Oxo-m, 6.7 ± 0.7%, p = 0.58). Furthermore, we observed that, in nominally magnesium-free bath solution, blockade of BK channels does not cause an increase in uEPSPs (Fig. 4E,F; 0 mm magnesium, n = 13 spines/5 cells, uEPSP = 2.2 ± 0.2 mV vs iberiotoxin, n = 17 spines/7 cells, uEPSP = 2.1 ± 0.2 mV, p = 0.63) or ΔCaspine (ΔG/Gsat = 20.7 ± 2.2% compared with Oxo-m, ΔG/Gsat = 22.4 ± 3%, p = 0.67). Together, the results of Figure 4 demonstrate that BK channels in CWCs regulate current and Ca flux through NMDARs present in spines, and this regulation requires voltage-dependent magnesium block of NMDARs.
BK channel localization at CWC spines
BK channels are expressed throughout most regions of the mammalian brain (Sausbier et al., 2006) and are fundamental regulators of neuronal excitability, participating in both interspike interval and release of neurotransmitter (Vergara et al., 1998; Raffaelli et al., 2004). To test for the presence of functional BK channels in CWCs (Kim and Trussell, 2007), we first made current-clamp recordings from CWCs (Fig. 5A). Blocking BK channels slowed spike repolarization, leading to more complex spike-like firing pattern, indicating the BK presence in CWCs. Next, we made voltage-clamp recordings to directly record BK current by use of the channel-specific inhibitor iberiotoxin (Storm, 1987). Depolarizing voltage steps from −90 to −30 mV (200 ms) elicited a transient outward current that was blocked by iberiotoxin (100 nm; Fig. 5B). Here we confirmed the recovery of the BK current by washing out iberiotoxin to rule out effects of BK current rundown during whole-cell recordings. Combined, the current-clamp and voltage-clamp data indicate the functional presence of BK channels in CWCs.
Figure 5.

CWCs express rapidly inactivating BK channels. A, BK channel blockade using iberiotoxin reduced the afterhyperpolarization, increasing the tendency to fire complex spikes. B, Depolarizing voltage steps (from −90 to −30 mV, 200 ms) in a CWC elicited a rapidly inactivating outward current that was blocked by iberiotoxin (100 nm). C, Localization of BK antibody labeling in presumptive CWC spines in the DCN using preembedding silver/gold-toned immunoperoxidase (top micrographs) and postembedding immunogold labeling (arrowheads in bottom micrographs). den, Dendrite; pre, presynaptic terminal; sp, spine; asterisk, postsynaptic density. Scale bars: top, 500 nm; bottom, 100 nm.
To provide more direct evidence that BK channels are directly involved in local signaling processing in CWC spines, we used two complementary electron microscope immunochemical techniques to identify BK channels in presumptive CWC dendritic spines in adult rat DCN sections (Fig. 5C). CWC spines were identified based on their large spine head forming an asymmetric synapse on a large PF terminal filled with round vesicles (Petralia et al., 2000). Typically, profiles of CWC dendrites showed several large spines clustered around the medium-sized dendrite (Fig. 5C, left; Wouterlood and Mugnaini, 1984). We first used preembedding silver/gold-toned immunoperoxidase labeling (Fig. 5C, left), a sensitive method that specifically shows localization of BK channels in postsynaptic CWC spines. In addition, we used postembedding immunogold (Fig. 5C, right) to show more spatially accurate localization of BK channel labeling near and on the spine membrane.
Differential regulation of ΔCaspine by voltage-sensitive Ca channels
BK channels are activated by the cooperative effects of two distinct stimuli: membrane depolarization and cytoplasmic Ca. Several Ca channel subtypes able to activate BK channels have been identified using subtype-specific peptide toxins or blockers: L-type (Grimes et al., 2009; Zorrilla de San Martín et al., 2010), P/Q-type (Womack et al., 2004), and N-type (Marrion and Tavalin, 1998) channels. To determine the Ca channel subtype that contributes to BK channel activation in CWC spines, we took advantage of subtype-specific toxins as in previous work. Blockade of the candidate Ca channel must increase the Ca transient evoked by uncaging glutamate and occlude the effects of both mAChR activation and BK channel blockade. Among blockers inhibiting L-type, T-type, R-type, and P/Q-type Ca channels, only the L-type Ca channel blocker nimodipine (10 μm) increased Ca transients significantly (Fig. 6A; n = 17 spines/4 cells, ΔG/Gsat = 186.2 ± 17.3% normalized to control, p = 0.0007). The others did not affect Ca influx as follows: (1) 1 μm T-type blocker TTA-P2 (Fig. 6B), n = 17 spines/5 cells, ΔG/Gsat = 107.1 ± 13.4% relative to control, p = 0.70; (2) 300 nm R-type Ca channel blocker SNX-482 (Fig. 6C), n = 20 spines/4 cells, ΔG/Gsat = 91.5 ± 8.9% relative to control, p = 0.56; and (3) 200 nm P/Q-type Ca channel blocker ω-agatoxin IVA (Fig. 6D), n = 11 spines/3 cells, ΔG/Gsat = 120.7 ± 15.9% relative to control, p = 0.44. These experiments suggest that Ca influx through L-type channels is responsible for BK channel activation in CWC spines.
Figure 6.
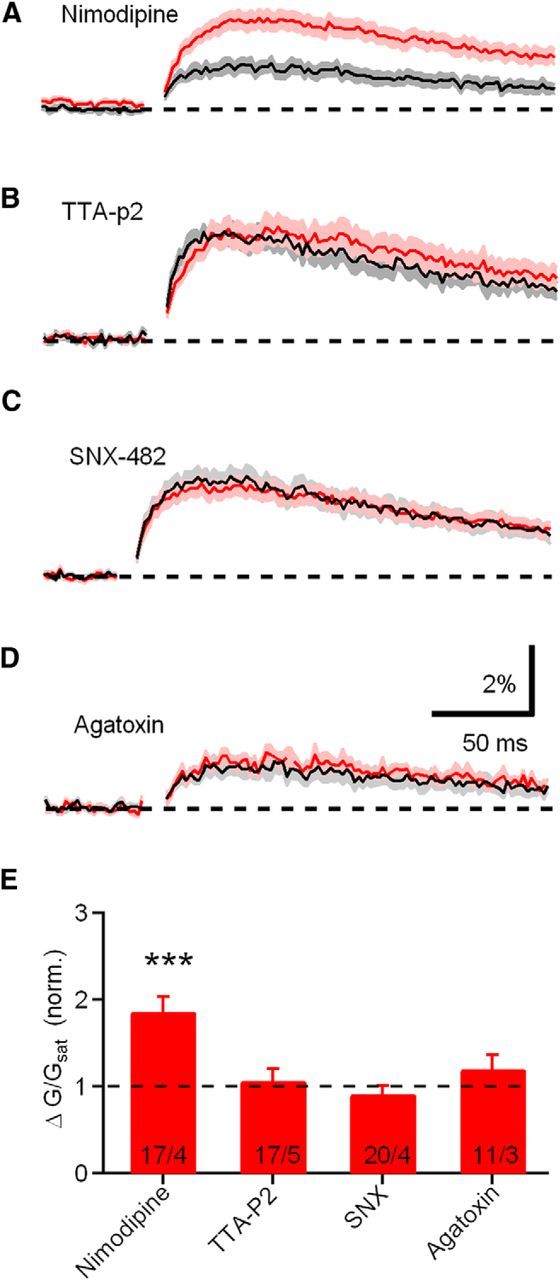
Differential regulation of ΔCauEPSP by voltage-sensitive Ca channels. A–D, ΔCaspine measured in the presence of antagonists of L-type (nimodipine), T-type (TTA-P2), R-type (SNX-482), and P/Q-type (ω-agatoxin IVA) Ca channels, respectively. E, Summary plots of amplitudes of ΔG/Gsat measured in the conditions show in A–D.
The effects of mAChR activation and BK channel blockade are occluded by the L-type Ca channel blocker nimodipine
Because blocking L-type Ca channels has a similar effect as inhibiting BK channels on enhancing spine Ca transients, we tested whether L-type Ca channels are required for BK channel-dependent regulation of the uEPSP and ΔCaspine. In the presence of nimodipine, uncaging glutamate on dendritic spines generated an average uEPSP = 1.4 ± 0.2 mV and ΔG/Gsat = 2.2 ± 0.3% (n = 14 spines/4 cells; Fig. 7A,D). Subsequent application of the BK blocker iberiotoxin produced no additional increase in either uEPSP or ΔCaspine (Fig. 7A; n = 16 spines/5 cells, uEPSP = 1.5 ± 0.1 mV, p = 0.83; ΔG/Gsat = 1.7 ± 0.2%, p = 0.08). The ability of nimodipine to occlude the effects of iberiotoxin on the uEPSP and ΔCaspine indicates that basal synaptic transmission under control conditions evokes influx of Ca through L-type channels and thereby activates BK channels in CWC spines.
We next tested whether L-type Ca channels are required for the effects of mAChR activation on uEPSPs and spine Ca transients (Fig. 7B,D). We found that, in the presence of nimodipine, Oxo-m did not effect uEPSP amplitude (nimodipine, n = 16 spines/5 cells, uEPSP = 1.55 ± 0.08 mV vs nimodipine plus Oxo-m, n = 12 spines/6 cells, uEPSP = 1.45 ± 0.11 mV, p = 0.45), uEPSP decay time constant (nimodipine, τ = 37.25 ± 0.30 ms vs nimodipine plus Oxo-m, τ = 35.22 ± 6.57 ms, p = 0.32), or ΔCaspine (nimodipine, ΔG/Gsat = 2.0 ± 0.2% vs nimodipine plus Oxo-m, ΔG/Gsat = 2.3 ± 0.3%, p = 0.26). The ability of nimodipine to occlude the effects of Oxo-m indicate that L-type Ca channels act downstream of mAChRs in CWC spines and regulate BK channel activation.
In addition, we further tested the link between mAChRs and L-type Ca channels in CWC spines using the L-type Ca channel activator Bay-K 8644 (Fig. 7C). In the presence of Bay-K 8644, subsequent application of Oxo-m had no additional effect on uEPSP amplitude (Bay-K 8644, n = 16 spines/8 cells, uEPSP = 1.82 ± 0.21 mV compared with Bay-K8644 plus Oxo-m, n = 14 spines/8cells, uEPSP = 1.71 ± 0.17 mV, p = 0.68), uEPSP decay (Bay-K 8644, 27.2 ± 5.0 ms vs Bay-K 8644 plus Oxo-m, 26.4 ± 5.3 ms, p = 0.90), or ΔCaspine (Bay-K 8644 alone, ΔG/Gsat = 3.3 ± 0.5 compared with Bay-K8644 plus Oxo-m, ΔG/Gsat = 2.4 ± 0.3, p = 0.16). These results confirm that activation of L-type Ca channels occurs downstream of the mAChR activation pathway and contributes to BK channel inhibition.
To provide additional evidence for a direct effect of mAChR activation on suppression of L-type Ca channels in CWC spines, we measured isolated L-type Ca transients in CWC spines during a series of voltages steps ranging from −50 to +20 mV under control conditions (n = 12 spines/5 cells) and after wash-in of Oxo-m (n = 10 spines/4 cells). Ca influx into spines during voltage steps was reduced significantly for voltage steps between −40 and 0 mV (Fig. 7G,H). Ca through L-type channels was isolated with cesium, TEA, QX-314, R-CPP, DNQX, apamin, iberiotoxin, conotoxin-MVIIC, ω-agatoxin IVA, mibefradil, and SNX-482. These results demonstrate that suppression of L-type Ca channels contributes to mAChR-mediated suppression of BK current.
mAChR activation decreases BK current through the PKA signaling pathway
Previous autoradiographic binding and immunostaining studies indicate that M2/M4 receptors predominate in DCN (Levey, 1993; Yao and Godfrey, 1996; Yao et al., 1996). These muscarinic receptors are functionally linked to the Gi/o class of G-proteins, which inhibit adenylyl cyclase, causing a decrease in the activity of PKA (Brown, 2010). To test whether the PKA signaling pathway is involved in the effect of mAChR activation on synaptic transmission in CWCs, uEPSPs and ΔCaspine were measured in the presence of H89, a PKA inhibitor (Fig. 8A,B). Subsequent application of Oxo-m produced no effect on either uEPSPs or ΔCaspine (H89 alone, uEPSP = 2.4 ± 0.2 mV, ΔG/Gsat = 1.6 ± 0.2%, n = 14 spines/4 cells; H89 plus Oxo-m, uEPSP = 2.2 ± 0.2 mV, p = 0.46, ΔG/Gsat = 2.0 ± 0.2%, p = 0.26, n = 13 spines/6 cells), indicating that the PKA signaling pathway is necessary for mAChR activation. Furthermore, we tested whether PKA regulates the whole-cell BK current. Thus, we made voltage-clamp recordings from CWCs to record BK current in the presence and absence of the PKA inhibitor H89. BK currents were measured as in Figure 5B. The effect of H89 on BK current is shown in Figure 8C. The amplitude of BK current recorded in the presence of H89 was smaller than under the control condition (Fig. 8C; control, n = 11 cells, 1062.5 ± 195.6 pA; H89, n = 13, 654.2 ± 70.7 pA, p = 0.048). Sample traces are shown in each condition. Reduction of the BK current by H89 indicates that PKA contributes to BK channel activation and suggests that the Gi/o-coupled mAChR subtypes M2/M4 are present on CWC spines.
Figure 8.
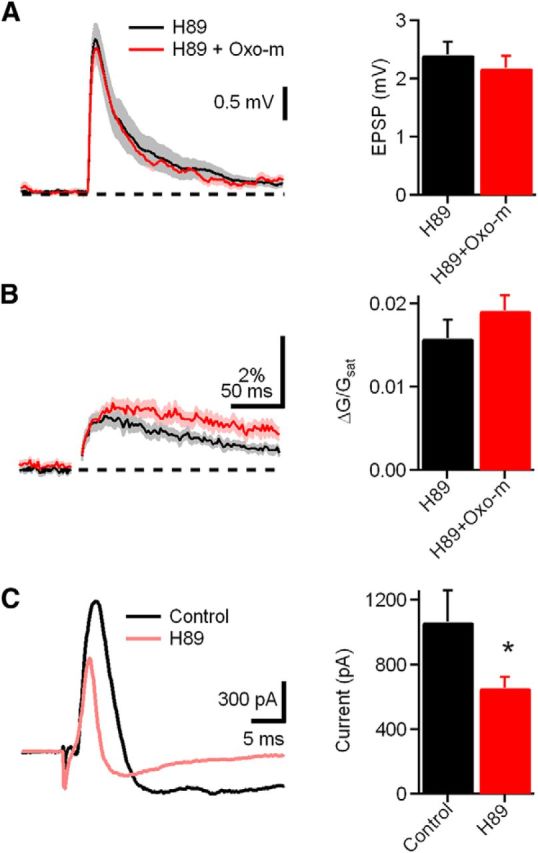
mAChR activation decreases BK current through PKA signaling. A, Left, uEPSP measured in the presence of H89, a PKA inhibitor (black), and H89 plus Oxo-m (red, left). Right, Bar graph of amplitudes of uEPSP measured in the condition shown in the left. B, Left, ΔCaspine measured in the presence of H89 (black) and H89 plus Oxo-m (red). Right, Bar graphs of ΔCaspine measured in the condition show in the left. C, Left, Traces illustrating BK current extracted by voltage step and iberiotoxin (from −90 to −30 mV) in the presence of control (black) and H89 (red). Right, Bar graph of BK current in the above conditions.
Discussion
Here we demonstrate a novel cholinergic signaling pathway localized within dendritic spines of DCN CWCs. Using two-photon glutamate uncaging to mimic quantal release at the PF–CWC synapse, we quantified the uEPSP and ΔCaspine produced in the spine and observed that both were enhanced by the mAChR agonist Oxo-m. Blockade of BK channels produced a similar enhancement and occluded the effects of the mAChR agonist. Together, these results suggest that BK channels are activated by glutamatergic transmission at CWC spines and that BK current is reduced by mAChRs. We also find that activation of L-type Ca channels contribute to BK channel gating, which is confirmed by demonstrating that nimodipine occludes the effects of iberiotoxin and Oxo-m. Furthermore, mAChR-mediated reduction of L-type Ca current contributes to the reduction of BK current. BK potassium current was significantly inhibited by the PKA inhibitor H89, providing evidence that Gi/o-coupled M2/M4 mAChRs are present on CWC spines. We also provide direct EM evidence for localization of BK channels on CWC spines. Whereas previous studies attributed cholinergic effects on CWC activity to indirect effects through granule cells (Chen et al., 1999), our study demonstrates a direct postsynaptic effect of mAChR activation on CWCs acting through suppression of BK channels (Fig. 9).
Figure 9.

Schematic diagram of CWC spine signaling pathways. Glutamate activates AMPARs and NMDARs producing an EPSP and Ca entry through NMDARs. Synaptic stimulation under control conditions also activates L-type Ca channels that contribute to BK channel gating, generating a hyperpolarizing current that suppresses both the EPSP and Ca transient. Activation of mAChRs reduces Ca entry through L-type channels through the PKA signaling pathway, thereby reducing BK activation and enhancing both the EPSP amplitude and Ca influx through NMDARs.
Comparison with other DCN cell types
Previous studies established that mAChRs are present at multiple sites within the DCN circuit. CN granule cells, whose axons provide PF excitation to CWCs, respond to mAChR agonists with an increase of their spontaneous firing rates (Kőszeghy et al., 2012). Golgi cells, which send inhibitory input to granule cells, are hyperpolarized by mAChR activation of GIRKs (Irie et al., 2006). Together, the effects of increased granule cell activity and reduction of their Golgi cell inhibitory input is predicted to have a net excitatory effect on CWCs. Combined with the enhancement of synaptic strength at the PF–CWC synapse demonstrated in the experiments performed in our study, cholinergic activation in the DCN is likely to cause strong enhancement of CWC network activity.
The previously described mechanisms of cholinergic modulation of granule and Golgi cells can be attributed to activation or suppression of membrane conductances influencing postsynaptic membrane potential. In CWCs, we observed that Oxo-m (1 μm) did not significantly alter membrane potential or input resistance. Therefore, we can attribute changes in uEPSP and ΔCaspine to direct effects occurring at spines of CWCs that receive input from PFs.
Complex spikes in CWCs
CWCs fire complex spikes that consist of a burst of sodium spikes driven by a slower Ca-dependent depolarization. Because the complex spike waveform is faithfully propagated along the CWC axon to its axon terminals, it produces a burst of inhibition in its postsynaptic targets, which include both neighboring CWCs and fusiform cells. CWCs express both BK and SK channels that exert strong influences on their complex spiking behavior (Kim and Trussell, 2007). Under control conditions, entry of Ca during sodium spikes activates BK and SK channels, producing hyperpolarizing potassium current that suppresses complex spiking. Blocking either SK channels with apamin or BK channels with iberiotoxin causes a significant increase in the complex spike output of CWCs. Conductances regulating firing properties of neurons can be localized at multiple membrane regions, including dendritic shafts, the soma, and the initial axon segment (Bender et al., 2012). Here we provide the first evidence for a direct role of BK channels in CWC spines.
BK channels are cooperatively activated by membrane depolarization and intracellular Ca+ (Fakler and Adelman, 2008). However, a recent study shows that ligand gating by Ca ions is the rate-limiting step for physiological BK activation (Berkefeld and Fakler, 2013), suggesting that, despite their voltage sensitivity, their gating properties may be more closely related to SK channels than considered previously.
Spine feedback in other brain regions
Neurons in multiple brain regions appear to use Ca-activated potassium channels in a negative-feedback role to suppress spine depolarization and Ca entry caused by glutamatergic transmission. In hippocampal CA1 pyramidal neurons, SK channels regulate synaptic potentials and synaptically evoked Ca transients in spines of apical dendrites (Ngo-Anh et al., 2005; Bloodgood and Sabatini, 2007). Blocking SK channels with apamin increases evoked EPSPs in cultured neurons and increases in uEPSPs in acute hippocampal slices, which are accompanied by increases in the ΔCaspine. The R-type Ca channel blocker SNX-482 has similar effects and occludes the effects of apamin, suggesting that R-type channels provide the Ca signal required for SK channel activation (Giessel and Sabatini, 2011). Moreover, mAChR activation with Oxo-m also increases uEPSPs and ΔCaspine by inhibiting SK channels (Giessel and Sabatini, 2010).
Our present findings in CWCs of the DCN demonstrate distinct variations on this spine signaling mechanism present in CA1 pyramidal neurons. In CWCs, SK channels do not affect uEPSPs or ΔCaspine despite the presence CWCs and their effect on CWC spiking properties. In addition, L-type channels provide the Ca signal required for BK channel activation in CWCs, in contrast to R-type channels required in CA1. Finally, modulation of SK channels in CA1 neurons occurs through activation of Gq-coupled M1 receptors, whereas BK channel modulation in CWCs occurs through a PKA-mediated pathway and is therefore more likely to result from activation of Gi/o-coupled M2/M4 mAChRs.
Cholinergic modulation of auditory processing in the DCN
Anatomical studies demonstrated multiple sources of ACh that project to the DCN. One source of cholinergic axons projecting to the DCN arises from MOC neurons in the superior olivary complex (Benson and Brown, 1990; Brown, 1993) and participate in the olivocochlear reflex, a neuroprotective mechanism that suppresses cochlear outer hair cells and thereby reduces cochlear amplification during periods of high sound intensity. Axons of MOC neurons also project to the CN and may function to enhance activity levels in the ascending auditory pathway (Fujino and Oertel, 2001). It is not known whether cholinergic MOC axon terminals directly synapse onto dendrites of CWCs and fusiform cells in the apical layer of the DCN. However, there is considerable evidence that ACh can signal at a distance by diffusion through the extrasynaptic space (Sarter et al., 2009; Picciotto et al., 2012).
More recently, a cholinergic projection from the PMT to the CN has been identified (Mellott et al., 2011; Schofield et al., 2011). The PMT has been implicated in several functions relevant to processing auditory information in the DCN, including attention, arousal, and sensory gating. Although the axonal targets of PMT neurons in the CN are not yet known, they provide another possible source of ACh that may contribute to neuromodulation in the apical DCN. It will be of great interest to determine the conditions under which cholinergic signaling is recruited in the DCN and the effect of cholinergic modulation on sound processing.
Cholinergic modulation may also have importance under certain pathological conditions, such as intense sound exposure or cochlear ablation, because mAChR and choline acetyltransferase upregulation have been observed in these instances (Jin et al., 2005, 2006; Jin and Godfrey, 2006). Intense sound exposure leads to large increases in the sensitivity of DCN neurons to cholinergic agonists (Chang et al., 2002; Kaltenbach and Zhang, 2007). These changes could result in pathological perception of sound, as in tinnitus. Growing evidence suggests that tinnitus may correlate with hyperactivity in fusiform cells of the DCN (Bauer and Brozoski, 2001; Kaltenbach, 2007, 2011; Roberts et al., 2010). Furthermore, application of a cholinergic agonist has been shown to abolish fusiform cell hyperactivity induced by noise exposure (Manzoor et al., 2013). Enhancement in PF–CWC transmission induced by cholinergic agonists may contribute to suppression of fusiform cell activity and therefore provide a clinical target for the treatment of tinnitus.
Cholinergic modulation and plasticity
Our study adds to growing evidence that the DCN molecular layer circuit is subject to neuromodulation (Zhao et al., 2009; Kuo and Trussell, 2011). Increased Ca signals in dendritic spine induced by mAChRs also highlight the role of cholinergic modulation in synaptic plasticity. In fusiform cells, the interaction between M1/M3 mAChRs, NMDARs, and endocannabinoid signaling regulate the induction of synaptic plasticity (Zhao and Tzounopoulos, 2011). However, postsynaptic M2/M4 muscarinic receptors are more likely to be involved in the regulation of synaptic transmission at CWC spines. Similarly, M1 receptors are enriched in CA1 pyramidal neurons, whereas M2 and M4 receptor density is high in interneurons (Levey et al., 1995). There is also evidence showing that M2 receptors may function at both postsynaptic and presynaptic sites (Levey et al., 1991). The fact that ACh can influence different types of neurons at both presynaptic and postsynaptic sites and by using distinct signaling pathways via different receptor subtypes enables powerful and flexible roles in modulating the function of central auditory circuits.
Footnotes
This work was supported by the National Institute on Deafness and Other Communication Disorders Intramural Research Program. We thank Drs. Miloslav Sedlacek and Noah Roy for helpful comments on this manuscript.
References
- Bauer CA, Brozoski TJ. Assessing tinnitus and prospective tinnitus therapeutics using a psychophysical animal model. J Assoc Res Otolaryngol. 2001;2:54–64. doi: 10.1007/s101620010030. [DOI] [PMC free article] [PubMed] [Google Scholar]
- Bender KJ, Uebele VN, Renger JJ, Trussell LO. Control of firing patterns through modulation of axon initial segment T-type calcium channels. J Physiol. 2012;590:109–118. doi: 10.1113/jphysiol.2011.218768. [DOI] [PMC free article] [PubMed] [Google Scholar]
- Benson TE, Brown MC. Synapses formed by olivocochlear axon branches in the mouse cochlear nucleus. J Comp Neurol. 1990;295:52–70. doi: 10.1002/cne.902950106. [DOI] [PubMed] [Google Scholar]
- Berkefeld H, Fakler B. Ligand-gating by Ca+ is rate limiting for physiological operation of BK(Ca) channels. J Neurosci. 2013;33:7358–7367. doi: 10.1523/JNEUROSCI.5443-12.2013. [DOI] [PMC free article] [PubMed] [Google Scholar]
- Bloodgood BL, Sabatini BL. Nonlinear regulation of unitary synaptic signals by CaV(2.3) voltage-sensitive calcium channels located in dendritic spines. Neuron. 2007;53:249–260. doi: 10.1016/j.neuron.2006.12.017. [DOI] [PubMed] [Google Scholar]
- Brown DA. Muscarinic acetylcholine receptors (mAChRs) in the nervous system: some functions and mechanisms. J Mol Neurosci. 2010;41:340–346. doi: 10.1007/s12031-010-9377-2. [DOI] [PubMed] [Google Scholar]
- Brown MC. Fiber pathways and branching patterns of biocytin-labeled olivocochlear neurons in the mouse brainstem. J Comp Neurol. 1993;337:600–613. doi: 10.1002/cne.903370406. [DOI] [PubMed] [Google Scholar]
- Chang H, Chen K, Kaltenbach JA, Zhang J, Godfrey DA. Effects of acoustic trauma on dorsal cochlear nucleus neuron activity in slices. Hear Res. 2002;164:59–68. doi: 10.1016/S0378-5955(01)00410-5. [DOI] [PubMed] [Google Scholar]
- Chen K, Waller HJ, Godfrey DA. Cholinergic modulation of spontaneous activity in rat dorsal cochlear nucleus. Hear Res. 1994;77:168–176. doi: 10.1016/0378-5955(94)90264-X. [DOI] [PubMed] [Google Scholar]
- Chen K, Waller HJ, Godfrey DA. Muscarinic receptor subtypes in rat dorsal cochlear nucleus. Hear Res. 1995;89:137–145. doi: 10.1016/0378-5955(95)00131-6. [DOI] [PubMed] [Google Scholar]
- Chen K, Waller HJ, Godfrey DA. Effects of endogenous acetylcholine on spontaneous activity in rat dorsal cochlear nucleus slices. Brain Res. 1998;783:219–226. doi: 10.1016/S0006-8993(97)01348-6. [DOI] [PubMed] [Google Scholar]
- Chen K, Waller HJ, Godfrey TG, Godfrey DA. Glutamergic transmission of neuronal responses to carbachol in rat dorsal cochlear nucleus slices. Neuroscience. 1999;90:1043–1049. doi: 10.1016/S0306-4522(98)00503-X. [DOI] [PubMed] [Google Scholar]
- Davis KA, Miller RL, Young ED. Effects of somatosensory and parallel-fiber stimulation on neurons in dorsal cochlear nucleus. J Neurophysiol. 1996;76:3012–3024. doi: 10.1152/jn.1996.76.5.3012. [DOI] [PubMed] [Google Scholar]
- Fakler B, Adelman JP. Control of K(Ca) channels by calcium nano/microdomains. Neuron. 2008;59:873–881. doi: 10.1016/j.neuron.2008.09.001. [DOI] [PubMed] [Google Scholar]
- Fujino K, Oertel D. Cholinergic modulation of stellate cells in the mammalian ventral cochlear nucleus. J Neurosci. 2001;21:7372–7383. doi: 10.1523/JNEUROSCI.21-18-07372.2001. [DOI] [PMC free article] [PubMed] [Google Scholar]
- Giessel AJ, Sabatini BL. M1 muscarinic receptors boost synaptic potentials and calcium influx in dendritic spines by inhibiting postsynaptic SK channels. Neuron. 2010;68:936–947. doi: 10.1016/j.neuron.2010.09.004. [DOI] [PMC free article] [PubMed] [Google Scholar]
- Giessel AJ, Sabatini BL. Boosting of synaptic potentials and spine Ca transients by the peptide toxin SNX-482 requires alpha-1E-encoded voltage-gated Ca channels. PLoS One. 2011;6:e20939. doi: 10.1371/journal.pone.0020939. [DOI] [PMC free article] [PubMed] [Google Scholar]
- Grimes WN, Li W, Chávez AE, Diamond JS. BK channels modulate pre- and postsynaptic signaling at reciprocal synapses in retina. Nat Neurosci. 2009;12:585–592. doi: 10.1038/nn.2302. [DOI] [PMC free article] [PubMed] [Google Scholar]
- Higley MJ, Sabatini BL. Calcium signaling in dendrites and spines: practical and functional considerations. Neuron. 2008;59:902–913. doi: 10.1016/j.neuron.2008.08.020. [DOI] [PubMed] [Google Scholar]
- Irie T, Fukui I, Ohmori H. Activation of GIRK channels by muscarinic receptors and group II metabotropic glutamate receptors suppresses Golgi cell activity in the cochlear nucleus of mice. J Neurophysiol. 2006;96:2633–2644. doi: 10.1152/jn.00396.2006. [DOI] [PubMed] [Google Scholar]
- Jin YM, Godfrey DA. Effects of cochlear ablation on muscarinic acetylcholine receptor binding in the rat cochlear nucleus. J Neurosci Res. 2006;83:157–166. doi: 10.1002/jnr.20706. [DOI] [PubMed] [Google Scholar]
- Jin YM, Godfrey DA, Sun Y. Effects of cochlear ablation on choline acetyltransferase activity in the rat cochlear nucleus and superior olive. J Neurosci Res. 2005;81:91–101. doi: 10.1002/jnr.20536. [DOI] [PubMed] [Google Scholar]
- Jin YM, Godfrey DA, Wang J, Kaltenbach JA. Effects of intense tone exposure on choline acetyltransferase activity in the hamster cochlear nucleus. Hear Res. 2006;216–217:168–175. doi: 10.1016/j.heares.2006.02.002. [DOI] [PubMed] [Google Scholar]
- Kaltenbach JA. The dorsal cochlear nucleus as a contributor to tinnitus: mechanisms underlying the induction of hyperactivity. Prog Brain Res. 2007;166:89–106. doi: 10.1016/S0079-6123(07)66009-9. [DOI] [PubMed] [Google Scholar]
- Kaltenbach JA. Tinnitus: models and mechanisms. Hear Res. 2011;276:52–60. doi: 10.1016/j.heares.2010.12.003. [DOI] [PMC free article] [PubMed] [Google Scholar]
- Kaltenbach JA, Zhang J. Intense sound-induced plasticity in the dorsal cochlear nucleus of rats: evidence for cholinergic receptor upregulation. Hear Res. 2007;226:232–243. doi: 10.1016/j.heares.2006.07.001. [DOI] [PubMed] [Google Scholar]
- Kim Y, Trussell LO. Ion channels generating complex spikes in cartwheel cells of the dorsal cochlear nucleus. J Neurophysiol. 2007;97:1705–1725. doi: 10.1152/jn.00536.2006. [DOI] [PubMed] [Google Scholar]
- Kőszeghy Á, Vincze J, Rusznák Z, Fu Y, Paxinos G, Csernoch L, Szücs G. Activation of muscarinic receptors increases the activity of the granule neurones of the rat dorsal cochlear nucleus—a calcium imaging study. Pflugers Arch. 2012;463:829–844. doi: 10.1007/s00424-012-1103-1. [DOI] [PubMed] [Google Scholar]
- Kuo SP, Trussell LO. Spontaneous spiking and synaptic depression underlie noradrenergic control of feed-forward inhibition. Neuron. 2011;71:306–318. doi: 10.1016/j.neuron.2011.05.039. [DOI] [PMC free article] [PubMed] [Google Scholar]
- Levey AI. Immunological localization of m1–m5 muscarinic acetylcholine receptors in peripheral tissues and brain. Life Sci. 1993;52:441–448. doi: 10.1016/0024-3205(93)90300-R. [DOI] [PubMed] [Google Scholar]
- Levey AI, Kitt CA, Simonds WF, Price DL, Brann MR. Identification and localization of muscarinic acetylcholine receptor proteins in brain with subtype-specific antibodies. J Neurosci. 1991;11:3218–3226. doi: 10.1523/JNEUROSCI.11-10-03218.1991. [DOI] [PMC free article] [PubMed] [Google Scholar]
- Levey AI, Edmunds SM, Koliatsos V, Wiley RG, Heilman CJ. Expression of m1–m4 muscarinic acetylcholine receptor proteins in rat hippocampus and regulation by cholinergic innervation. J Neurosci. 1995;15:4077–4092. doi: 10.1523/JNEUROSCI.15-05-04077.1995. [DOI] [PMC free article] [PubMed] [Google Scholar]
- Manzoor NF, Chen G, Kaltenbach JA. Suppression of noise-induced hyperactivity in the dorsal cochlear nucleus following application of the cholinergic agonist, carbachol. Brain Res. 2013;1523:28–36. doi: 10.1016/j.brainres.2013.05.025. [DOI] [PMC free article] [PubMed] [Google Scholar]
- Marrion NV, Tavalin SJ. Selective activation of Ca+-activated K+ channels by co-localized Ca+ channels in hippocampal neurons. Nature. 1998;395:900–905. doi: 10.1038/27674. [DOI] [PubMed] [Google Scholar]
- Mellott JG, Motts SD, Schofield BR. Multiple origins of cholinergic innervation of the cochlear nucleus. Neuroscience. 2011;180:138–147. doi: 10.1016/j.neuroscience.2011.02.010. [DOI] [PMC free article] [PubMed] [Google Scholar]
- Ngo-Anh TJ, Bloodgood BL, Lin M, Sabatini BL, Maylie J, Adelman JP. SK channels and NMDA receptors form a Ca+-mediated feedback loop in dendritic spines. Nat Neurosci. 2005;8:642–649. doi: 10.1038/nn1449. [DOI] [PubMed] [Google Scholar]
- Oertel D, Young ED. What's a cerebellar circuit doing in the auditory system? Trends Neurosci. 2004;27:104–110. doi: 10.1016/j.tins.2003.12.001. [DOI] [PubMed] [Google Scholar]
- Oertner TG, Sabatini BL, Nimchinsky EA, Svoboda K. Facilitation at single synapses probed with optical quantal analysis. Nat Neurosci. 2002;5:657–664. doi: 10.1038/nn867. [DOI] [PubMed] [Google Scholar]
- Petralia RS, Wang YX, Zhao HM, Wenthold RJ. Ionotropic and metabotropic glutamate receptors show unique postsynaptic, presynaptic, and glial localizations in the dorsal cochlear nucleus. J Comp Neurol. 1996;372:356–383. doi: 10.1002/(SICI)1096-9861(19960826)372:3<356::AID-CNE3>3.0.CO%3B2-1. [DOI] [PubMed] [Google Scholar]
- Petralia RS, Rubio ME, Wang YX, Wenthold RJ. Differential distribution of glutamate receptors in the cochlear nuclei. Hear Res. 2000;147:59–69. doi: 10.1016/S0378-5955(00)00120-9. [DOI] [PubMed] [Google Scholar]
- Petralia RS, Wang YX, Hua F, Yi Z, Zhou A, Ge L, Stephenson FA, Wenthold RJ. Organization of NMDA receptors at extrasynaptic locations. Neuroscience. 2010;167:68–87. doi: 10.1016/j.neuroscience.2010.01.022. [DOI] [PMC free article] [PubMed] [Google Scholar]
- Petralia RS, Wang YX, Mattson MP, Yao PJ. Subcellular distribution of patched and smoothened in the cerebellar neurons. Cerebellum. 2012;11:972–981. doi: 10.1007/s12311-012-0374-6. [DOI] [PMC free article] [PubMed] [Google Scholar]
- Picciotto MR, Higley MJ, Mineur YS. Acetylcholine as a neuromodulator: cholinergic signaling shapes nervous system function and behavior. Neuron. 2012;76:116–129. doi: 10.1016/j.neuron.2012.08.036. [DOI] [PMC free article] [PubMed] [Google Scholar]
- Raffaelli G, Saviane C, Mohajerani MH, Pedarzani P, Cherubini E. BK potassium channels control transmitter release at CA3-CA3 synapses in the rat hippocampus. J Physiol. 2004;557:147–157. doi: 10.1113/jphysiol.2004.062661. [DOI] [PMC free article] [PubMed] [Google Scholar]
- Requarth T, Sawtell NB. Neural mechanisms for filtering self-generated sensory signals in cerebellum-like circuits. Curr Opin Neurobiol. 2011;21:602–608. doi: 10.1016/j.conb.2011.05.031. [DOI] [PubMed] [Google Scholar]
- Roberts LE, Eggermont JJ, Caspary DM, Shore SE, Melcher JR, Kaltenbach JA. Ringing ears: the neuroscience of tinnitus. J Neurosci. 2010;30:14972–14979. doi: 10.1523/JNEUROSCI.4028-10.2010. [DOI] [PMC free article] [PubMed] [Google Scholar]
- Sabatini BL, Maravall M, Svoboda K. Ca2+ signaling in dendritic spines. Curr Opin Neurobiol. 2001;11:349–356. doi: 10.1016/S0959-4388(00)00218-X. [DOI] [PubMed] [Google Scholar]
- Sarter M, Parikh V, Howe WM. Phasic acetylcholine release and the volume transmission hypothesis: time to move on. Nat Rev Neurosci. 2009;10:383–390. doi: 10.1038/nrn2635. [DOI] [PMC free article] [PubMed] [Google Scholar]
- Sausbier U, Sausbier M, Sailer CA, Arntz C, Knaus HG, Neuhuber W, Ruth P. Ca+-activated K+ channels of the BK-type in the mouse brain. Histochem Cell Biol. 2006;125:725–741. doi: 10.1007/s00418-005-0124-7. [DOI] [PubMed] [Google Scholar]
- Schofield BR, Motts SD, Mellott JG. Cholinergic cells of the pontomesencephalic tegmentum: connections with auditory structures from cochlear nucleus to cortex. Hear Res. 2011;279:85–95. doi: 10.1016/j.heares.2010.12.019. [DOI] [PMC free article] [PubMed] [Google Scholar]
- Sedlacek M, Tipton PW, Brenowitz SD. Sustained firing of cartwheel cells in the dorsal cochlear nucleus evokes endocannabinoid release and retrograde suppression of parallel fiber synapses. J Neurosci. 2011;31:15807–15817. doi: 10.1523/JNEUROSCI.4088-11.2011. [DOI] [PMC free article] [PubMed] [Google Scholar]
- Storm JF. Action potential repolarization and a fast after-hyperpolarization in rat hippocampal pyramidal cells. J Physiol. 1987;385:733–759. doi: 10.1113/jphysiol.1987.sp016517. [DOI] [PMC free article] [PubMed] [Google Scholar]
- Vergara C, Latorre R, Marrion NV, Adelman JP. Calcium-activated potassium channels. Curr Opin Neurobiol. 1998;8:321–329. doi: 10.1016/S0959-4388(98)80056-1. [DOI] [PubMed] [Google Scholar]
- Womack MD, Chevez C, Khodakhah K. Calcium-activated potassium channels are selectively coupled to P/Q-type calcium channels in cerebellar Purkinje neurons. J Neurosci. 2004;24:8818–8822. doi: 10.1523/JNEUROSCI.2915-04.2004. [DOI] [PMC free article] [PubMed] [Google Scholar]
- Wouterlood FG, Mugnaini E. Cartwheel neurons of the dorsal cochlear nucleus: a Golgi-electron microscopic study in rat. J Comp Neurol. 1984;227:136–157. doi: 10.1002/cne.902270114. [DOI] [PubMed] [Google Scholar]
- Yao WP, Godfrey DA. Autoradiographic distribution of muscarinic acetylcholine receptor subtypes in rat cochlear nucleus. Audit Neurosci. 1996;2:241–255. [PMC free article] [PubMed] [Google Scholar]
- Yao W, Godfrey DA, Levey AI. Immunolocalization of muscarinic acetylcholine subtype 2 receptors in rat cochlear nucleus. J Comp Neurol. 1996;373:27–40. doi: 10.1002/(SICI)1096-9861(19960909)373:1<27::AID-CNE3>3.0.CO%3B2-F. [DOI] [PubMed] [Google Scholar]
- Zhao Y, Tzounopoulos T. Physiological activation of cholinergic inputs controls associative synaptic plasticity via modulation of endocannabinoid signaling. J Neurosci. 2011;31:3158–3168. doi: 10.1523/JNEUROSCI.5303-10.2011. [DOI] [PMC free article] [PubMed] [Google Scholar]
- Zhao Y, Rubio ME, Tzounopoulos T. Distinct functional and anatomical architecture of the endocannabinoid system in the auditory brainstem. J Neurophysiol. 2009;101:2434–2446. doi: 10.1152/jn.00047.2009. [DOI] [PMC free article] [PubMed] [Google Scholar]
- Zorrilla de San Martín J, Pyott S, Ballestero J, Katz E. Ca2+ and Ca2+-activated K+ channels that support and modulate transmitter release at the olivocochlear efferent-inner hair cell synapse. J Neurosci. 2010;30:12157–12167. doi: 10.1523/JNEUROSCI.2541-10.2010. [DOI] [PMC free article] [PubMed] [Google Scholar]