

Abstract
The ability of a number of flavonoids to induce glutathione (GSH) depletion was measured in lung (A549), myeloid (HL-60), and prostate (PC-3) human tumor cells. The hydroxychalcone (2′-HC) and the dihydroxychalcones (2′,2-, 2′,3-, 2′,4-, and 2′,5′-DHC) were the most effective in A549 and HL-60 cells, depleting more than 50% of intracellular GSH within 4 h of exposure at 25 µM. In contrast, the flavones chrysin and apigenin were the most effective in PC-3 cells, depleting 50–70% of intracellular GSH within 24 h of exposure at 25 µM. In general, these flavonoids were more effective than three classical substrates of multidrug resistance protein 1 (MK-571, indomethacin, and verapamil). Prototypic flavonoids (2′,5′-DHC and chrysin) were subsequently tested for their abilities to potentiate the toxicities of prooxidants (etoposide, rotenone, 2-methoxyestradiol, and curcumin). In A549 cells, 2′,5′-DHC potentiated the cytotoxicities of rotenone, 2-methoxyestradiol, and curcumin, but not etoposide. In HL-60 and PC-3 cells, chrysin potentiated the cytotoxicity of curcumin, cytotoxicity that was attenuated by the catalytic antioxidant manganese(III) meso-tetrakis(N-ethylpyridinium-2-yl)porphyrin (MnTE-2-PyP). Assessments of mitochondrial GSH levels mitochondrial membrane potential and cytochrome c release showed that the potentiation effects induced by 2′,5′-DHC and chrysin involve mitochondrial dysfunction.
Keywords: Glutathione (GSH), Multidrug resistance protein 1 (MRP1), Reactive oxygen species (ROS), Manganese porphyrin, HPLC-EC, Flow cytometry
Introduction
The neuroprotective, cardioprotective, and chemopreventive properties of dietary flavonoids are now well documented, yet their precise mechanism of action remains unclear [1–3]. Besides their anti- and prooxidant properties in vitro, they appear to exert modulatory effects in cells through alterations of protein and lipid kinase signaling pathways [2,3]. A number of flavonoids behave as prooxidants by inhibiting complexes I and II of the mitochondrial respiratory chain [4–6]. Moreover, several flavonoids induce glutathione (GSH) depletion through activation of multidrug resistance protein 1 (MRP1), an ATP-binding cassette (ABC) transporter [7–12]. Some MRP1 substrates, including daunorubicin, vincristine, and etoposide, are cotransported with GSH, whereas others, i.e., verapamil and flavonoids, are not [7,12].
GSH depletion as a potential strategy to sensitize cancer cells has been under investigation for over a decade [13–19]. Indeed, cancer cells tend to exhibit higher levels of intracellular GSH, possibly as an adaptive response to a higher metabolism and thus higher steady-state levels of reactive oxygen species (ROS) [18]. Although GSH is not synthesized in the mitochondria, these organelles concentrate cellular levels of GSH [20,21]. GSH depletion is usually achieved using inhibitors of GSH synthesis such as L-buthionine sulfoximine (BSO) [18]. Another interesting approach to sensitize cancer cells is by inducing MRP1-mediated GSH depletion, as has been suggested using verapamil [13,14]. It is worth noting that the expression of ABC transporters does not necessarily represent a barrier to anticancer drugs, but, depending on the cell type and the drug, may paradoxically potentiate the effect of a drug [22]. MRP-mediated GSH efflux is likely a “downside” of MRP expression, particularly in cancer cells, since they tend to exhibit higher levels of ROS and to overexpress MRPs [18,23]. In fact, it is likely that these two processes may be linked and exploited as a selective therapeutic target.
A variety of naturally occurring compounds induce programmed cell death (apoptosis) in cancer cells by enhancing the production of mitochondrial ROS, i.e., superoxide (O2•−) and hydrogen peroxide (H2O2), followed by the formation of the mitochondrial permeability transition pores and the release of cytochrome c [24–28]. This is the case for the endogenous human estrogen metabolite, 2-methoxyestradiol (2-ME), which is currently being evaluated as an anticancer agent in multiple tumor types including prostate cancer [29–31]. How 2-ME stimulates ROS production remains unclear. The most reasonable hypothesis to date is the uncoupling of the mitochondrial respiratory chain by inhibiting complex I, as in the case of rotenone [32–34]. Curcumin is another natural compound that has structural similarities with rotenone and 2-ME (i.e., O-methylated catechol), and has been associated with oxidative stress in cancer cells [35]. The topoisomerase inhibitor etoposide has also been associated with mitochondrial-mediated apoptosis, although through activation of caspase 2 rather than direct interference with the mitochondrial respiratory chain [36,37].
The aims of this study were: (1) to determine the structural requirements of flavonoid-induced GSH depletion in multiple human tumor cell types; and (2) to explore whether this effect sensitizes cancer cells to treatment with prooxidants such as etoposide, rotenone, 2-ME, and curcumin. We measured the intracellular GSH levels and cytotoxicity induced by a number of selected flavonoids in lung (A549), myeloid (HL-60), and prostate (PC-3) human tumor cells (Fig. 1). Our results showed that: (1) flavonoids are potent inducers of GSH depletion in A549, HL-60, and PC-3 cells; (2) flavonoids show unique structural requirements for affecting GSH depletion; (3) flavonoids can potentiate the cytotoxicity of prooxidants in tumor cells; and (4) potentiation effects involve mitochondrial dysfunction.
Fig. 1.

Flavonoids tested.
Materials and methods
Chemicals and reagents
Chalcone, 2-, 2′-, 4-, and 4′-hydroxychalcones, 2′,2-, 2′,3-, 2′,4-, 2′,4′-, and 2′,5′-dihydroxychalcones, 2′,4′,4- and 2′,3′,4′-trihydroxychalcones, flavone, 5-hydroxyflavone, 7-hydroxyflavone, 7-methoxyflavone, and galangin were purchased from Indofine Chemicals Company, Inc. (Hillsborough, NJ). Chrysin, apigenin, kaempferol, quercetin, genistein, biochanin A, naringenin, baicalein, fisetin, morin, myricetin, (−)-epicatechin, rutin, resveratrol, 2-methoxyestradiol, 2-hydroxyestradiol, β-estradiol, curcumin, rotenone, etoposide, (+)-verapamil, indomethacin, digitonin, pyruvate, phosphoric acid, meta-phosphoric acid, sodium phosphate (monobasic), Triton X-100, phenylmethylsulfonyl fluoride (PMSF), ammonium acetate, adenosine 5′-diphosphate (ADP), α-ketoglutaric acid, L-lactic dehydrogenase (LDH), D-mannitol, EDTA, NADH, K2HPO4, KH2PO4, Hepes, DMSO, and DMF were from Sigma-Aldrich (St. Louis, MO). Tris-HCl, perchloric acid, and methanol were from Fisher (Pittsburgh, PA). MK-571 was from Biomol (Plymouth Meeting, PA) and cyanidin from Extrasynthese (Genay, France). Rhodamine 123 was from Kodak (Rochester, NY) and dihydroethidium (hydroethidine) from Molecular Probes (Eugene, OR). Phosphate-buffered saline (PBS) was from Cellgro (Herndon, VA). Monobromobimane (mBBr) was from Calbiochem (San Diego, CA). (Des-Gly)-glutathione was from Bachem (Torrance, CA). Protease inhibitor cocktail tablets supplemented with EDTA were from Roche Diagnostics (Indianapolis, IN). Manganese(III) meso-tetrakis(N-ethylpyridinium-2-yl)porphyrin (MnTE-2-PyP) was prepared as described previously [38].
Cell lines and culture conditions
Human lung epithelial (A549), human leukemia (HL-60), and human prostate (PC-3) tumor cells were purchased from ATCC (Manassas, VA). A549 and PC-3 cells were grown in Ham’s F12 medium (F12) and Kaighn’s modification of Ham’s F12 medium (F12K) with 2 mM L-glutamine (ATCC), respectively, supplemented with 10% fetal bovine serum (FBS) and 1% pen/strep (10,000 unit, Cellgro). HL-60 cells were grown in Iscove’s modified Dulbecco’s medium with 4 mM L-glutamine (ATCC) supplemented with 20% FBS and 1% pen/strep. Cells were all grown in T-75 flasks at 37°C and 5% CO2 air atmosphere for mitochondrial isolation and in 24-well plates for GSH levels and LDH release measurements. All the compounds were added from 10 mM stock solutions in DMF, except for kaempferol, quercetin, genistein, biochanin A, naringenin, baicalein, fisetin, morin, myricetin, (−)-epicatechin, rutin, and resveratrol, which were added from 10 mM stock solutions in ethanol, and MnTE-2-PyP from a 10 mM stock solution in distilled water.
Mitochondrial isolation and purity
Isolation of HL-60 and A549 mitochondria was achieved through differential centrifugation as previously described [39]. Following drug treatment, cells were pelleted by centrifugation (2000g for 10 min at 4°C), resuspended in PBS, and spun (2000g for 10 min at 4°C) to yield a final cell pellet. The pellet was resuspended in 0.55 ml of ice-cold hypotonic buffer (10 mM NaCl, 1.5 mM MgCl2, 10 mM Tris-HCl, pH 7.5). After 10 min, the cell suspension was homogenized (Kontes glass homogenizer, Fisher-Scientific, Fair Lawn, NJ). Immediately after homogenization, 0.4 ml of 2.5× mannitol-sucrose buffer was added (525 mM mannitol, 175 mM sucrose, 12.5 mM Tris-HCl, 2.5 mM EDTA, pH 7.5). The amount of 0.4 ml of ice-cold single-strength mannitol-sucrose buffer (210 mM mannitol, 70 mM sucrose, 5 mM Tris-HCl, 1 mM EDTA, pH 7.5) was added and the contents were divided into two 1.5-ml centrifuge tubes. Cellular debris was pelleted by centrifugation at 1300g for 10 min at 4°C. Centrifugation was repeated twice. Finally, mitochondria from the supernatant were isolated by centrifugation at 17,000g for 15 min at 4°C. The mitochondrial pellet was washed and centrifuged at 17,000g for 15 min at 4°C to reduce any cytosolic contamination. The cytosolic fraction was used for immunoblotting of cytochrome c.
Mitochondrial enrichment was determined by the relative activity of a cytosolic enzyme marker (LDH) and a mitochondrial matrix enzyme marker (glutamate dehydrogenase, GDH) in the respective fractions. LDH activity in the mitochondrial fraction reflects cytosolic contamination and GDH activity indicates the efficiency of the isolation procedure. LDH activity was determined using the procedure described below. GDH activity was determined using an assay based on previously published methods [39]. Briefly, a solution containing 100 µM NADH and 1 mM ADP were mixed with 100 mM ammonium acetate as a source of ammonium ions. An aliquot of the sample was added and followed by the addition of 1 unit of LDH to eliminate pyruvate. The assay quantified GDH activity based on the consumption of NADH in the transamination of α-ketoglutarate (oxoglutarate). To initiate the reaction, 6.9 mM α-ketoglutarate was added and absorbance at 340 nm monitored. GDH activity in the samples was calculated based on an extinction coefficient (ε = 6.2 L/mmol × cm) for NADH where 1 unit of activity is defined as 1 µmol NADH consumed/minute. GDH activity in the mitochondrial pellet was nearly 10-fold that found in the cytosolic fraction. Conversely, LDH activity in the mitochondrial pellet represented less than 5% of the total cellular LDH activity (data not shown). Thus, the mitochondrial preparations used in this study were greatly enriched in mitochondria and relatively free of cytosolic contamination.
Intracellular levels of GSH
Intracellular GSH levels were determined by HPLC-EC [40]. Cultured cells from 24-well plates were washed once with 1 ml of PBS and then resuspended in 0.5 ml of distilled water with 40 µM digitonin (from a 2 mM stock solution in DMSO) for 30 min at room temperature. Then, 50 µl of 10% meta-phosphoric acid was added (1% final concentration) to the samples that were sonicated for 2 min and centrifuged at 20,000g for 10 min, and 0.2 ml of supernatant placed in vials for HPLC analysis. The HPLC column used was Synergi 4u Hydro-RP 80A (150 × 4.6 mm) from Phenomenex (Torrance, CA) and the mobile phase a sodium phosphate buffer (125 mM sodium phosphate monobasic, pH 3, adjusted with phosphoric acid) and 0.9% methanol. The flow rate was 0.5 ml min−1. The retention time for GSH under these conditions was 7.5 min. The HPLC instrument was from ESA, Inc. (Chelmsford, MA), equipped with an autosampler (Model 540) and a Coul array detector (Model 5600A). The potential applied was +0.75 V vs H/Pd electrode, and the injection volume 5 µl.
Extracellular and mitochondrial levels of GSH
We could not reliably use the HPLC-EC method to detect extracellular GSH in the culture media supernatants of A549, HL-60, and PC-3 cells, so we switched to a HPLC-FD method of GSH analysis after derivatization with mBBr [41]. HPLC-FD also appeared to be more sensitive and reliable when measuring lower levels of GSH, for instance, from the mitochondria. Briefly, 90 µl of supernatant or mitochondrial fraction was mixed with 90 µl of KPBS buffer (50 mM potassium phosphate buffer, 17.5 mM EDTA, 50 mM serine, 50 mM boric acid, pH 7.4), 10 µl of reduced (des-Gly)-glutathione (0.1 mM stock solution) as internal standard and 10 µl of mBBr (5 mM stock solution in acetonitrile). The mixture was incubated in the dark at room temperature for 30 min, and the reaction was stopped by the addition of 10 µl of 70% perchloric acid. The samples were centrifuged at 16,000g for 10 min and 0.18 ml of supernatant was placed in vials for HPLC analysis. The HPLC column used was Synergi 4u Hydro-RP 80A (C18) (150 × 4.6 mm) from Phenomenex (Torrance, CA) and the mobile phase a mixture of 1% acetic acid in H2O (pH adjusted to 4.25 using NH4OH) with 7% acetonitrile. The flow rate was 1 ml min−1 and the injection volume 1 µl. The detector excitation and emission wavelengths were 390 and 480 nm, respectively. The retention time for the GSH derivative was 9.5 min. The HPLC instrument was from Hitachi (San Jose, CA) equipped with an autosampler (Model L-2200) and a fluorometric detector (Model L-2480).
Immunoblotting of MRP1
Membrane proteins were enriched by differential centrifugation. Briefly, cells were centrifuged at 2000g for 10 min and the cells resuspended in buffer A (250 mM sucrose, 10 mM Tris base, pH 7.5, supplemented with protease inhibitor cocktail with EDTA). Cells were then homogenized and centrifuged at 500g for 10 min. The supernatant was transferred to an ultracentrifuge tube and centrifuged at 136,000g for 30 min. The pellet was resuspended in buffer B (300 mM sucrose, 10 mM Hepes, 40 µg/ml PMSF, pH 7.5). A precast 7.5% SDS PAGE (Bio-Rad Laboratories, Hercules, CA) was loaded with 50 µg protein per well. Samples were run at 150 V for 60 min and transferred to PVDF-plus membrane (Osmonics, Westborough, MA) at 100 V for 1 h. Membranes were blocked for 1 h at room temperature in TBS-T and 10% horse serum. Monoclonal anti-MRP1 primary antibody (2 µg/ml, mouse IgG1 isotype, Sigma-Aldrich, St. Louis, MO) was applied for 2.5 h with gentle rocking. Secondary antibody (peroxidase-conjugated Affini-Pure goat anti-mouse IgG, Jackson ImmunoResearch Laboratories, Inc., West Grove, PA) was diluted 1:30,000 in TBS-T and applied for 30 min with gentle rocking. All wash steps were performed in triplicate for 10 min in TBS-T. MRP1 was detected using ECL Plus Western blotting detection reagents (Amersham Biosciences, Buckinghamshire, UK).
Immunoblotting of cytochrome c
The cytosolic fractions resulting from the mitochondrial purification were concentrated using Centricon YM-10 filters (Millipore, Bedford, MA). A precast gradient 4–20% SDS PAGE (Bio-Rad Laboratories, Hercules, CA) was loaded with 30 µg protein per well. The samples were run and transferred, and the membranes blocked using the same conditions as described above. Monoclonal anti-cytochrome c primary antibody (1 µg/ml, mouse IgG2b isotype, BD Biosciences, San Jose, CA) was applied for 2.5 h with gentle rocking. Secondary antibody (peroxidase-conjugated AffiniPure goat anti-mouse IgG, Jackson ImmunoResearch Laboratories, Inc.) was diluted 1:40,000 in TBS-T and applied for 30 min with gentle rocking. Cytochrome c was detected using ECL Plus Western blotting detection reagents (Amersham Biosciences). Following cytochrome c detection, membranes were submerged in stripping buffer (100 mM 2-mercaptoethanol, 2 % SDS, 62.25 mM Tris-HCL, pH 6.7) and incubated at 55°C for 45 min with occasional agitation. Membranes were reprobed for β-actin as an internal standard using monoclonal anti-β-actin antibody (1:8000, mouse IgG1 isotype, Sigma-Aldrich). Identical secondary antibody was diluted 1:40,000 in TBS-T and applied for 30 min with gentle rocking.
Assessment of cytotoxicity
Membrane integrity of A549, HL-60, and PC-3 cells was used as an index of drug-induced cytotoxicity, and was assessed by monitoring the release of cytosolic lactate dehydrogenase. LDH activity was measured in the culture medium and cell lysates (50 mM Hepes, Triton X-100 0.5%, pH 7) using a plate reader format as previously described [42]. Briefly, 5 µl of cell culture supernatant and lysates was incubated with 0.24 mM NADH in a Tris/NaCl, pH 7.2, buffer in 96-well plates for 5 min at 25°C. The reaction was started by the addition of 9.8 mM pyruvate and the consumption of NADH followed at 340 nm for 5 min at 30°C. Percentage LDH release was calculated by the following: (supernatant LDH/supernatant LDH + lysate LDH) × 100.
Flow cytometry
The dye rhodamine 123 (Rh123) is currently used to assess changes in the mitochondrial membrane potential [43]. Hydroethidine (HE) has been widely used to detect intracellular O2•− by flow cytometry, although it has been shown recently that this method is not quantitative [44]. Briefly, untreated and treated HL-60 and A549 cells (approximately 106 and 2 × 10⁵, respectively) were exposed to either 2 µM Rh123 or 1 µM HE (from 1 mM stock solutions in DMSO) for 30 min and then washed once with 1 ml ice-cold PBS. Cells were resuspended in 0.5 ml ice-cold PBS, and analyzed within 30 min using the FL1 (530 ± 30 nm) and FL2 (485 ± 42 nm) channels for the detection of Rh123 and the oxidation products of HE, respectively, and a FACSCalibur flow cytometer from Becton Dickinson Biosciences (San Jose, CA). The total number of cell counts were 25,000 and 10,000 for HL-60 and A549 cells, respectively.
Statistical analysis
Data are presented as means + standard error. Each experimental group consisted of an n ≥ 3 and the results were duplicated at least once. Data were subsequently analyzed for significant differences using ANOVA analysis coupled with a Tukey’s range test where significance was set at P < 0.05 (Prizm v.4, GraphPad, San Diego, CA).
Results
Flavonoid-mediated modulation of intracellular GSH levels
Depletion of intracellular GSH levels induced by a number of flavonoids (Fig. 1) and other compounds (MK-571, indomethacin, and verapamil) in A549, HL-60, and PC-3 cells are reported in Tables 1, 2, and 3. The ability of flavonoids to induce GSH depletion varied dramatically from one cancer cell type to another. Using chrysin as a flavone example, 50% depletion of intracellular GSH required 25 µM of chrysin and 2 h of treatment in A549 cells, 24 h using the same concentration in PC-3 cells, and 50 µM of chrysin and 24 h in HL-60 cells.
Table 1.
Intracellular GSH levels in A549 cells after 2 and 4 h treatmenta
| Compound [25 µM] | 2 hb | 4 h |
|---|---|---|
| 2′,2-DHC | <5 | <5 |
| 2′-HC | <5 | <5 |
| 2′,5′-DHC | <5 | <5 |
| 2-HC | <5 | <5 |
| 4-HC | 5.5 ± 0.4 | <5 |
| 2′,4′,4-THC | 6.8 ± 0.2 | <5 |
| 2′,4′-DHC | 22.0 ± 1.8 | <5 |
| 4′-HC | 35.6 ± 2.9 | <5 |
| Chrysin | 47.2 ± 4.0 | 5.2 ± 0.5 |
| Chalcone | 48.5 ± 2.1 | nd |
| 7-HF | 58.1 ± 1.4 | nd |
| MK-571 | 62.6 ± 4.9 | <5 |
| Galangin | 62.9 ± 0.4 | nd |
| 2-HE | 69.0 ± 0.5 | nd |
| Indomethacin | 71.4 ± 2.8 | 7.8 ± 1.2 |
| 7-MF | 78.2 ± 2.4 | nd |
| Apigenin | nd | 17.1 ± 1.4 |
| Kaempferol | nd | 29.6 ± 0.9 |
| Flavone | 89.7 ± 0.6 | 29.7 ± 4.8 |
| Genistein | nd | 34.8 ± 1.1 |
| Biochanin A | nd | 36.8 ± 0.9 |
| 5-HF | nd | 44.7 ± 3.4 |
| Quercetin | nd | 51.0 ± 0.7 |
Values reported as % compared to control ± standard error (n = 3) (nd, not determined).
See Fig. 2A using 10 µM.
Table 2.
Intracellular GSH levels in HL-60 cells after 4 and 24 h treatmenta
| Compound [25 µM] | 4 h | 24 h |
|---|---|---|
| 2′-HC | 29.7 ± 5.2 | <5 |
| 2′,5′-DHC | 31.2 ± 3.5 | <5 |
| 2′,2-DHC | 44.0 ± 2.5 | <5 |
| 2-HC | 52.2 ± 1.7 | <5 |
| MK-571 | nd | 39.6 ± 1.8 |
| Indomethacin | nd | 48.6 ± 1.2 |
| Verapamil | nd | 63.5 ± 3.4 |
| 2′,4′-DHC | nd | 88.8 ± 6.4 |
| Chalcone | nd | 100.1 ± 2.5 |
Values reported as % compared to control ± standard error (n = 3) (nd, not determined).
Table 3.
Intracellular GSH levels in PC-3 cells after 24 h treatmenta
| Compound [25 µM] | 24 h |
|---|---|
| Apigenin | 32.8 ± 6.3 |
| Chrysin | 57.6 ± 2.5 |
| MK-571 | 57.7 ± 4.4 |
| 7-HF | 62.7 ± 1.2 |
| 2′,5′-DHC | 67.0 ± 9.3 |
| Indomethacin | 75.0 ± 9.0 |
| Verapamil | 77.7 ± 2.9 |
| Flavone | 83.5 ± 0.8 |
| 2′-HC | 93.5 ± 11.5 |
Values reported as % compared to control ± standard error (n = 3).
The tumor cell response to hydroxychalcones (HCs) and dihydroxychalcones (DHCs) was higher in A549 than HL-60 cells, showing that structural requirements can also dramatically vary from one cell type to another (Tables 1 and 2). 2′-HC, and 2′,2-, 2′,4- 2′,3-, and 2′,5′-DHC were the most effective HCs for depleting intracellular GSH in A549 and HL-60 cells. In A549 cells, 2 h of exposure to 10 µM of these compounds resulted in 75 to 90% depletion (Fig. 2A), and in HL-60 cells, 25 µM and 4 h resulted in 55 to 70% depletion (Table 2). It is worth noting that in hepatocytes, a similar effect was obtained with higher amounts of HCs (over 100 µM and 2 h of treatment), and that 2′,3′,4′-trihydroxychalcone was the most effective [10]. The lack of hydroxyl groups (chalcone) or the presence of more than two hydroxyl groups decreased this effect in the three cell types (Tables 1 and 2). These data reveal the importance of a hydroxyl group in the 2′ position on chalcones. In contrast, a hydroxyl group in position 4′ markedly decreased the effect in A549 cells (Table 1), and actually produced an increase in intracellular GSH levels in HL-60 and PC-3 cells (215 and 164% compared to control, respectively, using 25 µM 4′-HC and 24 h of treatment) (Fig. 2B). In addition, the cell response to chalcones was lowered by the addition of more than two hydroxyl groups.
Fig. 2.

Modulation of GSH levels by flavonoids. (A) Intracellular GSH levels (% compared to control) induced by hydroxychalcones (HCs) in A549 cells (10 µM, 2 h treatment) (n = 3). (B) Intracellular GSH levels (% compared to control) induced by chalcone (Cha) and HCs in HL-60 cells (25 µM, 24 h treatment); 4′-HC produced an accumulation of GSH. (C) In A549 cells, as shown using chrysin (Chr), apigenin (Api), kaempferol (Kae), and quercetin (Que) (25 µM), additional hydroxyl groups decreased the GSH depletion effect. (D) Intracellular and extracellular GSH concentrations (1 ml final volume) of A549 cells with chalcone (Cha) and 2′-HC (25 µM, 2 h treatment). Bars with different letters were statistically different from one another (P < 0.05).
Chrysin was the most effective flavone-like structure for inducing GSH depletion in A549 and HL-60 cells, whereas in PC-3 cells, apigenin was most effective (Tables 1, 2, and 3). 7-Hydroxyflavone (7-HF) was almost as effective as chrysin, whereas 5-hydroxyflavone (5-HF) was much less effective, thus revealing the importance of one hydroxyl group in position 7. 7-Methoxyflavone (7-MF) was less effective than 7-HF but more effective than flavone (Table 1). The cell response to hydroxyflavones (HFs) was generally lowered by: (1) the addition of hydroxyl groups (Table 1, Fig. 2C); (2) the loss of the ketone group in position 4 (catechins or cyanidins); (3) the loss of the double bond in position 2–3 (flavanones); and (4) O-glycosylation (rutin) (data not shown).
The MRP1 substrates MK-571, indomethacin, and verapamil were also tested and appeared less effective for inducing intracellular GSH depletion than HCs in A549 and HL-60 cells (Tables 1 and 2) [13,14,45,46]. In A549 cells, MK-571 was also less effective than chrysin and 7-HF. In PC-3 cells, apigenin was more effective than chrysin, MK-571, indomethacin, and verapamil (Table 3). Overall, in the three tumor cell types, at least one flavonoid was more effective than the three MRP1 substrates tested.
In order to verify that the GSH depletion induced by HCs in A549 cells was due to GSH efflux, we measured extracellular GSH levels in A549 cells after 2 h of treatment with chalcone and 2′-HC (25 µM), and the results showed increased levels of GSH in the supernatants (Fig. 2D). The difference of total GSH between the untreated and the treated samples may result from intracellular GSH oxidation into glutathione disulfide (GSSG), glutathione-protein adducts, but also from hydrolysis of extracellular GSH by γ-glutamyl transpeptidase [47].
Although a differential uptake of flavonoids by A549, HL-60, and PC-3 cells cannot be discarded, the differential response of the three cell types to HCs vs HFs suggests that these two groups of molecules are preferentially recognized by different MRPs. MRP1 expression was compared in A549, HL-60, and PC-3 cells. Running the same amount of membrane enriched proteins (50 µg), MRP1 was abundantly detected in A549 cells, whereas barely detected in PC-3 cells, and not detected in HL-60 cells (Fig. 3). This result suggests a correlation between MRP1 expression and GSH depletion induced by HFs, and lends support to our hypothesis that HC-induced GSH depletion is mediated by distinct MRPs.
Fig. 3.
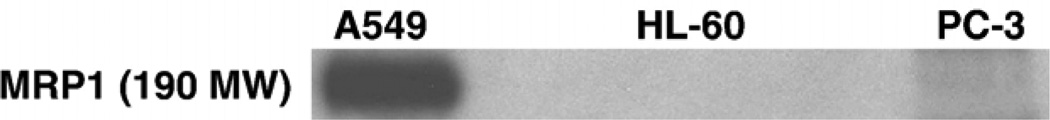
Immunoblotting of multidrug resistance protein 1 (MRP1) in A549, HL-60, and PC-3 cells (50 µg of membrane-enriched protein load per well).
In addition to 4′-HC, other compounds examined in this study had differential effects on cellular GSH levels within the three tumor cell types. For instance, morin, cyanidin, and (−)-epicatechin (50–75 µM) stimulated an increase in intracellular GSH in PC-3 cells, but not in A549 or HL-60 cells (data not shown). 2-HE was unexpectedly effective for inducing intracellular GSH depletion in A549 cells, whereas in HL-60 and PC-3 cells it produced an increase of intracellular GSH levels (data not shown). Curcumin also markedly increased intracellular GSH levels in HL-60 and PC-3 cells (Table 4).
Table 4.
Intracellular GSH levels and cytotoxicity induced by a number of selected flavonoids, and anticancer agents in three human tumor cell typesa
| Compound | A549 | HL-60 | PC-3 | |||
|---|---|---|---|---|---|---|
| Int. GSH % con. [µM] |
LDH rel. % con. [µM] |
Int. GSH % con. [µM] |
LDH rel. % con. [µM] |
Int. GSH % con. [µM] |
LDH rel. % con. [µM] |
|
| Chalcone | <5 [25] | 150 [75] | 100 [25] | 236 [50] | 119 [25] | 229 [50] |
| 2′,5′-DHC | <5 [25] | 273 [75] | <5 [25] | 310 [50] | 67 [25] | 246 [50] |
| Chrysin | <5 [25] | 225 [75] | 40 [50] | 195 [50] | 58 [25] | 132 [50] |
| Apigenin | 9 [25] | 284 [75] | 66 [50] | 259 [50] | 33 [25] | 142 [50] |
| Kaempferol | 7 [25] | 173 [75] | 75 [50] | 128 [50] | 77 [25] | 115 [50] |
| Quercetin | 36 [25] | 175 [75] | 94 [50] | 157 [50] | 95 [25] | 80 [50] |
| Genistein | 5 [25] | 350 [75] | 57 [75] | 160 [50] | 81 [25] | 131 [50] |
| 2-ME | 49 [50] | 150 [75] | 41 [25] | 265 [25] | 68 [25] | 128 [50] |
| Curcumin | 53 [50] | 140 [75] | 221 [25] | 180 [25] | 170 [25] | 180 [50] |
| Rotenone | 53 [50] | 170 [75] | <5 [25] | 421 [25] | 74 [25] | 180 [50] |
| Etoposide | 55 [50] | 294 [50] | 7 [25] | 290 [25] | 83 [25] | 124 [50] |
Intracellular GSH levels are reported as % compared to control after 24 h treatment, with standard error ≤ ±10% (n = 3), and toxicities as % LDH release compared to control after 48 h treatment, with standard error ≤ ±10% (n = 4), concentration of compounds shown in brackets as µM.
Potentiation of tumor cell cytotoxicity
GSH depletion by itself is not a major cause of cytotoxicity. Chrysin, for instance, was a very potent inducer of intracellular GSH depletion in A549 cells, but showed relatively low toxicity after 48 h of treatment. Apigenin and genistein, which were reported to be inhibitors of complex I of the mitochondrial respiratory chain, were relatively toxic in the three cell types, whereas kaempferol was not an inhibitor of complex I and was less toxic (Table 4) [5]. However, the contribution of MRP-mediated GSH depletion to the toxicity of flavonoids and other prooxidants cannot be discarded. For instance, rotenone and etoposide were relatively effective for depleting GSH as well as toxic in HL-60 cells (Table 4). HCs were markedly more toxic than HFs in the three tumor cell types, although this effect did not necessarily rely on GSH efflux, since they induced little or no GSH depletion in PC-3 cells (Table 4). The toxicities of 2′-HC and 2′,5′-DHC (10 µM) were attenuated by the catalytic antioxidant MnTE-2-PyP (25 µM) in the three cell types, supporting that the toxicity of HCs relies on their ability to trigger oxidative stress (data in HL-60 cells shown in Fig. 4) [10,48].
Fig. 4.

In HL-60 cells, the metalloporphyrin MnTE-2-PyP (Por, 30 µM) attenuate the toxicity of the hydroxychalcones 2′-HC and 2′,5′-DHC (10 µM). MnTE-2-PyP alone had no effect. Percentage of LDH release was used as an index of cytotoxicity (48 h treatment) (n = 4). Bars with different letters were statistically different from one another (P < 0.05).
The abilities of 2′,5′-DHC and chrysin to potentiate the toxicities of etoposide, rotenone, curcumin, and 2-ME were examined in A549, HL-60, and PC-3 cells after 48 h of treatment. Although curcumin-glutathione adducts have been reported to be substrates of MRP1 and MRP2 [49], curcumin produced an accumulation of intracellular GSH in HL-60 and PC-3 cells, thus making it a valuable tool to study the effects of inducers of GSH depletion (Table 4). Chrysin (25 µM) potentiated the toxicity of curcumin (25 µM) in HL-60 cells, whereas this toxicity was attenuated by MnTE-2-PyP (25 µM) (Fig. 5A). Chalcone and MK-571 had a similar effect as chrysin on the toxicity of curcumin (data not shown). When measuring intracellular GSH levels, chrysin also induced GSH depletion in the presence of curcumin (Fig. 5B). PC-3 cells were particularly sensitive to curcumin-induced toxicity, which was also potentiated by chrysin (Fig. 5C). The combination of curcumin and chrysin resulted in GSH depletion in PC-3 cells as well (data not shown). Apigenin potentiated the toxicity of curcumin, but unexpectedly less than chrysin. Chrysin (10–20 µM) potentiated the toxicities of rotenone (20 µM), 2-ME (50 µM), and etoposide (40 µM) in PC-3 cells. In A549 cells, 2′,5′-DHC (10 µM) potentiated the toxicities of rotenone (50 µM), curcumin (50 µM), and 2-ME (50 µM), but not of etoposide (10 µM) (Fig. 5D). Chrysin also failed to potentiate etoposide’s toxicity in this cell type. HCs were relatively toxic in HL-60 cells and may explain why they did not further potentiate prooxidant toxicities.
Fig. 5.

Inducers of GSH depletion potentiated the toxicities of prooxidants; percentage of LDH release was used as an index of cytotoxicity (48 h treatment). (A) In HL-60 cells, the metalloporphyrin MnTE-2-PyP (Por, 25 µM) attenuated the toxicity of curcumin (Cur, 25 µM), whereas chrysin (Chr, 25 µM) potentiated it (n = 4). (B) Intracellular GSH was measured using the same concentrations and time; curcumin induced an accumulation of GSH, whereas the addition of chrysin induced a depletion of GSH (n = 3). (C) In PC-3 cells, chrysin (Chr, 10 µM) potentiated the toxicity of curcumin (Cur, 20 µM) and rotenone (Rot, 20 µM) (n = 4). (D) In A549 cells, 2′,5′-DHC (DHC, 10 µM) potentiated the toxicity of rotenone (Rot, 50 µM), but not of etoposide (Eto, 10 µM) (n = 4). Bars with different letters were statistically different from one another (P < 0.05).
We further examined the involvement of the mitochondria in the potentiation effects observed between prooxidants and flavonoids in A549 and HL-60 cells. We first assessed whether the observed flavonoid-mediated cellular GSH depletion affected mitochondrial GSH levels, which are known to be at least as high as cytosolic levels [21]. Treatment of A549 cells with 2′,5′-DHC (10 µM) for 24 h decreased mitochondrial levels of GSH by 50%, whereas 48 h of treatment of HL-60 cells with chrysin (25 µM) were needed to detect a 10% decrease in mitochondrial levels of GSH (Fig. 6). The delay between the decrease in cytosolic and mitochondrial levels of GSH is known as the “mitochondrial resistance” to decreased levels of cytosolic GSH [21]. In order to determine whether the potentiation effects observed in A549 and HL-60 cells were mediated by the mitochondria, we assessed the effects of the combinations of 2′,5′-DHC and rotenone in A549 cells, and chrysin and curcumin in HL-60 cells, on two markers of mitochondrial-mediated apoptosis, i.e., the mitochondrial membrane potential (MMP) and cytochrome c release from the mitochondria. The MMP was assessed using flow cytometry and rhodamine 123 as dye, whereas the cytochrome c release was detected by immunoblotting. The analyses of A549 cells by flow cytometry showed a decrease in rhodamine 123 fluorescence when combining 2′,5′-DHC (10 µM) and rotenone (50 µM) within 24 h of treatment, indicating a loss of MMP. In contrast, combining chrysin and curcumin (25 µM) in HL-60 cells induced a major shift in fluorescence between 24 and 48 h of treatment (Fig. 7). Also, an increase in cytochrome c release was observed when combining 2′,5′-DHC (10 µM) and rotenone (50 µM) in A549 cells after 48 h treatment (Fig. 8A). Similar effects were seen when combining chrysin (25 µM) and curcumin (25 µM) in HL-60 cells (Fig. 8B).
Fig. 6.

2′,5′-DHC (10 µM) induced a 50% decrease in mitochondrial levels of GSH in A549 cells after 24 h treatment (A), whereas chrysin (Chr, 25 µM) induced a 10% decrease in mitochondrial levels of GSH in HL-60 cells after 48 h treatment (B). Bars with different letters were statistically different from one another (P < 0.05).
Fig. 7.

Assessment of the mitochondrial membrane potential (MMP) by flow cytometry using rhodamine 123 (Rh123) fluorescence measured on channel FL1. Treatments of A549 cells with rotenone (Rot, 50 µM) and HL-60 cells with curcumin (Cur, 25 µM) induced a decrease in Rh123 fluorescence (left shifted), indicating a loss of MMP as compared to controls (shadowed). In the first case, a major change occurred within 24 h treatment, whereas in the second, a major change occurred between 24 and 48 h treatment. Treatments of A549 cells with 2′,5′-DHC (DHC, 10 µM) or HL-60 cells with chrysin (Chr, 25 µM) did not induce any change in MMP (doted lines); the combination of 2′,5′-DHC and rotenone, and the combination of chrysin and curcumin (semidotted lines), further decreased the MMP.
Fig. 8.

Immunoblotting of the cytochrome c released by the mitochondria in A549 cells treated with rotenone (rot, 50 µM) and rotenone + 2′,5′-DHC (DHC, 10 µM) (A), and in HL-60 cells treated with curcumin (cur, 25 µM) and curcumin + chrysin (chr, 25 µM) (B) (48 h treatment, n = 3). Rotenone and chrysin alone (in A549 and HL-60 cells, respectively) had no effect (not shown). β-Actin was used as protein loading control.
The production of superoxide (O2•−) induced by the presence of curcumin in HL-60 cells was also analyzed by flow cytometry [44]. Curcumin (10 µM), an inducer of increased levels of GSH in HL-60 cells, induced an increase in fluorescence, and thus an apparent elevation in O2•− production, within 1 h of treatment (Fig. 9A). This early event was previously observed with 2-ME in HL-60 cells and believed to trigger the apoptotic cascade of events [30]. As shown in Fig. 9B, the increased O2•− levels induced by curcumin gradually decreased over time. When cells were pretreated with the catalytic antioxidant MnTE-2-PyP (30 µM) for 2 h, lower levels of O2•− were detected (Fig. 9A), which may explain the protective effect of MnTE-2-PyP (Fig. 5A). Chrysin was also reported to inhibit complex I of the mitochondrial respiratory chain [5]; yet, at 25 µM, it induced little change in O2•− levels and was not toxic (Figs. 5A and 9B). Rotenone (5 µM) also induced an increase in O2•− levels in HL-60 cells (not shown), but much less markedly in A549 cells (using up to 50 µM), making this model difficult to analyze (data not shown). If the potentiation effects induced by chrysin in HL-60 cells were due to inhibition of the efflux of curcumin, higher levels of O2•− would be expected from adding the chrysin. However, no increase in O2•− levels was observed, but rather a decrease at 4 h treatment (Fig. 9B), suggesting that the potentiation effect was not solely mediated by O2•−.
Fig. 9.

Assessment of O2•− production by flow cytometry using hydroethidine (HE) as dye on channel FL2 (PE). (A) The metalloporphyrin MnTE-2-PyP (Por, 30 µM), added 1 h prior to curcumin, attenuated the overproduction of O2•− induced by 1 h of treatment with curcumin (Cur, 10 µM). (B) Chrysin (Chr, 25 µM) did not induce overproduction of O2•−, nor increased the overproduction of O2•− induced by curcumin (n = 3). These results suggest that toxicity of curcumin was mediated by O2•−, whereas the potentiation effect induced by chrysin was not.
Discussion
Depletion of intracellular GSH can result from a number of mechanisms including inhibition of cysteine uptake, inhibition of glutathione synthesis, MRP-mediated efflux, GSH oxidation, and transthiolation reactions leading to glutathione-protein adducts [7,18,50]. Although hydroxyflavones are not cotransported with GSH by MRP1 [7,12], the active efflux of glutathione-hydroxychalcone adducts cannot be discarded. As shown in this study, flavonoid-induced GSH efflux can dramatically vary from one cell type to another. The tumor cell response to structures within one group of molecules (HCs vs HFs) was similar, whereas the response of the three tumor cell types to each group of molecules was different, suggesting the existence of at least two distinct transport systems that preferentially recognize one of the two groups of molecules (including MRP1 for HFs). A novel chalcone-based pharmacophore requiring hydroxyl substitution in position 2′ and a novel flavone-based pharmacophore requiring hydroxyl substitution in position 7 were identified (Fig. 1). In the three cell lines, at least one flavonoid was found more effective than three classical substrates of multidrug resistance protein 1 (MK-571, indomethacin, and verapamil). Conversely, some compounds such as 4′-HC, curcumin, and 2-HE elevated intracellular GSH levels in HL-60 and PC-3 cells. This accumulation is likely due to stimulation of GSH synthesis, as has been shown with apocynin and curcumin in A549 cells [51,52]. Interestingly, curcumin, 4′-HC and apocynin have in common the presence of a hydroxyl group in position 4 of a phenolic moiety.
The antioxidant properties of flavonoids have been associated with their cardioprotective and neuroprotective properties, yet such association is much less certain concerning their cancer preventive properties. Low intake of selenium, an indispensable cofactor of glutathione peroxidase, has been associated with a higher risk of cancer, suggesting that catalytic antioxidants prevent the angiogenesis of cancer cells [53]. In the case of flavonoids, however, their chemopreventive properties may rather rely on eliminating precancerous cells due to their prooxidant properties in vivo. This is likely the case of HCs, apigenin, genistein, and chrysin, where their cytotoxicity may result from a combination of interference with the mitochondrial respiratory chain and MRP-mediated GSH depletion [4–6,10]. It is worth noting that the bee product propolis, which is known to exert antimicrobial, antiviral, and cancer preventive properties, contains chrysin, a poor antioxidant, as one of its major components [54].
The precise mechanism by which H2O2 induces the formation of the mitochondrial permeability transition pores and the release of cytochrome c remains unclear, i.e., direct oxidation of the pores and/or facilitation by oxidized cardiolipin [35,55]. However, the overproduction of ROS as a central event in mitochondrial-mediated apoptosis is now well documented [24–37]. The stoichiometric antioxidant N-acetyl-L-cysteine (NAC) is commonly used at high concentrations (5 to 50 mM) to show whether the anticancer activity of a compound relies on its prooxidant properties [27,28]. At 30 µM, the catalytic antioxidant MnTE-2-PyP showed no toxicity in HL-60 cells; yet it clearly decreased the toxicity of HCs and curcumin. Moreover, MnTE-2-PyP decreased O2•− levels in HL-60 cells treated with curcumin, thus making this metalloporphyrin a valuable tool to study prooxidants in vivo (Figs. 4, 5A and 9A). Knowing that MnTE-2-PyP exerts a substantial superoxide dismutase activity and a residual catalase activity, the protective effect of MnTE-2-PyP suggests that the toxicities of HCs and curcumin are mediated by ROS, likely as a result of interference with the mitochondrial respiratory chain, as in the cases of rotenone, 2-ME, and a number of flavonoids [4–6,30–35,49]. However, the delay between the initial oxidative burst induced by curcumin in HL-60 cells (Fig. 9) and the major change in MMP (over 24 h) (Fig. 7) suggests that this initial oxidative burst may not be fully responsible for curcumin’s mitochondrial-mediated cytotoxicity.
Our study showed that effective inducers of GSH depletion (2′,5′-DHC or chrysin, depending on the cell type) were able to potentiate the toxicity of known prooxidants (rotenone, 2-ME, and curcumin). To what direct extent GSH depletion is responsible for the potentiation effect remains to be determined. In previous studies, the ability of verapamil to sensitize cancer cells was associated with MRP-mediated GSH efflux [13,14], and in the three cell types studied herein, 2′,5′-DHC and chrysin were more effective for depleting GSH than verapamil. However, since an inducer of MRP1-mediated GSH depletion is also expected to be an inhibitor of MRP1-mediated drug efflux, one technical difficulty is to determine the relative importance of each mechanism in the potentiation effect. This study showed that flavonoid treatment lowered GSH levels in the mitochondria and that the potentiation effect was mediated by the mitochondria, thus supporting the importance of GSH depletion per se. These observations were particularly clear using 2′,5′-DHC (10 µM) in A549 cells, in which the GSH depletion response was most important. In these cells, the toxicity of etoposide was not potentiated by 2′,5′-DHC nor by chrysin, suggesting that the potentiation effect is likely limited to drugs that induce oxidative stress through direct interference with the mitochondrial respiratory chain [36]. Other approaches are however needed to validate our working hypothesis, for instance, blocking MRPs. Attempts to down-regulate MRP1 expression and identifying MRPs that are involved in HC-induced GSH efflux are currently underway in our laboratory. Also, the growing knowledge of ABC transporters and their substrates will allow one to match inducers of GSH depletion with anticancer drugs that are not substrates of the same transporter.
A major limitation in the treatment of human cancer is the relatively narrow therapeutic window between the dose of drug that kills a tumor cell and that which results in adverse toxicity. Targeting the mitochondrial respiratory chain as an anticancer strategy, for instance, requires some selectivity, since rotenone and other complex I inhibitors have been associated with irreversible neuronal damage and Parkinson’s disease [56]. MRPs tend to be overexpressed in cancer cells, conferring resistance to anticancer drugs, but also providing a selective opportunity for cancer cell sensitization by stimulating GSH efflux [18,23]. In addition to being MRP inhibitors, some flavonoids are potent inducers of GSH efflux ([11,12], and this study). Since the response of cancer cells to flavonoids varies from one cell line to another (a variation from a same cell type from two individuals cannot be discarded), as well as toward one group of flavonoids to another (i.e., HCs vs HFs), the key to such strategy would be: (1) to determine the optimum flavonoid (or another inducer of GSH depletion) for a particular cancer cell, and (2) to evaluate to what extent that flavonoid sensitizes the cancer cell to anticancer agents that interfere with the mitochondrial respiratory chain. This approach could be used to tailor a drug therapy to the genetic profile of an individual’s own tumor’s expression of MRPs. As shown in this study, nontoxic concentrations of chrysin (25 µM) were able to sensitize HL-60 cells, yet lower concentrations of 2′,5′-DHC (10 µM) effectively sensitized A549 cells. Such effect was likely due, at least partly, to MRP-mediated GSH depletion, although the MRPs responsible for 2′,5′-DHC-induced GSH depletion remain to be identified.
Abbreviations
- DHC
dihydroxychalcone
- DMSO
dimethyl sulfoxide
- FBS
fetal bovine serum
- GSH
glutathione
- HC
hydroxychalcone
- 2-HE
2-hydroxyestradiol
- HF
hydroxyflavone
- HPLC-EC
high-pressure liquid chromatography with electrochemical detection
- HPLC-FD
HPLC with fluorometric detection
- LDH
lactate deshydrogenase
- mBBr
monobromobimane
- 2-ME
2-methoxyestradiol
- 7-MF
7-methoxyflavone
- MMP
mitochondrial membrane potential
- MnTE-2-PyP
manganese(III) meso-tetrakis(N-ethylpyridinium-2-yl) porphyrin
- MRP
multidrug resistance protein
- Rh123
rhodamine 123
- ROS
reactive oxygen species
Footnotes
This work was supported by NIH Grants HL31992 and HL75523 to B.J. Day. We thank Drs. Lynette Rogers and Skip Smith (Children’s Research Institute, Columbus, OH) for their helpful suggestions on GSH analysis, and Jie Huang (National Jewish Medical and Research Center) for her technical assistance with the HPLC-FD.
References
- 1.Havsteen BH. The biochemistry and medical significance of the flavonoids. Pharmacol. Ther. 2002;96:67–202. doi: 10.1016/s0163-7258(02)00298-x. [DOI] [PubMed] [Google Scholar]
- 2.Williams RJ, Spencer JP, Rice-Evans C. Flavonoids: antioxidants or signalling molecules? Free Radic. Biol. Med. 2004;36:838–849. doi: 10.1016/j.freeradbiomed.2004.01.001. [DOI] [PubMed] [Google Scholar]
- 3.Cao G, Sofic E, Prior RL. Antioxidant and prooxidant behavior of flavonoids: structure-activity relationships. Free Radic. Biol. Med. 1997;22:749–760. doi: 10.1016/s0891-5849(96)00351-6. [DOI] [PubMed] [Google Scholar]
- 4.Hodnick WF, Ahmad S, Pardini RS. Induction of oxidative stress by redox active flavonoids. In: Manthey JA, Buslig MJ, editors. Flavonoids in the living system. New York: Plenum; 1998. pp. 131–150. [DOI] [PubMed] [Google Scholar]
- 5.Bohmont C, Aaronson LM, Mann K, Pardini RS. Inhibition of mitochondrial NADH-oxidase succinoxidase and ATPase by naturally occurring flavonoids. J. Nat. Prod. 1987;50:427–433. doi: 10.1021/np50051a014. [DOI] [PubMed] [Google Scholar]
- 6.Hodnick WF, Bohmont CW, Capps C, Pardini RS. Inhibition of the mitochondrial NADH-oxidase (NADH-coenzyme Q oxidoreductase) enzyme system by flavonoids: a structure-activity study. Biochem. Pharmacol. 1987;36:2873–2874. doi: 10.1016/0006-2952(87)90282-6. [DOI] [PubMed] [Google Scholar]
- 7.Ballatori N, Hammond CL, Cunningham JB, Krance SM, Marchan R. Molecular mechanisms of reduced glutathione transport: role of the MRP/CFTR/ABCC and OATP/SLC21A families of membrane proteins. Toxicol. Appl. Pharmacol. 2005;204:238–255. doi: 10.1016/j.taap.2004.09.008. [DOI] [PubMed] [Google Scholar]
- 8.Boumendjel A, Baubichon-Cortay H, Trompier D, Perrotton T, Di Pietro A. Anticancer multidrug resistance mediated by MRP1: recent advances in the discovery of reversal agents. Med. Res. Rev. 2005;25:453–472. doi: 10.1002/med.20032. [DOI] [PubMed] [Google Scholar]
- 9.van Zanden JJ, Wortelboer HM, Bijlsma S, Punt A, Usta M, Bladeren PJ, Rietjens IM, Cnubben NH. Quantitative structure activity relationship studies on the flavonoid mediated inhibition of multidrug resistance proteins 1 and 2. Biochem. Pharmacol. 2005;69:699–708. doi: 10.1016/j.bcp.2004.11.002. [DOI] [PubMed] [Google Scholar]
- 10.Sabzevari O, Galati G, Moridani MY, Siraki A, O’Brien PJ. Molecular cytotoxic mechanisms of anticancer hydroxychalcones. Chem. Biol. Interact. 2004;148:57–67. doi: 10.1016/j.cbi.2004.04.004. [DOI] [PubMed] [Google Scholar]
- 11.Nguyen H, Zhang SZ, Morris ME. Effect of flavonoids on MRP1-mediated transport in Panc-1 cells. J. Pharm. Sci. 2003;92:250–257. doi: 10.1002/jps.10283. [DOI] [PubMed] [Google Scholar]
- 12.Leslie EM, Deeley RG, Cole SP. Bioflavonoid stimulation of glutathione transport by the 190-kDa multidrug resistance protein 1 (MRP1) Drug. Metab. Dispos. 2003;31:11–15. doi: 10.1124/dmd.31.1.11. [DOI] [PubMed] [Google Scholar]
- 13.Benlloch M, Ortega A, Ferrer P, Segarra R, Obrador E, Asensi M, Carretero J, Estrela JM. Acceleration of glutathione efflux and inhibition of gamma-glutamyltranspeptidase sensitize metastatic B16 melanoma cells to endothelium-induced cytotoxicity. J. Biol. Chem. 2005;280:6950–6959. doi: 10.1074/jbc.M408531200. [DOI] [PubMed] [Google Scholar]
- 14.Trompier D, Chang XB, Barattin R, du Moulinet D’Hardemare A, Di Pietro A, Baubichon-Cortay H. Verapamil and its derivative trigger apoptosis through glutathione extrusion by multidrug resistance protein MRP1. Cancer. Res. 2004;64:4950–4956. doi: 10.1158/0008-5472.CAN-04-0143. [DOI] [PubMed] [Google Scholar]
- 15.Davison K, Cote S, Mader S, Miller WH. Glutathione depletion overcomes resistance to arsenic trioxide in arsenic-resistant cell lines. Leukemia. 2003;17:931–940. doi: 10.1038/sj.leu.2402876. [DOI] [PubMed] [Google Scholar]
- 16.Rudin CM, Yang ZJ, Schumaker LM, VanderWeele DJ, Newkirk K, Egorin MJ, Zuhowski EG, Cullen KJ. Inhibition of glutathione synthesis reverses Bcl-2-mediated cisplatin resistance. Cancer Res. 2003;63:312–318. [PubMed] [Google Scholar]
- 17.Schnelldorfer T, Gansauge S, Gansauge F, Schlosser S, Beger HG, Nussler AK. Glutathione depletion causes cell growth inhibition and enhanced apoptosis in pancreatic cancer cells. Cancer. 2000;89:1440–1447. [PubMed] [Google Scholar]
- 18.Batist G, Schecter RL, Alaoui-Jamali MA. The glutathione system and drug resistance. In: Shilsky RL, Milano GD, Ratain, Ratain MJ, editors. Principles of antineoplastic drug development and pharmacology. New York: Dekker; 1996. pp. 503–521. [Google Scholar]
- 19.Batist G, Schecter R, Woo A, Greene D, Lehnert S. Glutathione depletion in human and in rat multidrug resistant breast cancer cell lines. Biochem. Pharmacol. 1991;41:631–635. doi: 10.1016/0006-2952(91)90638-l. [DOI] [PubMed] [Google Scholar]
- 20.Fernandez-Checa JC, Kaplowitz N. Hepatic mitochondrial glutathione: transport and role in disease and toxicity. Toxicol. Appl. Pharmacol. 2005;204:263–273. doi: 10.1016/j.taap.2004.10.001. [DOI] [PubMed] [Google Scholar]
- 21.Soderdahl T, Enoksson M, Lundberg M, Holmgren A, Ottersen OP, Orrenius S, Bolcsfoldi G, Cotgreave IA. Visualization of the compartmentalization of glutathione and protein-glutathione mixed disulfides in cultured cells. FASEB J. 2003;17:124–126. doi: 10.1096/fj.02-0259fje. [DOI] [PubMed] [Google Scholar]
- 22.Szakacs G, Annereau JP, Lababidi S, Shankavaram U, Arciello A, Bussey KJ, Reinhold W, Guo YP, Kruh GD, Reimers M, Weinstein JN, Gottesman MM. Predicting drug sensitivity and resistance: profiling ABC transporter genes in cancer cells. Cancer Cell. 2004;6:129–137. doi: 10.1016/j.ccr.2004.06.026. [DOI] [PubMed] [Google Scholar]
- 23.Kruh GD, Gaughan KT, Godwin A, Chan A. Expression pattern of MRP in human tissues and adult solid tumor cell lines. J. Natl. Cancer Inst. 1995;87:1256–1258. doi: 10.1093/jnci/87.16.1256. [DOI] [PubMed] [Google Scholar]
- 24.Carmody RJ, Cotter TG. Signalling apoptosis: a radical approach. Redox Rep. 2001;6:77–90. doi: 10.1179/135100001101536085. [DOI] [PubMed] [Google Scholar]
- 25.Hail N. Mitochondria: a novel target for the chemoprevention of cancer. Apoptosis. 2005;10:687–705. doi: 10.1007/s10495-005-0792-8. [DOI] [PubMed] [Google Scholar]
- 26.Liu M-J, Wang Z, Li H-X, Wu R-C, Liu Y-Z, Wu Q-Y. Mitochondrial dysfunction as an early event in the process of apoptosis induced by woodfordin I in human leukemia K562 cells. Toxicol. Appl. Pharmacol. 2004;194:141–155. doi: 10.1016/j.taap.2003.08.017. [DOI] [PubMed] [Google Scholar]
- 27.Ka H, Park H-J, Jung H-J, Choi J-W, Cho K-S, Ha J, Lee K-T. Cinnamaldehyde induces apoptosis by ROS-mediated mitochondrial permeability transition in human promyelocytic leukemia HL-60 cells. Cancer Lett. 2003;196:143–152. doi: 10.1016/s0304-3835(03)00238-6. [DOI] [PubMed] [Google Scholar]
- 28.Lee M-G, Lee K-T, Chi S-G, Park J-H. Costunolide induces apoptosis by ROS-mediated mitochondrial permeability transition and cytochrome c release. Biol. Pharm. Bull. 2001;24:303–306. doi: 10.1248/bpb.24.303. [DOI] [PubMed] [Google Scholar]
- 29.Moobery SL. Mechanism of action of 2-methoxyestradiol: new developments. Drug Resistance Updates. 2003;6:355–361. doi: 10.1016/j.drup.2003.10.001. [DOI] [PubMed] [Google Scholar]
- 30.Huang P, Feng L, Oldham EA, Keating MJ, Plunkett W. Superoxide dismutase as a target for the selective killing of cancer cells. Nature. 2000;407:390–395. doi: 10.1038/35030140. [DOI] [PubMed] [Google Scholar]
- 31.Hileman EO, Liu J, Albitar M, Keating MJ, Huang P. Intrinsic oxidative stress in cancer cells: a biochemical basis for therapeutic selectivity. Cancer Chemother. Pharmacol. 2004;53:209–219. doi: 10.1007/s00280-003-0726-5. [DOI] [PubMed] [Google Scholar]
- 32.Kachadourian R, Liochev SI, Cabelli DE, Patel MN, Fridovich I, Day BJ. 2-Methoxyestradiol does not inhibit superoxide dismutase. Arch. Biochem. Biophys. 2001;392:349–353. doi: 10.1006/abbi.2001.2455. [DOI] [PubMed] [Google Scholar]
- 33.Hagen T, D’Amico G, Quintero M, Palacios-Callender M, Hollis V, Lam F, Moncada S. Inhibition of mitochondrial respiration by the anticancer agent 2-methoxyestradiol. Biochem. Biophys. Res. Commun. 2004;322:923–929. doi: 10.1016/j.bbrc.2004.07.204. [DOI] [PubMed] [Google Scholar]
- 34.Li N, Ragheb K, Lawler G, Sturgis J, Rajwa B, Melendez JA, Robinson JP. Mitochondrial complex I inhibitor rotenone induces apoptosis through enhancing mitochondrial reactive oxygen species production. J. Biol. Chem. 2003;278:8516–8525. doi: 10.1074/jbc.M210432200. [DOI] [PubMed] [Google Scholar]
- 35.Ligeret H, Barthelemy S, Zini R, Tillement JP, Labidalle S, Morin D. Effects of curcumin and curcumin derivatives on mitochondrial permeability transition pore. Free Radic. Biol. Med. 2004;36:919–929. doi: 10.1016/j.freeradbiomed.2003.12.018. [DOI] [PubMed] [Google Scholar]
- 36.Robertson JD, Enoksson M, Suomela M, Zhivotovsky B, Orrenius S. Caspase-2 acts upstream of mitochondria to promote cytochrome c release during etoposide-induced apoptosis. J. Biol. Chem. 2002;277:29803–29809. doi: 10.1074/jbc.M204185200. [DOI] [PubMed] [Google Scholar]
- 37.Mantymaa P, Shtonen T, Guttorm T, Saily M, Kinnula V, Savolainen E-R, Koistinen P. Induction of mitochondrial manganese superoxide dismutase confers resistance to apoptosis in acute myeloblastic leikaemia cells exposed to etoposide. Br. J. Haematol. 2000;108:574–581. doi: 10.1046/j.1365-2141.2000.01852.x. [DOI] [PubMed] [Google Scholar]
- 38.Kachadourian R, Batinic-Haberle I, Fridovich I. Syntheses and superoxide dismuting activities of partially (1–4) β-chlorinated derivatives of manganese(III) meso-tetrakis(N-ethylpyridinium-2-yl)porphyrin. Inorg. Chem. 1999;38:391–396. [Google Scholar]
- 39.Velsor LW, Kovacevic M, Goldstein M, Leitner HM, Lewis W, Day BJ. Mitochondrial oxidative stress in human hepatoma cells exposed to stavudine. Toxicol. Appl. Pharmacol. 2004;129:10–19. doi: 10.1016/j.taap.2004.03.005. [DOI] [PubMed] [Google Scholar]
- 40.Bode AM, Rose RC. Analysis of water soluble antioxidants by high-performance liquid chromatography with electrochemical detection. In: Packer L, editor. Oxidants and antioxidants, part A. Methods in enzymology. volume 299. San Diego: Academic Press; 1995. pp. 77–83. [DOI] [PubMed] [Google Scholar]
- 41.Newton GL, Fahey RC. Determination of biothiols by bromobimane labeling and high-performance liquid chromatography. In: Packer L, editor. Biothiols, part A. Methods in enzymology. volume 251. San Diego: Academic Press; 1995. pp. 148–166. [DOI] [PubMed] [Google Scholar]
- 42.Day BJ, Shawen S, Liochev SI, Crapo JD. A metalloporphyrin superoxide dismutase mimetic protects against paraquat-induced endothelial cell injury in vitro. J. Pharmacol. Exp. Ther. 1995;275:1227–1232. [PubMed] [Google Scholar]
- 43.Follstad BD, Wang DIC, Stephanopoulos G. Mitochondrial membrane potential differentiates cells resistant to apoptosis in hybridoma cultures. Eur. J. Biochem. 2000;267:6534–6540. doi: 10.1046/j.1432-1327.2000.01743.x. [DOI] [PubMed] [Google Scholar]
- 44.Zhao H, Joseph J, Fales HM, Sokoloski EA, Levine RL, Vasquez-Vivar J, Kalyanaraman B. Detection and characterization of the product of hydroethidine and intracellular superoxide by HPLC and limitations of fluorescence. Proc. Natl. Acad. Sci. USA. 2005;102:5727–5732. doi: 10.1073/pnas.0501719102. [DOI] [PMC free article] [PubMed] [Google Scholar]
- 45.Hirrlinger J, Schulz JB, Dringen R. Glutathione release from cultured brain cells: multidrug resistance protein 1 mediates the release of GSH from rat astroglial cells. J. Neurosci. Res. 2002;69:318–326. doi: 10.1002/jnr.10308. [DOI] [PubMed] [Google Scholar]
- 46.Hamilton KO, Topp E, Makagiansar I, Siahaan T, Yazdanian M, Audus KL. Multidrug resistance-associated protein-1 functional activity in Calu-3 cells. J. Pharmacol. Exp. Ther. 2001;298:1199–1205. [PubMed] [Google Scholar]
- 47.Paolicchi A, Dominici S, Pieri L, Maellaro E, Pompella A. Glutathione catabolism as a signaling mechanism. Biochem. Pharmacol. 2002;64:1027–1035. doi: 10.1016/s0006-2952(02)01173-5. [DOI] [PubMed] [Google Scholar]
- 48.Kachadourian R, Johnson CA, Min E, Spasojevic I, Day BJ. Flavin-dependent antioxidant properties of a new series of meso-N,N′-dialkyl-imidazolium substituted manganese(III) porphyrins. Biochem. Pharmacol. 2004;67:77–85. doi: 10.1016/j.bcp.2003.08.036. [DOI] [PubMed] [Google Scholar]
- 49.Wortelboer HM, Usta M, van der Velde AE, Boersma MG, Spenkelink B, van Zanden JJ, Rietjens IM, van Bladeren PJ, Cnubben NH. Interplay between MRP inhibition and metabolism of MRP inhibitors: the case of curcumin. Chem. Res. Toxicol. 2003;16:1642–1651. doi: 10.1021/tx034101x. [DOI] [PubMed] [Google Scholar]
- 50.Gout PW, Buckley AR, Simms CR, Bruchovsky N. Sulfasalazine a potent suppressor of lymphoma growth by inhibition of the x(c)-cystine transporter: a new action for an old drug. Leukemia. 2001;15:1633–1640. doi: 10.1038/sj.leu.2402238. [DOI] [PubMed] [Google Scholar]
- 51.Lapperre TS, Jimenez LA, Antonicelli F, Drost EM, Hiemstra PS, Stolk J, MacNee W, Rahman I. Apocynin increases glutathione synthesis and activates AP-1 in alveolar epithelial cells. FEBS Lett. 1999;443:235–239. doi: 10.1016/s0014-5793(98)01723-2. [DOI] [PubMed] [Google Scholar]
- 52.Biswas SK, McClure D, Jimenez LA, Megson IL, Rahman I. Curcumin induces glutathione biosynthesis and inhibits NF-kappaB activation and interleukin-8 release in alveolar epithelial cells: mechanism of free radical scavenging activity. Antioxid. Redox Signal. 2005;7:32–41. doi: 10.1089/ars.2005.7.32. [DOI] [PubMed] [Google Scholar]
- 53.Trumbo PR. The level of evidence for permitting a qualified health claim: FDA’s review of the evidence for selenium and cancer and vitamin E and heart disease. J. Nutr. 2005;135:354–356. doi: 10.1093/jn/135.2.354. [DOI] [PubMed] [Google Scholar]
- 54.Siess M-H, Le Bon A-M, Canivenc-Lavier M-C, Amiot M-J, Sabatier S, Aubert SY, Suschetet M. Flavonoids of honey and propolis: characterization and effects on hepatic drug-metabolizing enzymes and benzo[a]pyrene-DNA binding in rats. J. Agric. Food Chem. 1996;44:2297–2301. [Google Scholar]
- 55.Kagan VE, Borisenko GG, Tyurina YY, Tyurin VA, Jiang J, Potapovich AI, Kini V, Amoscato AA, Fujii Y. Oxidative lipidomics of apoptosis: redox catalytic interactions of cytochrome c with cardiolipin and phosphatidylserine. Free Radic. Biol. Med. 2004;37:1963–1985. doi: 10.1016/j.freeradbiomed.2004.08.016. [DOI] [PubMed] [Google Scholar]
- 56.Fiskum G, Starkov A, Polster BM, Chinopoulos C. Mitochondrial mechanisms of neural cell death and neuroprotective interventions in Parkinson’s disease. Ann. N Y. Acad. Sci. 2003;991:111–119. doi: 10.1111/j.1749-6632.2003.tb07469.x. [DOI] [PubMed] [Google Scholar]