Abstract
Determination of absolute configuration (AC) is one of the most challenging features in the structure elucidation of chiral natural products, especially those with complex structures. With revolutionary advancements in the area of quantum chemical calculations of chiroptical spectroscopy over the past decade, the time dependent density functional theory (TDDFT) calculation of electronic circular dichroism (ECD) spectra has emerged as a very promising tool. The principle is simply based on the comparison of the calculated and experimental ECD spectra: the more closely they match, the more reliable conclusion for the AC assignment can be drawn. This review attempts to use several examples representing monomeric flavonoids, rotationally restricted biflavonoids, complex hexahydroxydiphenoyl-containing flavonoids, conformationally flexible and restrained sesquiterpenoids, cembrane-africanene terpenoids, dihydropyranocoumarins, alkaloids, and dihydroxanthones to illustrate the applicability of this approach in determining the AC of structurally diverse natural products. The findings clearly indicate that the TDDFT calculation of ECD spectra can quantify the contribution of individual conformers and the interaction of multiple chromophores, making it possible to determine the AC of complex chiral molecules. The calculated electronic transitions and molecular orbitals provide new insight into the interpretation of ECD spectra at the molecular level.
Keywords: Absolute configuration, electronic circular dichroism, natural products, theoretical calculation, TDDFT
1. INTRODUCTION
Natural products are an important source for drug discovery. Determination of absolute configuration (AC) is one of the most challenging tasks in the structure elucidation of chiral natural products, especially those with complex structures. The available methods include X-ray crystallography for crystalline compounds, chemical synthesis, NMR spectroscopy/chiral derivatization, analytical chemistry, and chiroptical approaches. Among these, X-ray crystallography probably remains the most powerful and effective approach, e.g., in the AC assignment of the antifungal agent amphotericin B.1 In particular, the recent technology has made AC assignment possible without introduction of a heavy atom in the molecule.2-6 However, this necessitates the availability of a suitable crystal, which is often difficult to obtain for some natural products, not to mention amorphous or liquid compounds. Chemical synthesis certainly provides convincing evidence, but is hampered by cost as shown in the total synthesis of the anticancer agent taxol7,8 or is not applicable to all natural products. The NMR-based methods by preparing Mosher's esters9,10 or using shift reagents11,12 have been widely employed for the determination of the ACs of natural products due to convenience and easy access to the NMR instrument. Mosher's method requires the transformation of the chiral substrate by using a chiral derivatizing agent to afford diastereoisommers that can be differentiated by NMR spectroscopy. Analytical chemistry based methods via GC and HPLC analyses are particularly useful for the determination of the AC of the amino acid constituent units13 of peptides and the sugar residues14,15 of glycosides. Chiroptical methods involving empirical,16-20 semiempirical,21 or non-empirical22,23 rules have historically played an important role in determining the AC of natural products. Since each of the aforementioned methods has limitations, careful selection of an appropriate, or a combination of two or more methods, depending on the nature of the chiral molecule is crucial.
Electronic circular dichroism (ECD) has been demonstrated to be a powerful chiroptical tool for the AC assignment of natural products with various chromophores since the 1960s.24,25 CD is the phenomena of a chiral molecule that adsorbs left and right circularly polarized light beams to a different extent. The difference of the absorptions is the measure of the magnitude of CD, which is expressed by the differential molar extinction coefficients as Δε = εl – εr (L.mol-1·cm-1). The output of the CD instrument is usually expressed as molecular ellipticity θ, and the molar ellipicity [θ] can be correlated with Δε by the equation [θ] = 3300 Δε. ECD is experimentally very sensitive and a non-destructive technique. A good spectrum can be obtained using 0.1-1 mg of the sample. The fundamentals of ECD have been reviewed previously.26-29 Contrary to the phenomena of optical rotary dispersion (ORD) that any chiral molecule will show absorptions in the UV/vis wavelength range, appropriate chromophores such as carbonyl, diene, aromatic, or a conjugated system should be present in the molecule in order to exhibit measurable ECD absorptions or Cotton effects. In principle, chiral compounds with the same or similar chromophore(s) and stereochemical environment (including configuration and conformation) exhibit similar ECD spectra, which is the basis for the assignment of the AC of a new chiral molecule compared to those whose AC has been independently established by other methods such as X-ray crystallography or chemical synthesis. Several empirical sector rules drawn from the analysis of the ECD spectra of a large number of model compounds have been available and the octant rule18,19 represents one of the most used for the prediction of AC of cyclohexanone derivatives. In addition, with theoretical evidence from quantum chemical calculations, the exciton chirality method21 has been formulated as a semi-empirical rule to predict the AC of chiral molecules where two or more chromophores are spatially coupled. Nevertheless, ECD is primarily used as an empirical method for configurational assignment of natural products. It is very effective and reliable for the compounds with distinct chromophores and relatively simple stereogenic centers such as monomeric flavonoids.30 For compounds with multiple chromophores and complex stereochemistry, the interpretation of ECD data in terms of AC is a complex exercise.
The past decade has witnessed revolutionary advancements in the area of quantum chemical calculations of ECD31-39 as well as other chiroptical properties such as optical rotation32,33,35-37,40-46 and vibrational circular dichroism (VCD)47-54 using time dependent density functional theory (TDDFT), largely due to the improvement of the computational technologies. Compared to other methods such as coupled cluster theory and multiconfigurational self-consistent field theory31,36,54,56 that are available for the theoretical calculation of ECD, TDDFT has been proved to provide a good fit in terms of the computational efforts and accuracy with regard to the experimental data, in particular for medium-sized molecules (molecular weight <1000).38,57-61 The calculated electronic transitions and molecular orbitals have allowed chemists to understand ECD at the molecular level. While on one hand the calculations can validate the previously deduced empirical rules, the most exciting aspect is that this approach seems to be able to determine the AC of any chiral molecule that produces a distinct experimental ECD spectrum. The principle is simply based on the comparison of the calculated and experimental ECD spectra: the more closely they match, the more reliable conclusion for the AC assignment can be drawn. Extensive studies on the application of the TDDFT method to the ECD calculation of chiral molecules, for example, of natural5,34,35,38,39, 62-75 or synthetic32,33,35-37,76-81 origin have been reported over the past few years. The purpose of this review is to use several examples representing different classes of natural products to illustrate the applicability of this approach in determining the AC of natural products.
2. COMPUTATIONAL METHODS
ECD calculations comprise two primary steps: conformational analysis to obtain the lowest energy conformers and subsequent calculations of the ECD spectra of the conformers. Initial systematic conformational search of a given molecule is generally carried out by using the MMFF94 molecular mechanics force-field method, e.g., via the SYBYL 8.1 program82 and/or the AM1 and PM3 semiempirical methods, e.g., via the Spartan02 prgram.83 Further geometric optimization of the resultant conformers is performed using the density functional theory (DFT) method, e.g., via the Gaussian03 program.84 The best performing functionals for TDDFT calculations are the hybrid B3LYP, BH&HLYP, MPW1PW91, and PBE0, while the commonly used basis sets include polarization and possibly diffuse functions, for example, in order of size, 6-31G*, 6-31G**, 6-311G++**, aug-cc-pVDZ, and aug-cc-pVTZ.29, 57 A large basis set may produce more reliable ECD results but requires longer computational time.85 B3LYP/6-31G* generally performs well and is the choice for most TDDFT calculations. A molecule may afford more than one predominant conformer.
TDDFT at the same or a higher level is then employed to calculate excitation energy (in nm) and rotatory strength R (unit: 10-40 cgs) in the dipole velocity (Rvel) and dipole length (Rlen) forms. “Self-Consistent Reaction Field” method (SCRF) with “COnductor-like continuum Solvent MOdel” (COSMO)86-88 can be employed when taking the solvent effect89,90 into consideration. The calculated rotatory strengths are simulated into an ECD curve by using the Gaussian function
where σ is the width of the band at 1/e height (typically in the range of 0.10~0.3 eV) and ΔEi and Ri are the excitation energies and rotatory strength for transition i, respectively. Both the Rvel and Rlen forms can be used for the simulation of the ECD spectrum, although the latter is considered to provide better results.31,85 For multiple conformers, an overall ECD spectrum will be generated on the basis of Boltzman weighting of individual conformers. A more detailed theoretical basis for TDDFT calculations of ECD may be found in references 29, 31, and 57.
3. TDDFT CALCULATION OF ECD SPECTRA OF STRUCTUALLY DIVERSE NATURAL PRODUCTS
Structurally diverse chiral natural products containing different functionalities or chromophores that may produce a distinctive experimental ECD spectrum in the wavelength range of 200–400 nm are good targets for ECD calculation to determine AC. Conformationally rigid molecules, or molecules containing a single stereogenic center, or relatively simple chromophores, may quickly afford good calculated spectra. For conformationally flexible molecules, significant computational time is needed for comformational analysis. A prerequisite for ECD calculations is that the relative configuration or possible relative configuration of the stereogenic carbons near the chromophore of the molecule is known. It is understandable that CD can only sense the stereochemical difference near the chromophore in a molecule with multiple stereogenic centers. However, once the AC of one or two stereogenic carbons is determined by ECD calculation, the AC of the remaining stereogenic centers may be readily determined by NMR spectroscopy. More importantly, the attractiveness of the ECD calculation is that it can quantify the contribution of individual conformers and the interaction of multiple chromospheres, making it possible to determine the AC of complex chiral molecules. The following examples include natural products representing simple monomeric flavonoids, rotationally restricted biflavonoids, complex hexahydroxydiphenoyl-containing flavonoids, conformationally flexible and restrained sesquiterpenoids, cembrane-africanene terpenoids, dihydropyranocoumarins, alkaloids, and dihydroxanthones.
3.1 FLAVONOIDS
CD may be the most powerful method in determining the AC of monomeric flavonoids.25 Gaffield in 1970 demonstrated that (2S)-flavanone and (2R,3R)-3-hydroxyflavanone gave the same negative Cotton effect around 290 nm for their acetophenone π→π* transitions and a positive Cotton effect around 330 nm for their acetophenone n→π* transitions. Their enantiomers gave opposite Cotton effects. These CD patterns are the basis for all chiral flavonoids for AC assignment.30 The simple monomeric flavanone (2R)-pinocembrin (1) and the flavanone glycoside mattucinol-7-O-β-d-glucopyranoside (2) were used as model compounds to provide theoretical evidence for the aforementioned interpretations and assess the feasibility and reliability of the TDDFT method in calculating ECD spectra of chiral flavonoids.
3.1.1 (2R)-Pinocembrin (1).38
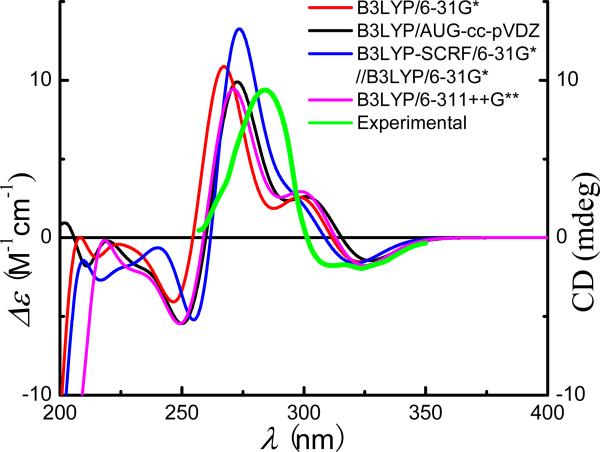
(2R)-Pinocembrin (Fig. 1) contains a single stereogenic center. The solid NMR evidence for this class of compounds indicates that the phenyl ring is equatorially oriented and the 5-OH forms an intramolecular hydrogen bond with the C4 carbonyl group. Thus, the conformational issue of this molecule is simple and only one predominant conformer was located at the B3LYP/6-31G* level in the gas phase (Fig. 1). The heterocyclic C-ring adopts a half-chair conformation with an equatorial phenyl B-ring rotated to be almost perpendicular to the the A/C-ring plane. The dihedral angle O1-C2-C1′-C2′ is 40.0°. The calculated total energies, important transitions, related rotatory strengths, and oscillator strengths of (2R)-1 at the B3LYP/6-31G* level are shown in Table 1, while the simulated ECD curve of (2R)-1 is shown in Fig. 2. The calculated ECD spectrum is consistent with its experimental data in the region of 260-350 nm,91 although the maximum absorption is slightly shifted toward the low wavelength region, i.e., around 270 nm in the calculated ECD versus around 285 nm in the experimental ECD spectrum.
Fig. (1).
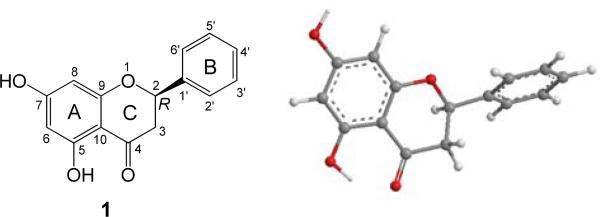
Structure and optimized geometry of (2R)-pinocembrin (1) at the B3LYP/6-31G* level.
Table 1.
Total energies (au), key transitions and their related rotatory and oscillator strengths of (2R)-pinocembrin (1) at the B3LYP/6-31G* level
| Species | Total Energy | Transition | ΔEa (eV) | λb (nm) | fc | Rveld | Rlene |
|---|---|---|---|---|---|---|---|
| 67→68 | 3.91 | 317 | 0.05 | –10.3 | –10.9 | ||
| (2R)-1 | –879.7254852 | 65→68 | 4.12 | 301 | 0.01 | 13.8 | 14.8 |
| 66→68 | 4.65 | 267 | 0.23 | 43.5 | 44.3 | ||
| 63→68 | 4.99 | 249 | 0.01 | –16.0 | –16.8 |
Excitation energy.
Wavelength.
Oscillator strength.
Rotatory strength in velocity form (10-40 cgs).
Rotatory strength in length form (10-40 cgs).
Fig. (2).
Calculated ECD spectra of (2R)-pinocembrin (1) at different levels in Δε values (M-1 cm-1) and its experimental ECD spectrum in the range of 260-350 nm in raw ellipiticiy (mdeg)91.
For comparison purposes, the TDDFT calculations using different basis sets at the B3LYP/AUG-cc-pVDZ//B3LYP/6-31G* and B3LYP/6-311++G** levels, as well as at the B3LYP-SCRF/6-31G*//B3LYP/6-31G* level with the COSMO solution model were performed. The results showed that there are no major differences among the four simulated ECD curves. The positive rotatory strength at 267 nm calculated by B3LYP/6-31G* is slightly shifted toward the high wavelength region at 270 nm by B3LYP/6-311++G**, 272 nm by B3LYP/AUG-cc-pVDZ//B3LYP/6-31G*, and 272 nm by B3LYP-SCRF/6-31G*//B3LYP/6-31G*, which better fits with the experimental data at 285 nm in solution. However, when BHLYP/6-31G* and BLYP/6-31G* were employed, the calculated and experimental ECD spectra did not match. The above results indicate that TDDFT /B3LYP/6-31G* should be an effective method for calculating/predicting the ECD of monomeric flavonoids, with a larger basis set or consideration of the solvent effect further improving the method.
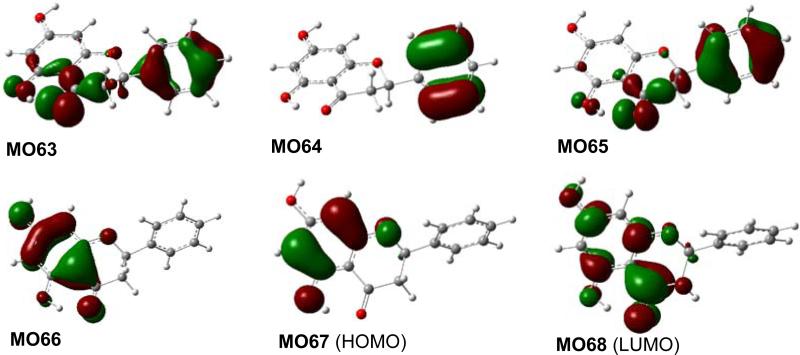
The molecular orbitals (MOs) involved in key transitions for the ECD of (2R)-1 are shown in Fig. 3. The major positive rotatory strength at 267 nm results from the electronic transition from MO66 involving a delocalized bonding (a fourteen-electron π system involving eleven atoms) of the acetophenone moiety to its corresponding unoccupied MO68 (LUMO). This supports the classical interpretation that the diagnostic positive Cotton effect in the range of 280-290 nm for this class of compounds is a contribution from the π → π* transition of the acetophenone moiety.30 However, the observation that the negative rotatory strength at 317 nm resulted from the transition from HOMO (MO67), which excludes involvement of the electrons of the carbonyl group, to LUMO (MO68) contradicts the classical interpretation that the diagnostic Cotton effect around 330 nm for this class of compounds is associated with the acetophenone n → π* transition.
Fig. (3).
Molecular orbitals involved in key transitions in the calculated ECD of (2R)-1 at B3LYP/6-31G* level in gas phase.
3.1.2 Mattucinol-7-O-β-d-glucopyranoside (2).70
Based on the conformational analysis of compound 1 supported by X-ray crystallographic data, a starting conformation with the B-ring almost perpendicular to the A/C-ring plane was set for compound 2 (Fig. 4). The DFT method at the B3LYP/6-31G** level was performed to scan the potential energy surface of the conformers by rotating the glucosyl moiety about the C1″-O(C7) and (C1″)O-C7 bonds to locate the stable points, affording 12 conformers. Further optimization at the B3LYP/6-31G** level relocated the eight stable conformers with key dihedral angles shown in Table 2. Conformational analysis using relative free energies (ΔG) indicated the presence of four major conformers 2a1, 2a2, 2b1 and 2b2 with distributions of 33.4, 3.6, 60.0 and 2.9%, respectively, accounting for almost 100% in the gas phase, contributions of the remaining four conformers towards the conformational itinerary being insignificant. The glucosyl moiety is located above the A/C-ring plane in the 2a series but below this plane in the 2b series.
Fig. (4).
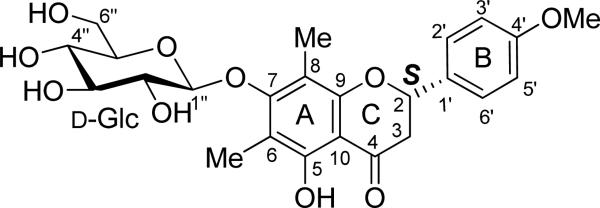
Structure of mattucinol-7-O-β-D-glucopyranoside (2).
Table 2.
Important dihedral angles in conformers of 2 (deg)
| 2a1 | 2a1′ | 2a1″ | 2a2 | 2b1 | 2b1′ | 2b1″ | 2b2 | |
|---|---|---|---|---|---|---|---|---|
| C1″-O-C7-C6 | 102 | 96 | 107 | 56 | –79 | –89 | –79 | –126 |
| C2″-C1″-O-C7 | 164 | –80 | –20 | 119 | 163 | –80 | –23 | 118 |
| O1-C2- C1′- C2′ | –43 | –43 | –43 | –43 | –40 | –38 | –40 | –43 |
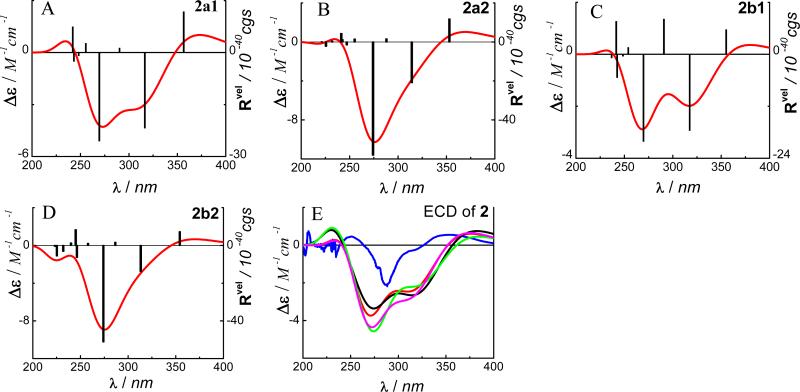
The calculated ECD spectra of conformers 2a1, 2a2, 2b1 and 2b2 in the gas phase by TDDFT at the B3LYP/6-31G** level are shown in Fig. 5. In addition, the calculations at the B3LYP/6-311++G**//B3LYP/6-31G**and B3PW91/6-31G**//B3LYP/6-31G** levels and the B3LYP-SCRF/6-31G**//B3LYP/6-31G** level in methanol solution with the COSMO model were performed. Overall, the calculated ECD spectra at the above levels were similar and consistent with the experimental spectrum. For example, the calculated negative rotatory strengths at 269 and 316 nm in 2a1 and those at 270 and 317 nm in 2b1 may contribute to the experimentally observed high-amplitude negative Cotton effect at 282 nm and a negative Cotton effect around 320 nm (shoulder), while the calculated positive rotatory strengths at 357 nm in 2a1 and 355 nm in 2b1 may be associated with the experimentally observed positive Cotton effect at 350 nm. The calculated MOs involved in the key transitions in 2b1 showed similar electron distributions as those of compound 1. These results again suggest that TDDFT/B3LYP represents a feasible method for calculating/predicting the ECD of monomeric flavonoids.
Fig. (5).
Calculated ECD spectra of 2 in the gas phase at the B3LYP/6-31G** level (A→D), and its experimental and weighted ECD (E:  experimental in MeOH;
  at the B3LYP/6-31G** level in the gas phase;
  at the B3LYP/6-311++G**//B3LYP/6-31G** level in the gas phase;
  at the B3PW91/6-31G**//B3LYP/6-31G** level in the gas phase;
  at the B3LYP-SCRF/6-31G**//B3LYP/6-31G** level with COSMO in MeOH).
3.2 BIFLAVONOIDS
3.2.1 Conformational analysis of (+)-morelloflavone (3).38
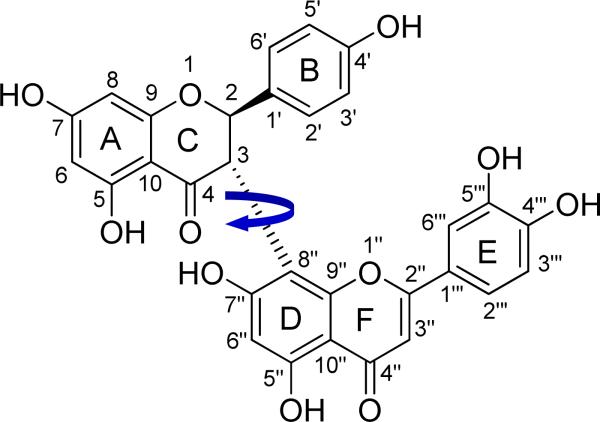
The biologically active (+)-morelloflavone (3) (Fig. 6) is a rotationally restricted flavanone-(3→8″)-flavone type of biflavonoid with two stereogenic centers and one chiral axis.92 The NMR data and semiempirical AM1 calculations demonstrated that 3 possessed two preferred conformations about the interflavanyl bond in a ratio of 1:0.37 in solution, i.e. 73 to 27%. In the major and minor conformers 3a and 3b, respectively, the DEF-flavone moiety is extended above and below the plane of the A/C-ring of the ABC-flavanone moiety, respectively. It was assigned a 2R,3S absolute configuration based on comparison of its experimental CD with those of similar compounds.92 ECD calculation of such a relatively large and comformationally flexible molecule to confirm the previous AC assignment represented a significant challenge.
Fig. (6).
Structure of the rotationally restricted morelloflavone (3).
Conformational search of the arbitrarily chosen (2R,3S)-3 was conducted using the semiempirical AM1 method in the gas phase by rotating the DEF-flavone moiety with a step increase of the key dihedral angle, C4-C3-C8″-C7″, in which two stable conformers 3a and 3b with dihedral angles around 60 and 225° (i.e. –135°), respectively, were obtained based on its potential energy surface. For the major conformer 3a-series, a further search using the AM1 method by rotating the unsymmetric E-ring of the DEF-flavone moiety and considering the presence or absence of a hydrogen bond between C7″-OH and the C4 carbonyl group afforded eight conformers 3a1–3a8. Note that 3a1–3a4 have hydrogen bonding between C7″-OH and the C4 carbonyl group. In a similar way, the minor conformer 3b-series also gave eight conformers 3b1–3b8. Optimization of individual conformers were then performed at the B3LYP/6-31G* level and harmonic frequencies analysis at the same level conducted to confirm these minima. Stable points on the potential energy surfaces for 3a1–3a8 and 3b1–3b4 were relocated, but for 3b5–3b8, only two minima, 3b5 and 3b7, were obtained. Among these conformers, the key dihedral angles of C4-C3-C8″-C7″ vary from 50 to 61° in 3a1–3a8, –80 to –83° in 3b1–3b4, and –126 and –131° in 3b5 and 3b7, respectively.
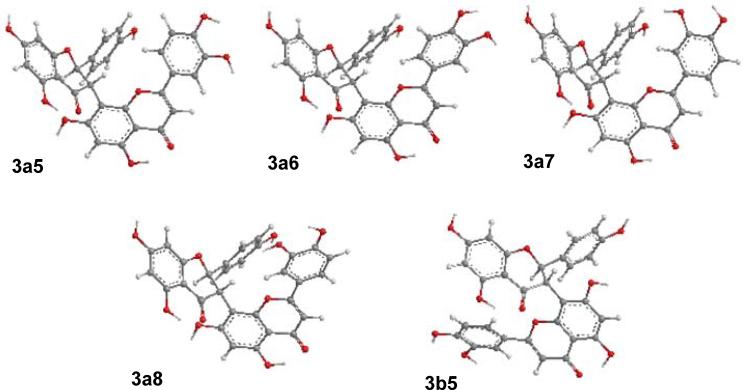
Since strong interactions between the multiple hydroxy groups in these conformers and the solvent may have a considerable influence on their minimum energies and possibly further affecting the ECD calculations, the single point energy (SPE) of every conformer in methanol was calculated at the B3LYP-SCRF/6-31G*//B3LYP/6-31G* level with the COSMO model. An interesting finding was that the total energy of conformer 3b7 both in the gas phase and in methanol was considerably lower than those of all others due to the formation of the hydrogen bond of C3″′-OH···O-C5 and inclusion of this conformer in the conformational analysis will result in a population of almost 100%, excluding the presence of all other conformers. 3b7 is the only conformer that possesses the hydrogen bonding between C3″′-OH and C5-OH. However, it is reasonably perceived that this loose intramolecular hydrogen bond is unlikely to survive due to the rotating nature of the bulky flavanyl moieties and strong interaction between the C7″-OH and the solvent. Hence, the C7″-OH that is presumably solvated has little chance to form a hydrogen bond with the C5-OH since the two flavanyl moieties are dynamically rotating to preclude a frozen conformer at that critical point. Thus, this unusual conformer 3b7 ideally generated by the theoretical models should not be significant in solution in real time. Surprisingly, the exclusion of 3b7 has made the conformational analysis using the SPEs of the remaining conformers in methanol in close agreement with the experimental data: a total of 73.9% population for major conformers 3a1–3a8 and 26.1% population for minor conformer 3b1–3b5 versus experimentally observed 73 to 27% for major and minor conformers (Table 2). Only four major conformers 3a5 (23.4%), 3a6 (30.8%), 3a7 (3.5%), and 3a8 (15.2%) and one minor conformer 3b5 (26.1%) are predominant (Fig. 7). The conformational analysis using ΔE, ΔE′, or ΔG in the gas phase did not match the experimental data (Table 2). It appears that consideration of the solvent effect is critical for the conformational analysis of such molecules and appropriate judgment should be exercised when dealing with certain negative theoretical data in a complex situation.
Fig. (7).
Optimized geometries of conformers of (2R,3S)-3 at the B3LYP/6-31G* level in the gas phase.
3.2.2 ECD of (+)-morelloflavone (3)
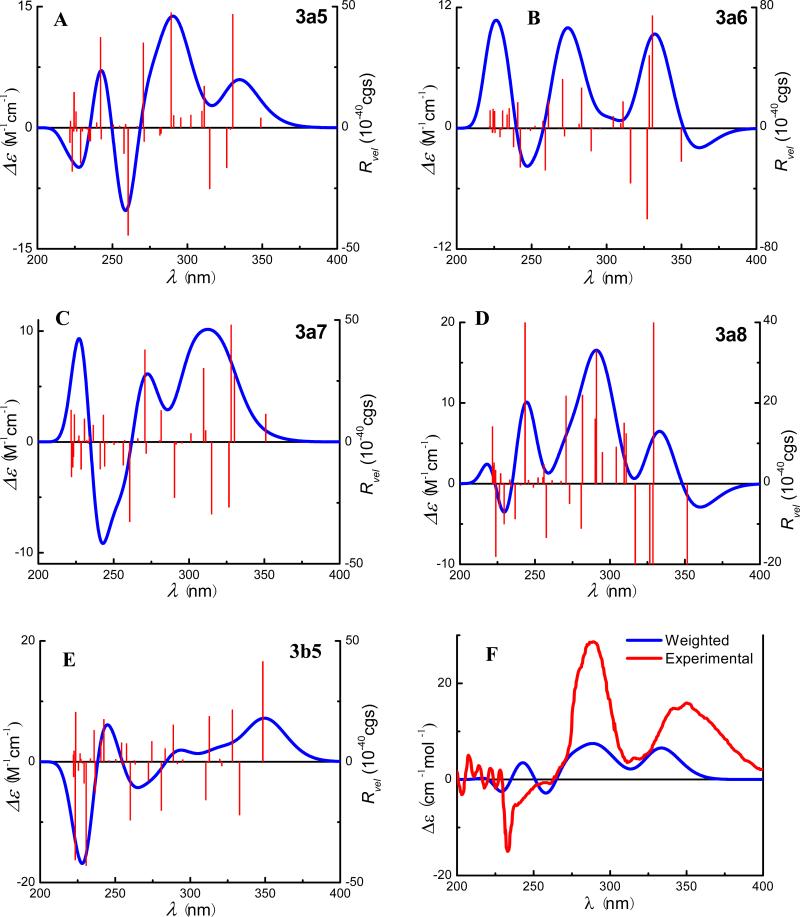
Based on the conformational analysis of (+)-3 in solution, the ECD spectra of conformers 3a5–3a8 and 3b5 were calculated using TDDFT and the COSMO model at the B3LYP-SCRF/6-31G*//B3LYP/6-31G* level and are shown in Fig. 8. While there are differences between these conformers, conformer 3a5 (23.4%) shows positive Cotton effects around 285 and 340 nm (Fig. 8A), which is very similar to the experimental ECD spectrum in methanol displaying positive Cotton effects around 290 and 350 nm (Fig. 8F). The two conformers, 3a6 (30.8%), and 3a8 (15.2%), also produce positive Cotton effects around 285 and 340 nm (Fig. 8B and 8D). Conformer 3b5 (26.1%) representing the minor conformer series produces a strong Cotton effect around 350 nm (Fig. 8E), which may complement the positive Cotton effect around 340 nm produced by the major conformers 3a5, 3a6, and 3a8. A weighted ECD curve based on the populations of the above five conformers is finally generated as shown in Fig. 8F, which is overall consistent with the experimental ECD in methanol, particularly for the two diagnostic Cotton effects around 290 and 350 nm. Therefore, it can be convincingly concluded that the (2R,3S)-absolute configuration assigned to (+)-2 on the basis of empirical rules is correct.
Fig. (8).
Calculated ECD spectra of conformers 3a5–3a8 and 3b5 (A→E) by TDDFT at the B3LYP-SCRF/6-31G*//B3LYP/6-31G* level in methanol and their weighted ECD (F) and the experimental ECD spectrum of (+)-3 in methanol (F).
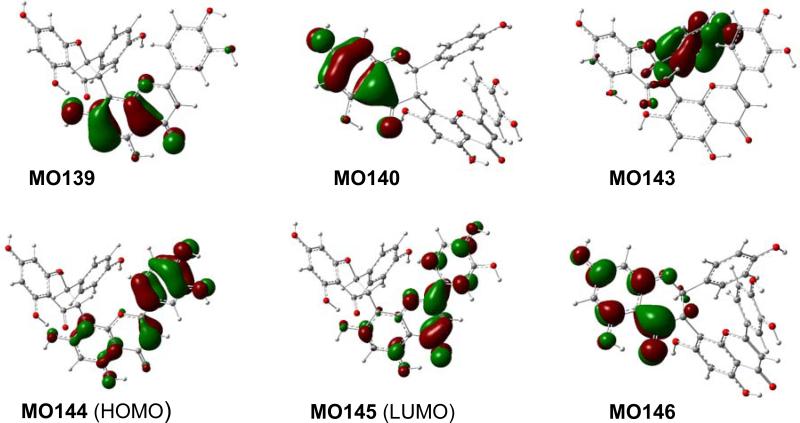
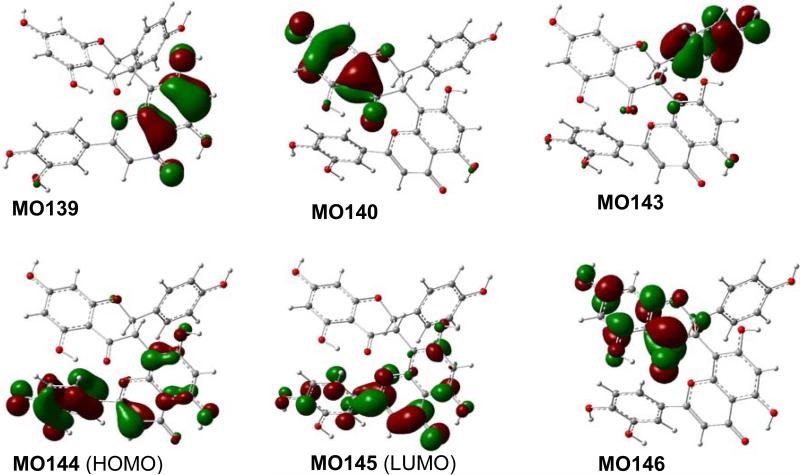
Analysis of the calculated ECD spectrum of the representative conformers 3a5 and 3b5 has provided an understanding of the generation of the experimentally observed ECD spectrum of this compound at the molecular level. Table 4 lists the key transitions, oscillator strengths, and rotatory strengths of conformers 3a5 and 3b5, while the molecular orbitals involved in the key transitions are shown in Fig. 9 and 10. Table 4 showed that the experimentally observed Cotton effect around 290 nm in 3 is contributed by the positive rotatory strengths at 271 and 289 nm in 3a5, resulting from the transitions from MO140 to MO146 and from MO139 to MO145, respectively. The former corresponds to the acetophenone π → π* transition of the ABC-flavanone moiety, similar to the monomeric flavonoid pinocembrin (1)discussed above, while the latter generating an even stronger positive rotatory strength is associated with the electronic transition within the DEF-flavone moiety. The diagnostic positive Cotton effect around 350 nm in the experimental ECD would be contributed by the positive rotatory strength at 330 nm generated from the transition from MO143 to MO145 that reflects the electronic interaction between the ABC-flavanone moiety via the B-ring π electrons and the DEF-flavone moiety in major conformer 3a5, which is further strengthened by the positive rotatory strength at 348 nm from the transition of MO144 to MO145 that involves the electrons within the DEF-flavone moiety in 3b5. The results indicate that the electronic interaction between the ABC-flavanone and DEF-flavone moieties plays a critical role in generating the aforementioned two positive Cotton effects. This supports an empirical interpretation that the positive Cotton effect around 350 nm for morelloflavone may be produced by the electronic transitions of the achiral DEF-flavone moiety chirally perturbed by the ABC-flavanone moiety.93
Table 4.
Key transitions and their related oscillator and rotatory strengths in the ECD spectra of (2R,3S)-morelloflavone conformers 3a5 and 3b5 at the B3LYP-SCRF/6-31G*//B3LYP/6-31G* level
| Transition | ΔEa (eV) | λb (nm) | fc | Rveld | Rlene |
|---|---|---|---|---|---|
| 3a5 | |||||
| 143→145 | 3.75 | 330 | 0.089 | 46.9 | 50.5 |
| 139→145 | 4.29 | 289 | 0.094 | 47.5 | 48.3 |
| 140→146 | 4.58 | 271 | 0.347 | 35.0 | 31.5 |
| 3b5 | |||||
| 144→145 | 3.56 | 348 | 0.309 | 41.5 | 47.6 |
| 143→145 | 3.78 | 328 | 0.137 | 21.5 | 24.2 |
| 143→146 | 3.96 | 313 | 0.043 | 18.8 | 17.7 |
| 139→145 | 4.29 | 289 | 0.077 | 15.2 | 15.1 |
Excitation energy.
Wavelength.
Oscillator strength.
Rotatory strength in velocity form (10-40 cgs).
Rotatory strength in length form (10-40 cgs).
Fig. (9).
Molecular orbitals involved in key transitions in the calculated ECD spectrum of 3a5 at the B3LYP-SCRF/6-31G*//B3LYP/6-31G* level in methanol.
Fig. (10).
Molecular orbitals involved in key transitions in the calculated ECD of conformer 3b5 at the B3LYP-SCRF/6-31G*//B3LYP/6-31G* level in methanol.
The calculated ECD spectra of conformers 3a1–3a8, 3b5, and 3b7 using TDDFT at the B3LYP/6-31G* level in the gas phase are conspicuously not in agreement with the experimental ECD. This strongly suggests that the utilization of the B3LYP-SCRF method with the solution COSMO model is critical. The solvent effect apparently plays a pivotal role in the case of 3 containing multiple hydroxy groups capable of forming inter- and intra-unit hydrogen bonds when compared with the monomeric pinocembrin (1) that bears fewer hydroxy groups and produces a calculated ECD spectrum in solution similar to that in the gas phase (Fig. 2). It is also interesting to note that the calculated ECD spectrum of 3b7 with the COSMO model at the B3LYP-SCRF/6-31G*//B3LYP/6-31G* and B3LYP-SCRF/6-31G* levels do not match the experimental ECD spectrum of 3, supporting the conjecture that 3b7 does not play a significant contributing role in solution.
3.3 HEXAHYDROXYDIPHENOYL-CONTAINING FLAVONOIDS
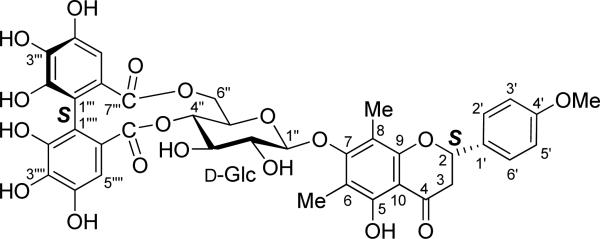
Mattucinol-7-O-[4″,6″-O-(aS)-hexahydroxydiphenoyl]-β-d-glucopyranoside (4)70 (Fig. 11) is a Candida secreted aspartic protease inhibitor isolated from the plant Miconia myriantha.94 The hexahydroxydiphenoyl (HHDP) moiety is an essential stereogenic element of ellagitannins, a group of natural products widely distributed in plants. Composed of flavanone, β-d-glucopyranosyl, and (aS)-HHDP structural moieties, this relatively bulky molecule is considered to be an ideal model to examine the roles of the three structural moieties in generating its overall ECD spectrum by TDDFT calculations.
Fig. (11).
Structure of mattucinol-7-O-[4″,6″-O-(aS)-hexahydroxydiphenoyl]-β-d-glucopyranoside (4).
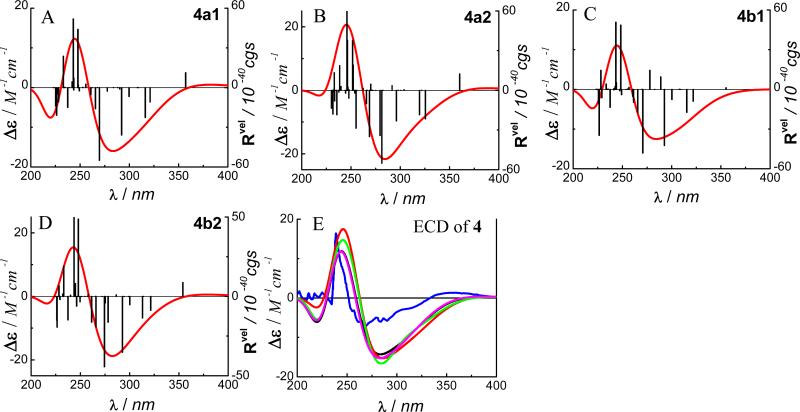
The experimental ECD spectrum of 4 showed a high-amplitude positive Cotton effect around 240 nm, a low-amplitude negative Cotton effect in the 260-300 nm region, and a minor positive Cotton effect around 350 nm (Fig. 13E). With consideration of the additive ECD contribution of the HHDP and flavanone structural moieties in conjunction with the empirical rules,30,95 the former was assigned aS and the latter 2S configuration. The theoretical calculation of the ECD of 4 was based on this assumption.
Fig. (13).
Calculated ECD spectra of 4 in the gas phase at the B3LYP/6-31G** level (A→D), and its experimental and weighted ECD in MeOH (E:  experimental in MeOH;
  at the B3LYP/6-31G** level in the gas phase;
  at the B3LYP/6-311++G**//B3LYP/6-31G** level in the gas phase;
  at the B3PW91/6-31G**//B3LYP/6-31G** level in the gas phase;
  at the B3LYP-SCRF/6-31G**//B3LYP/6-31G** level with COSMO in MeOH).
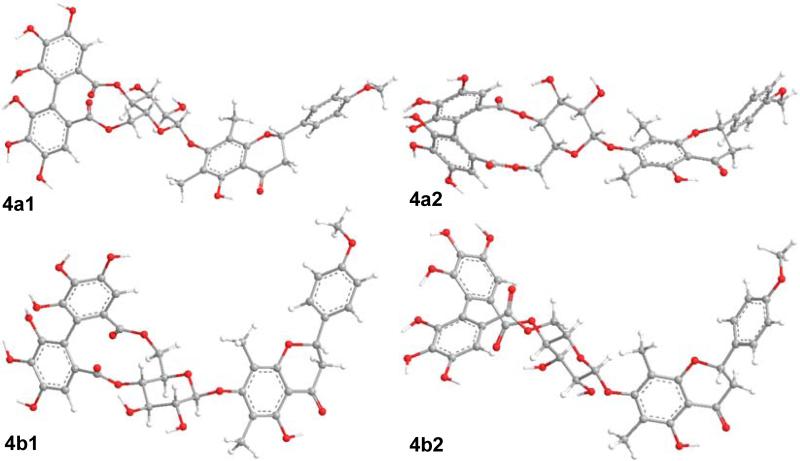
The optimized geometries of compound 2 were the basis for the conformational search of compound 4. Once the (aS)-HHDP group is attached to the β-d-glucopyranosyl moiety, the conformational flexibility of the two structural moieties is limited thus simplifying the geometric optimization. Similarly, only four conformers 4a1 (52.1%), 4a2 (2.8%), 4b1 (43.0%) and 4b2 (2.0%) (Fig. 12) were obtained with significant distributions at the B3LYP/6-31G** level by Gibbs free energy in the gas phase in which the flavanone and glucosyl moieties adopt conformations similar to 2a1, 2a2, 2b1 and 2b2, respectively. The dihedral angle C2″′-C1″′-C1″″-C2″″ of the (aS)-HHDP moiety in these conformers is 57°.
Fig. (12).
Major conformers of optimized geometries of compound 4 at the B3LYP/6-31G** level in the gas phase.
The ECD calculations of conformers 4a1, 4a2, 4b1 and 4b2 were carried out by the TDDFT method at the B3LYP/6-31G** level in the gas phase. The transitions, related rotatory strengths, and oscillator strengths of one major conformer, 4a1, are shown in Table 5. The simulated ECD of the four conformers and their weighted ECD spectra are shown in Fig. 13. The calculated and experimental ECD spectra are in good agreement. The experimentally observed positive Cotton effect at 240 nm in 4 may result from the two high-amplitude positive rotatory strengths around 245 nm in the four conformers, while the low-amplitude negative Cotton effect from 260-300 nm is contributed by a series of negative rotatory strengths, e.g., at 266, 270, 292, 316, and 321 nm in 4a1. The low-amplitude positive Cotton effect around 350 nm may be contributed mainly by the positive rotatory strength at 357 nm in 4a1 since the positive rotatory strength at 355 nm in another major conformer 4b1 is negligible and the contributions from the two minor conformers 4a2 and 4b2 would be very small.
Table 5.
Key transitions and oscillator and rotatory strengths of conformer 4a1 at the B3LYP/6-31G** level in the gas phase
| transition | ΔEa (eV) | λb (nm) | fc | R vel d | R len e |
|---|---|---|---|---|---|
| 203→204 | 3.47 | 357 | 0.063 | 11.2 | 13.3 |
| 202→205 | 3.86 | 321 | 0.044 | –11.0 | –19.2 |
| 201→204 | 3.92 | 316 | 0.013 | –22.6 | –24.3 |
| 202→206 | 4.24 | 292 | 0.075 | –35.9 | –39.9 |
| 199→204 | 4.60 | 270 | 0.277 | –55.0 | –56.8 |
| 197→205 | 4.67 | 266 | 0.019 | –16.0 | –17.9 |
| 198→206 | 4.98 | 249 | 0.035 | –2.5 | –12.7 |
| 202→208 | 5.00 | 248 | 0.088 | 44.0 | 44.8 |
| 197→206 | 5.10 | 243 | 0.038 | 51.8 | 56.6 |
| 192→205 | 5.22 | 237 | 0.014 | –15.0 | –17.7 |
| 200→208 | 5.32 | 233 | 0.149 | 23.7 | 39.0 |
| 190→206 | 5.480 | 226.3 | 0.017 | –20.9 | –21.9 |
| 194→205 | 5.483 | 226.1 | 0.012 | –15.3 | –15.3 |
| 191→204 | 5.50 | 225 | 0.012 | –14.0 | –13.6 |
Excitation energy.
Wavelength.
Oscillator strength.
Rotatory strength in velocity form (10-40 cgs).
Rotatory strength in length form (10-40 cgs).
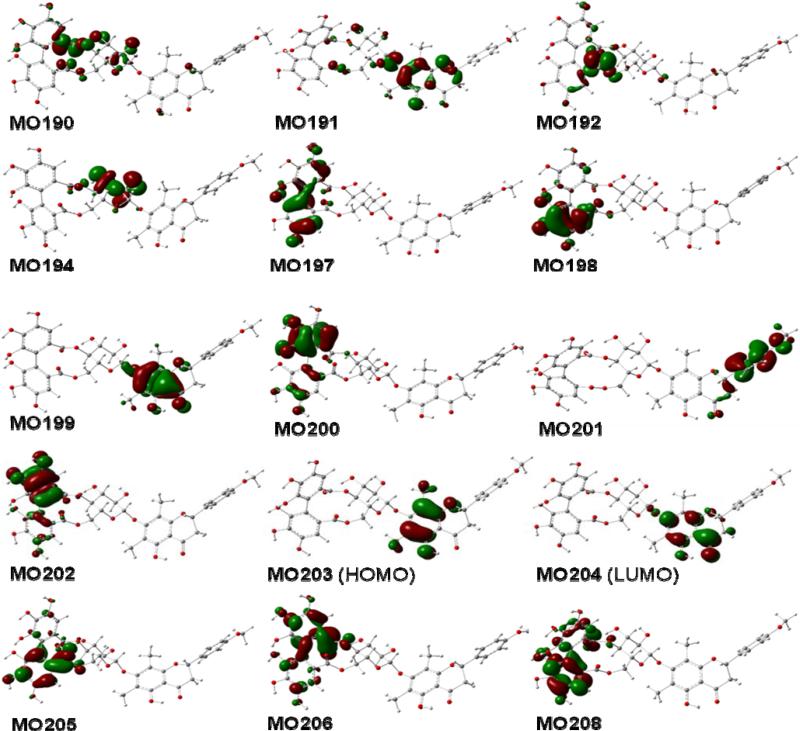
The calculated MOs of conformer 4a1 (Fig. 14) involved in the contributions to the aforementioned rotatory strengths, reveals the roles of the (aS)-HHDP and (2S)-flavanone moieties in generating the overall ECD of this molecule. The (aS)-HHDP moiety not only generates the two strong positive rotatory strengths at 243 nm (MO197 to MO206) and 248 nm (MO202 to MO208) but also three strong negative rotatory strengths at 266 nm (MO197 to MO206), 292 nm (MO202 to MO206), and 321 nm (MO202 to MO205). The latter three negative rotatory strengths synergize the two negative rotatory strengths from the (2S)-flavanone moiety at 270 nm (MO199 to MO204) and 316 nm (MO201 to MO204) contributing a broad Cotton effect in the 260-300 nm region. The positive rotatory strength at 357 nm (MO203 to MO204) of the (2S)-flavanone moiety represents the contribution of the diagnostic Cotton effect at the longer wavelength. In this case, it appears that the two chromophores have simple additive effects to the overall ECD spectrum and the original configurational assignment of 4 based on the empirical rules is thus confirmed.
Fig. (14).
Molecular orbitals involved in key transitions generating ECD spectrum of 4a1 at the B3LYP/6-31G** level in the gas phase.
To examine the reliability of the ECD calculation of 4 at the B3LYP/6-31G** level, single point energies of each conformer were calculated at the B3LYP/6-311++G**//B3LYP/6-31G** level in the gas phase, at the B3LYP-SCRF/6-31G**//B3LYP/6-31G** level with the COSMO model in MeOH, and at the B3PW91/6-31G**//B3LYP/6-31G** level in the gas phase. Minor changes for conformational distribution of conformers 4a1:4a2:4b1:4b2 were observed among the three levels, changing to 47.6:2.3:48.5:1.5%, 37.3:8.9:45.1:8.5%, and 45.2:8.2:45.1:8.5%, respectively. However, the calculated ECD spectra of each conformer at the above three levels were largely similar to the ones obtained by B3LYP/6-31G** in the gas phase. The weighted ECD spectra are shown in Fig. 13. Again, this indicates that the TDDFT with the modest basis set B3LYP/6-31G** would be a sufficient method for theoretical ECD calculation of flavonoids, in particular for dealing with relatively bulky naturally occurring compounds.
It is expected that the glucopyranosyl moiety has little effect on the ECD spectrum of mattucinol-7-O-β-d-glucopyranoside (2), as evidenced by the calculated ECD spectrum of mattucinol-7-O-β-l-glucopyranoside showing similar spectrum to that of 2.70 However, it would be interesting to probe the role of the glucopyranosyl moiety (as a linker between the two chromophores) in generating the ECD spectrum of 4. Thus, the β-d-glucopyranosyl unit in 4 was replaced with a β-l-glucopyranosyl moiety in the hypothetical mattucinol-7-O-[4″,6″-O-(aS)-hexahydroxydiphenoyl]-β-l-glucopyranoside. The calculated ECD spectrum of this compound is similar to that of 4, indicating that the AC of the glucopyranosyl unit has little effect on their ECD.70 Thus, the AC of the sugar residues in similar glycosides will have to be determined by other methods.
To further examine the interacting effect of the HHDP and the flavanone moieties, ECD calculation of a hypothetical compound mattucinol-7-O-[4″,6″-O-(aR)-hexahydroxydiphenoyl]-β-d-glucopyranoside was performed at the B3LYP/6-31G** level.70 As expected, the major rotatory strengths around 240 nm from the (aR)-HHDP moiety were reversed with a negative sign. However, the major rotatory strength at 270 nm of the (2S)-flavanone moiety in 4a1 was also reversed with a positive sign. The electronic interaction between the (2S)-flavanone and (aR)-HHDP moieties also produces two positive rotatory strengths, resulting in an overall broad positive Cotton effect in the 260-300 nm region. Assuming the experimental and calculated ECD spectra are similar, an erroneous 2R configuration may be assigned for the flavanone moiety based on the empirical rule requiring a positive Cotton effect in the 260-300 nm region. The complex interaction between chromophores in chiral molecules of this class clearly precludes ECD interpretation by simple empirical rules.
3.4 SESQUITERPENOIDS
3.4.1 Cycloabiesesquine A (5).72
Cycloabiesesquine A (5), isolated from the plant Abies delavayi, represents a conformationally flexible sesquiterpenoid. Conformational analysis and ECD calculations using the TDDFT method played a critical role in the structure elucidation of this novel natural product.
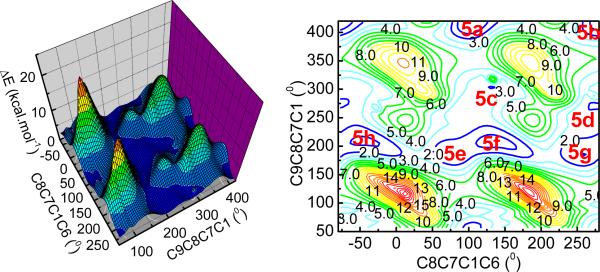
The relative configuration of compound 5 was initially deduced on the basis of NMR spectroscopy (Fig. 15). The potential energy surface of 5 was scanned at the AM1 level by rotating about the C8-C7 and C7-C1 bonds, resulting in eight minimum energy points (Fig. 16). All eight conformers (5a–5h) were relocated and confirmed at the B3LYP/6-31G** level. The single point energy in the gas phase at the B3LYP/6-311++G**//B3LYP/6-31G** level and in methanol solution at the B3LYP-SCRF/6-31G**//B3LYP/6-31G** level with the COSMO model were also calculated. Conformational analysis indicated that conformers 5e and 5g are predominantly populated: 5e accounts for 32–47% of conformations in the gas phase and 36% in methanol solution, while 5g represents 50–61% in the gas phase and 30% in methanol solution. The only difference between 5e and 5g is the orientation of the aromatic ring due to free rotation (Fig. 17). Both conformers are consistent with the observed NOE correlations and the small coupling constants between H-8 and H-12 (2.4 Hz) and between H-7 and H-8 (4.2 Hz) are in accord with calculated dihedral angles.
Fig. (15).
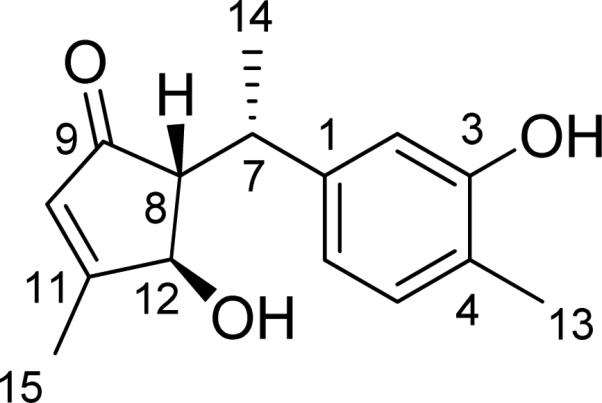
Structure of cycloabiesesquine A (5).
Fig. (16).
Potential energy surface of 5 at the AM1 level in the gas phase (left: 3D color map surface; right: contours).
Fig. (17).

Optimized geometries of predominant conformers 5e and 5g of compound 5 at the B3LYP/6-31G** level in the gas phase.
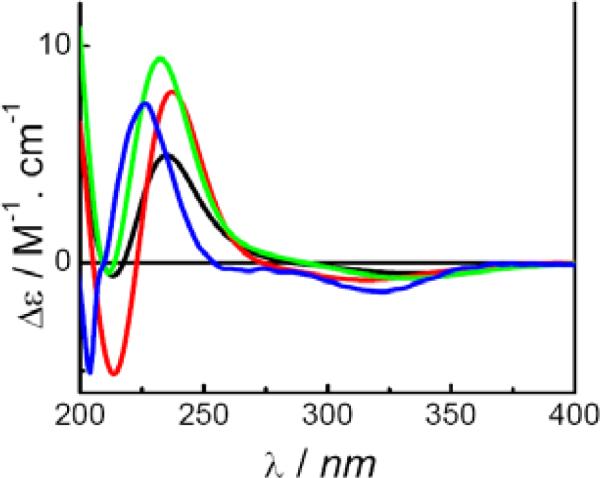
ECD spectra of conformers 5a–5h were calculated at the B3LYP/6-31G** and B3LYP/6-311++G**//B3LYP/6-31G** levels in the gas phase, and at the B3LYP-SCRF/6-31G**//B3LYP/6-31G** level with the COSMO model in methanol solution. It is important to note that only the predominant conformers 5e and 5g generated ECD spectra similar to the experimental ECD spectrum of 5. The weighted spectra of the eight conformers at the three levels are shown in Fig. 18. Overall, the calculated ECD spectra showed diagnostic negative and positive Cotton effects around 330 and 235 nm, respectively, consistent with the experimental ECD spectrum. Thus, the structure of 5 was unequivocally determined as (7S,8R,12R)-4,8-dihydroxy-1,3,5,10-tetraen-8,12-cyclobisabolan-9-one.
Fig. (18).
Calculated and experimental ECD spectra of compound 5 ( at the B3LYP/6-31G** level in the gas phase;
  at the B3LYP-SCRF/6-31G**// B3LYP/6-31G** level with the COSMO model in MeOH;
  at the B3LYP/6-311++G**//B3LYP/6-31G** level in the gas phase;
  experimental in MeOH).
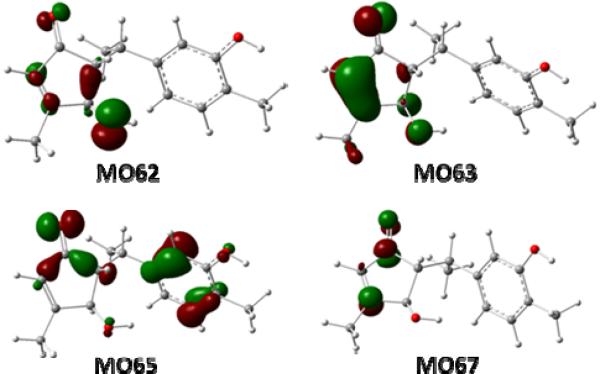
MO analysis of conformers 5e and 5g, at the B3LYP-SCRF/6-31G**//B3LYP/6-31G** level with the COSMO model in MeOH, provided comprehension of the production of the experimentally observed ECD spectrum of 5 at the molecular level. The electronic transitions from MO62 and MO63 to MO67 involving the electrons of the α,β-unsaturated ketone moiety in the cyclopentenone system (Fig. 19) afford positive rotatory strengths at 234 nm in both 5e and 5g, which are consistent with the strong positive Cotton effect at 226 nm in the experimental ECD spectrum of 5. The electronic transition from MO65 to MO67 contributes to the negative rotatory strengths at 321 nm in both 5e and 5g, which are associated with another diagnostic negative Cotton effect at 322 nm in the experimental ECD spectrum of 5.
Fig. (19).
Molecular orbitals involved in the key transitions in the ECD spectrum of conformer 5e at the B3LYP-SCRF/6-31G**//B3LYP/6-31G** level with the COSMO model in MeOH.
3.4.2 Quadrone A (6).62
The cytotoxic compound quadrone A (6), isolated from the fungus Aspergillus terreus, represents a conformationally rigid sesquiterpenoid (Fig. 20). The X-ray crystallographic data of this compound was available and its AC was determined by total synthesis as 1R, 2R,5S,8R,11R. This is a good model compound to demonstrate the reliability of the TDDFT calculation of its ECD spectrum for AC assignment.
Fig. (20).
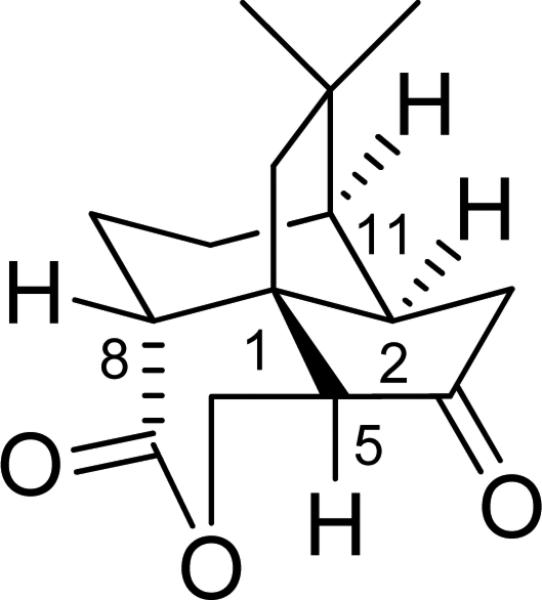
Structure of quadrone (6).
Initial conformational analysis of 6 was carried out using Monte Carlo searching together with the MMFF94 molecular mechanic force field. All stable conformations obtained were then optimized using DFT at the B3LYP/6-31G* level, affording three stable conformations. Using the B3LYP/6-31G* relative free energy, the most stable conformation was predicted to be >99%, i.e., there is only one single conformation for the molecule. The cyclohexane ring has a chair conformation, while the lactone ring has a boat conformation. The cyclopentanone ring is nonplanar. The calculated dihedral angles at the B3LYP/6-31G* level are very similar to those obtained from the X-ray crystallography.
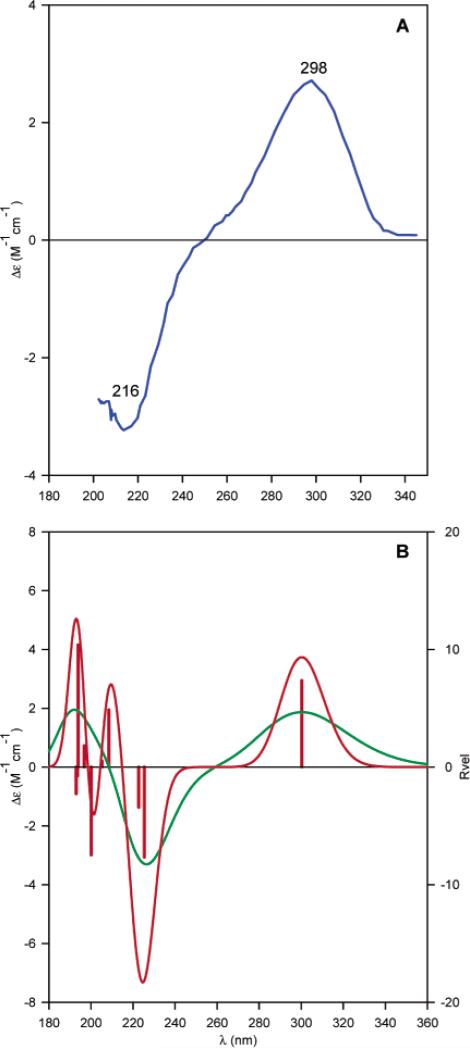
Next, TDDFT calculations of the ECD spectrum of 6 at the B3LYP/aug-cc-pVDZ level based on the B3LYP/6-31G* geometry were performed. Plots of the rotatory strengths against the wavelength and the simulated ECD spectrum are shown in Fig. 21. The calculated and experimental spectra are in good agreement over the relatively limited spectral range of the experimental spectrum. The positive Cotton effect at 298 nm and the negative Cotton effect at 216 nm are reproduced by the calculations. The lowest energy excitation, i.e., the n → π* transition of the ketone group, contributes to the diagnostic Cotton effect at 298 nm. This calculation is consistent with the previous AC assignment for 6 by chemical synthesis. In this work,62 the authors further calculated the ORD and VCD spectra of this compound, providing convincing evidence to demonstrate the power of theoretical calculation of chiroptical spectroscopy in determining the AC of this compound.
Fig. (21).
Experimental ECD spectrum of compound 6 in MeOH (A) and its calculated velocity representation B3LYP/augcc-pVDZ//B3LYP/6-31G* rotational strengths and simulated ECD spectrum (red line, σ = 0.2 eV; green line, σ = 0.4 eV). Reprinted with permission from ref. 62. Copyright 2006 American Chemical Society.
3.5 CEMBRANE-AFRICANENE TERPENOIDS
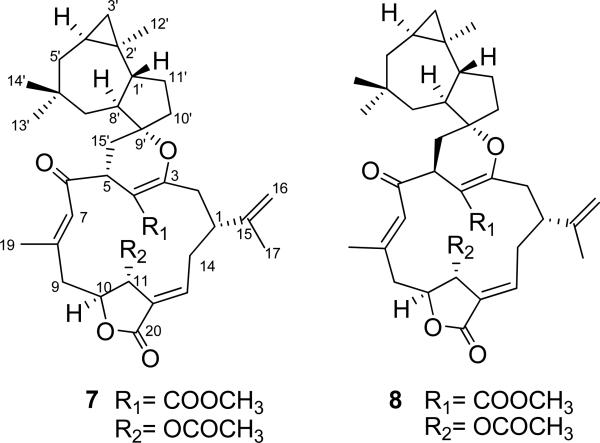
Cembrane-africanene terpenoids5 are a small of group of natural products comprising a conformationally flexible macrocyclic cembrane diterpenoid structural moiety and an africanene sesquiterpene unit. The structure elucidation of 7E-polymaxenolide (7) and 7E-5-epipolymaxenolide (8) (Fig. 22) isolated from the hybrid soft coral Sinularia maxima × S. polydactyla presents an interesting case of the successful utilization of the TDDFT calculation of their ECD spectra.5
Fig. (22).
Structures of 7E-polymaxenolide (7) and 7E-5-epipolymaxenolide (8).
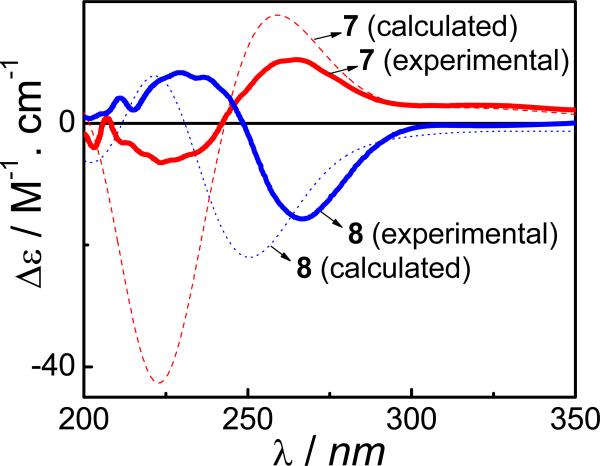
Initial X-ray crystallographic analysis determined the relative configuration of compound 7. On the basis of the X-ray coordinates, a starting conformation for 7 was constructed and optimized at the B3LYP/6-31G** level. It should be noted that an extensive conformational search for such a conformationally flexible molecule would require excessive computational time. Subsequent ECD calculation at the B3LYP-SCRF/6-31G**//B3LYP/6-31G** level afforded an ECD spectrum similar to the experimental one (Fig. 23), permitting determination of the AC of the compound. This was further confirmed by refinement of the structure using low-temperature (90K) X-ray diffraction data from a Bruker Kappa Apex-II diffractometer equipped with CuKα radiation, and was based on resonant scattering of the light atoms only, principally oxygen. It should be pointed out that despite the similarities between the calculated and experimental ECD spectra, differences are evidenced by the larger amplitude of the short wavelength Cotton effect near 220 nm in the calculated ECD spectrum presumably resulting from minor conformational differences between the calculated and solution conformers.
Fig. (23).
Calculated and experimental ECD spectra of compounds 7 and 8 at the B3LYP-SCRF/6-31G**//B3LYP/6-31G** level.
In the case of compound 8 which is configurationally different from 7 only at C5, the starting conformation was based on the optimized conformation of 8 at the B3LYP/6-31G** level. Geometric optimization at this level and subsequent ECD calculation at the B3LYP-SCRF/6-31G**//B3LYP/6-31G** level produced a simulated ECD spectrum very close to the experimental one (Fig. 22), confirming the AC assignment for this compound.
Reversing the C5 configuration led to almost opposite experimental ECD spectra for 7 and 8. Superficially, the calculated and experimental spectra of 7 and 8 may be interpreted such that these compounds are indeed enantiomers. However, comparison of the minimum energy conformers of 7 and 8 indicates the dramatic conformational changes, and hence vastly different chiroptical properties resulting from inversion of configuration at C5. Dreiding models and the energy-minimized molecular model of 8 clearly indicate that inversion of configuration at C5 realigns the electronic transition dipole moments of the exocyclic α,β-unsaturated lactone and ketone chromophores to now reflect negative exciton chirality21 and hence 5S as opposed to 5R configuration in compound 7.
3.6 DIHYDROPYRANOCOUMARINS
Scuteflorin A (9) (Fig. 24) is a new dihydropyranocoumarin isolated from the plant Scutellaria lateriflora. The AC of the single stereogenic center at C-3' was determined using TDDFT calculations, withthe contributions to the overall ECD spectrum of this compound from the dihydro-γ-pyranone-containing coumarin chromophore and the senecioyl chromophore being defined.73
Fig. (24).
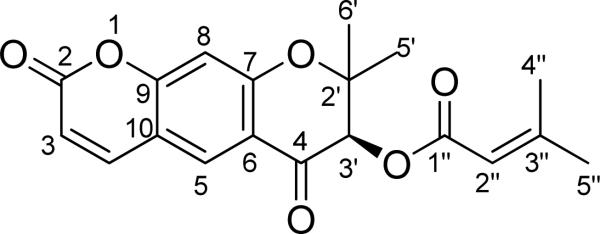
Structure of scuteflorin A (9).
The potential energy surface of 9 in the gas phase was scanned at the AM1 level by rotating about the C3′-O, C1″-O (C3′), and C1″-C2″ bonds. Six conformers were found and redefined at the B3LYP/6-31G** level. Conformational analysis indicated that conformer 9a is predominant [95.6% at the B3LYP/6-31G** level in the gas phase by Gibbs free energies and 95.9% at the B3LYP-SCRF/6-31G**//B3LYP/6-31G** level in methanol by total energies]. TDDFT calculation of the ECD of 9a was performed at the B3LYP/6-31G** and B3LYP/AUG-ccpVDZ//B3LYP/6-31G** levels in the gas phase and at the B3LYPSCRF/6-31G**//B3LYP/6-31G** level in methanol. The calculated ECD spectra of 9a in the gas phase and in methanol, together with the experimental ECD curve of 1 in MeOH, are shown in Fig. 25. The overall patterns of the calculated ECD spectra were consistent with that of the experimental one, i.e., a positive and negative Cotton effects in the 250-300 and 300-350 nm regions, respectively. Considering the extended π-system of the dihydro-γ-pyranone containing coumarin chromophore in 9, the positive Cotton effect near 260 nm and the shoulder near 290 nm in the experimental ECD spectrum would be characteristic for this molecule. This was supported by analysis of the MOs involved in key transitions generating the ECD spectrum of 9a at the B3LYP/6-31G** level in the gas phase. The calculated positive rotatory strength at 272 nm, which likely contributes to the positive Cotton effect near 260 nm in the experimental ECD spectrum, originates via the transitions from MO88 to MO91 (Fig. 26). Another calculated positive rotatory strength at 294 nm, indicative of the shoulder near 290 nm in the experimental ECD spectrum, is derived from the transition from MO90 to MO92. The calculated negative rotatory strength at 317 nm, which may be associated with the negative Cotton effect beyond 300 nm in the experimental ECD spectrum, is generated by the transition from MO90 to MO91. All four MOs involve the π-electrons in the dihydro-γ-pyranone containing coumarin chromophore. The calculated positive rotatory value at 257 nm, which originates via the transition from MO86 to MO93, also contributed to the positive Cotton effect near 260 nm in the experimental ECD spectrum. The strong calculated positive rotatory value at 210 nm results from the transition from MO87 to MO93. Since these three MOs involve the electrons of the α,β-unsatuated ester system that may rotate along the C3′-O (C1″), C1″-O (C3′), and C1″-C2″ bonds in solution, caution should be exercised in using the Cotton effects near these wavelengths to predict AC.
Fig. (25).
Calculated ECD spectra of conformer 9a and the experimental ECD of compound 1 (red  and olive
  , in the gas phase at the B3LYP/6-31G** level; black
  , in MeOH solvent at the B3LYP-SCRF/6-31G**//B3LYP/6-31G** level with COSMO; green
  , in the gas phase at the B3LYP/AUG-cc-pVDZ//B3LYP/6-31G** level; blue
  , experimental ECD in MeOH).
Fig. (26).
Molecular orbitals involved in key transitions in the ECD spectrum of 9a at the B3LYP/6-31G** level in the gas phase.
3.7 ALKALOIDS
3.7.1 Discorhabdins.68
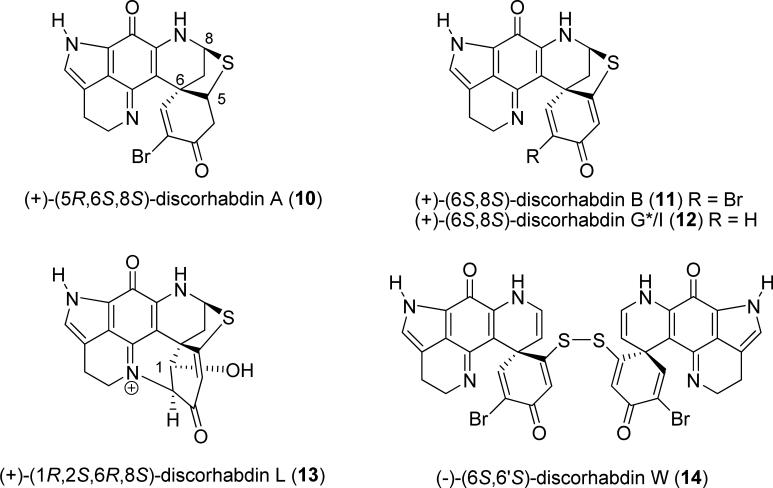
Enantiomeric pairs of the cytotoxic pyrroloiminoquinone marine alkaloids discorhabdins B (11), G*/I (12), L (13), and W (14) (Fig. 27) were isolated from Latrunculia species sponge collected at different locations around the coast of New Zealand. TDDFT calculations of their ECD spectra are particularly suitable for the determination of the AC of this class of compounds, including conformationally ridgid 11–13 and the conformationally flexible 14. 68
Fig. (27).
Structures of discorhabdins.
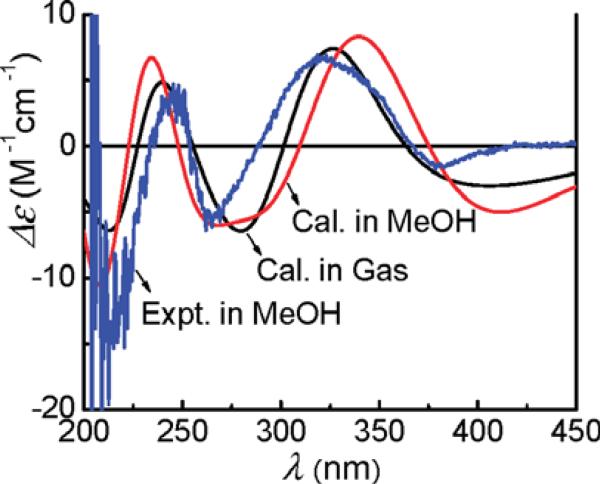
The feasibility and reliability of the TDDFT method on this class of compounds was first demonstrated by the calculation of the ECD spectrum of (+)-(5R,6S,8S)-discorhabdin/prianosin A (10), the AC of which was previously defined by X-ray crystallography analysis. The geometry of 14 was based on its crystal structure and optimized at the B3LYP/6-31G** level, affording a single optimized conformer. The ECD calculations of 10 were then conducted in the gas phase at the B3LYP/6-31G** level and further in methanol at the B3LYP-SCRF/6-31G**//B3LYP/6-31G** level. The calculated and experimentally observed ECD spectra are in excellent agreement (Fig. 28).
Fig. (28).
Calculated ECD spectra (σ = 0.20 eV) of (+)-(5R,6S,8S)-discorhabdin A (10) at the B3LYP/6-31G** level in the gas phase and the B3LYP-SCRF/6-31G** level in methanol compared to the experimental spectrum.
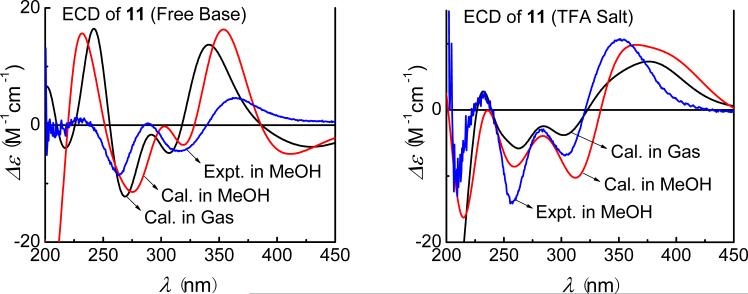
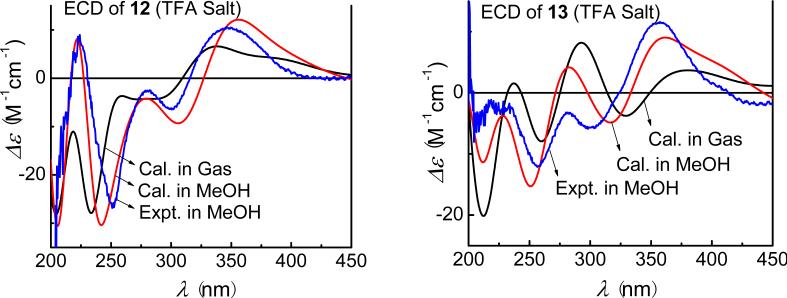
Due to structural similarities between these compounds, the starting conformations of 11–13 were constructed on the basis of the optimized geometry of 10. In fact, there is only one predominant conformer optimized at the B3LYP/6-31G** level for each compound. Minor differences for the experimental ECD spectra were observed for the free base and trifluoroacetate salt of 11, and calculations were thus performed on both forms. The calculated ECD spectrum of the salt is a better match than the free base (Fig. 29). For compounds 12 and 13, only the ECD spectra of their salts were calculated, which are also in good agreement with the experimental ones (Fig. 30).
Fig. (29).
Calculated ECD spectra ( B3LYP/6-31G** level;
  at the B3LYP-SCRF/6-31G** level) for (6S,8S)-discorhabdin B (11) in gas phase, methanol solvation model compared to experimental spectrum observed for (+)-11 (blue) as either free base or trifluoroacetate salt.
Fig. (30).
Calculated and experimental ECD spectra of (6S,8S)-discorhabdin G*/I (12) and (1R,2S,6R,8S)-discorhabdin L (13) as their trifluoroacetate salt ( B3LYP/6-31G**;
  at B3LYP-SCRF/6-31G**).
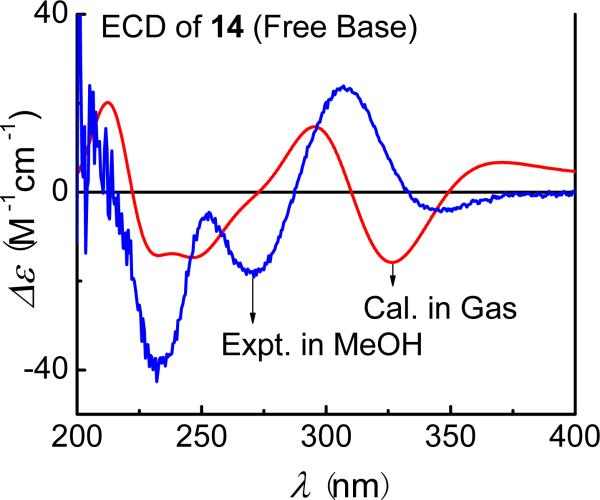
(–)-(6S,6′S)-Discorhabdin W (14) is presumably derived from (+)-discorhabdin B (11) via light-promoted dimerization. A conformational search was done at the AM1 level by rotating the C5-S(S-C5′) and (C5-S)S-C5′ bonds. Conformational analysis at this level afforded a predominant conformation with a population of 96%, which was used for the ECD calculation. The calculated and experimental spectra are overall consistent (Fig. 31), confirming the AC assignment of this dimeric discorhabdin.
Fig. (31).
Calculated (B3LYP/6-31G** level in gas phase) and experimental ECD spectra of (6S,6′S)-discorhabdin W (14).
A moer recent study on the TDDFT calculation of the ECD spectrum of a new discorhabdin analogue, discorhabdin Y from the deep-water Alaskan sponge Latrunculia sp., also resulted in an unequivocal assignment of its AC.96
3.7.2 Actinophyllic acid (15).74
(–)-Actinophyllic acid (15) is a novel alkaloid isolated from the tree Alstonia actinophylla as a carboxypeptidase U inhibitor. It has an unprecedented 2,3,6,7,9,13c-hexahydro-1H-1,7,8-(methanetriyloxymethano)pyrrolo[1′,2′:1,2]azacino[4,3-b]indole-8(5H)-carboxylic acid skeleton. Its relative configuration was confirmed by the total synthesis of (±)-15. To reduce the intermolecular interaction with solute and solvent molecules that may change spectroscopic properties, its carboxylic ester, (–)-15a (Fig. 32) was prepared and used for ECD calculations.74
Fig. (32).
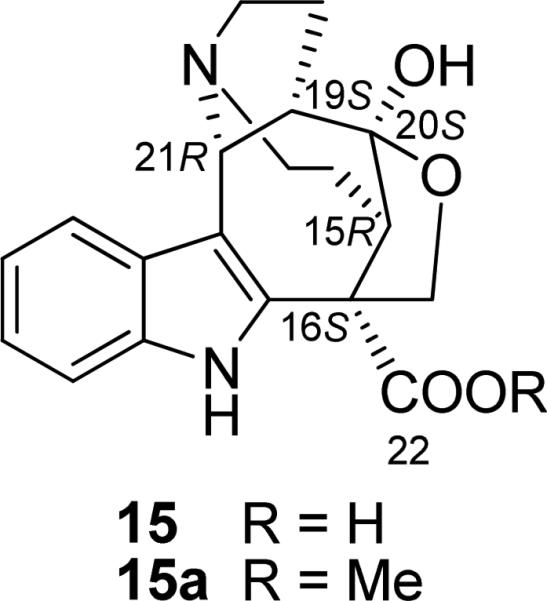
Structures of (–)-actinophyllic acid (15) and its methyl ester (15a).
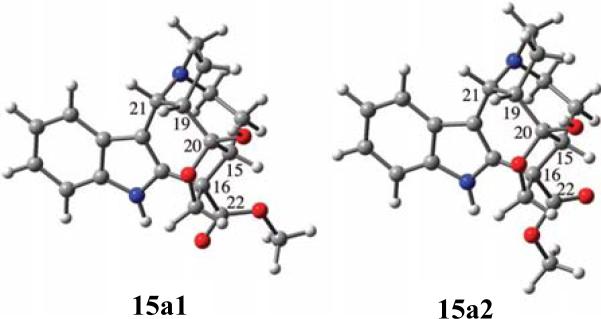
The initial structure for the calculation was arbitrarily presented as (15R,16S,19S,20S,21R)-15a, the enantiomer deduced by the proposed biosynthetic pathway starting with tryptamine and (–)-secologanin glucoside. An MMFF94 Monte Carlo search yielded only two conformers that differ in the orientation of the C22 ester group within a 10 kcal/mol window. Optimization of these conformers at the DFT/B3LYP/6-31G(d,p) level without considering solvent effects did not change these geometries significantly. Conformers 15a1 and 15a2 (Fig. 33) constitute 91.4 and 8.6%, respectively, of the conformational itinerary.
Fig. (33).
Two stable conformers of (15R,16S,19S,20S,21R)-15a optimized at the B3LYP/6-31G(d,p) level. Reprinted with permission from ref. 74. Copyright 2009 American Chemical Society.
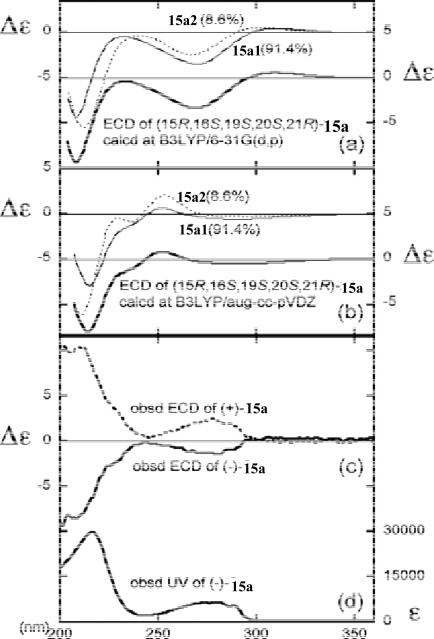
TDDFT calculations of the ECD spectrum of the two conformers were performed at the B3LYP/6-31G(d,p) and B3LYP/augcc-pVDZ levels. The theoretical spectrum by 6-31G(d,p) matched the experimental spectrum for (–)-15a: a negative broad band around 275 nm, an upward tendency close to zero around 240 nm, and a negative Cotton effect around 210 nm (Fig. 34). The spectrum calculated at aug-cc-pVDZ reproduced the negative shoulder around 230 nm well, although the upward region around 240 nm became weakly positive. The calculations confirmed the 15R,16S,19S,20S,21R-configuration of (-)-2, consistent with the conclusions deduced from theoretical calculation of its optical rotation.74
Fig. (34).
(a) Calculated ECD spectra of (15R,16S,19S,20S,21R)-15a at the B3LYP/6-31G(d,p) and (b) at the B3LYP/aug-cc-pVDZ levels. (c) Observed ECD and (d) UV spectra of 15a in methanol (0.25 mM). Reprinted with permission from ref. 74. Copyright 2009 American Chemical Society.
3.7.3 Shichizozygine (16).64
(+)-Schizozygine is one of a group of alkaloids that have been isolated from the East African plant Schizozygia caffaeoides. It can have either the 2R,7S,20S,21S AC as shown in Fig. 35 or 2S,7R,20R,21R, and was thus subjected to ECD calculation for configurational assignment.
Fig. (35).
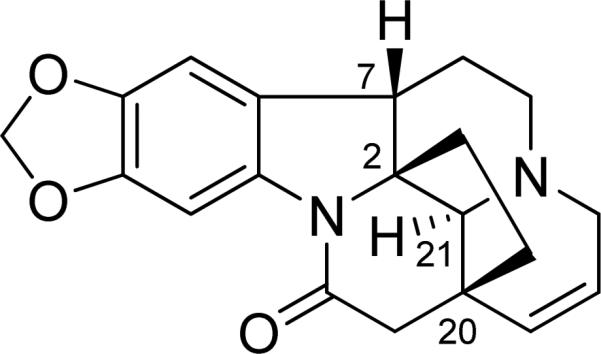
Structure of shichizozygine (16).
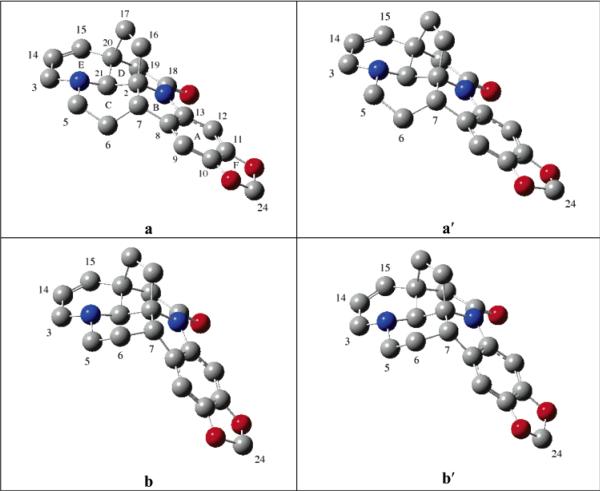
A Monte Carlo conformational search using the MMFF94 molecular mechanics force field identified two conformations, 16a and 16b (Fig. 36), 16a being lower in energy than 16b. Conformations 16a and 16b differ principally with regard to the conformation of ring C, which adopts boat and chair conformations, respectively. The geometries of conformations 16a and 16b were then optimized at the B3LYP/6-31G* level, indicating that ring-F of 16a and 16b is oppositely puckered, in contrast to the starting conformation obtained at the MMFF94 level where ring-F is close to planar. Thus, a potential energy surface scan at the B3LYP/6-31G* level, varying the dihedral angle C9-C10-O-C24 for both conformations 16a and 16b was performed, affording additional conformations, 16a′ and 16b′, respectively. Further conformational search at the B3LYP/6-31G* level, varying the dihedral angles C2-C21-C20-C19, C21-C2-C7-C6, C2-C21-N-C5, and C20-C21-N-C3, for conformations 16a and 16b did not yield additional conformers. The geometries of the four conformations were reoptimized at the B3LYP/TZ2P and B3PW91/TZ2P levels, and vibrational frequencies calculated. At all levels, the percentage populations of conformations 16a and 16a′ are 35-40% and the populations of conformations 16b and 16b′ are 10-15%. It is important to note that such a seemingly conformationally rigid molecule afforded four conformations via a careful conformational search.
Fig. (36).
B3PW91/TZ2P structures of the four conformations of (2R,7S,20S,21S)-16. Reprinted with permission from ref. 64. Copyright 2007 American Chemical Society.
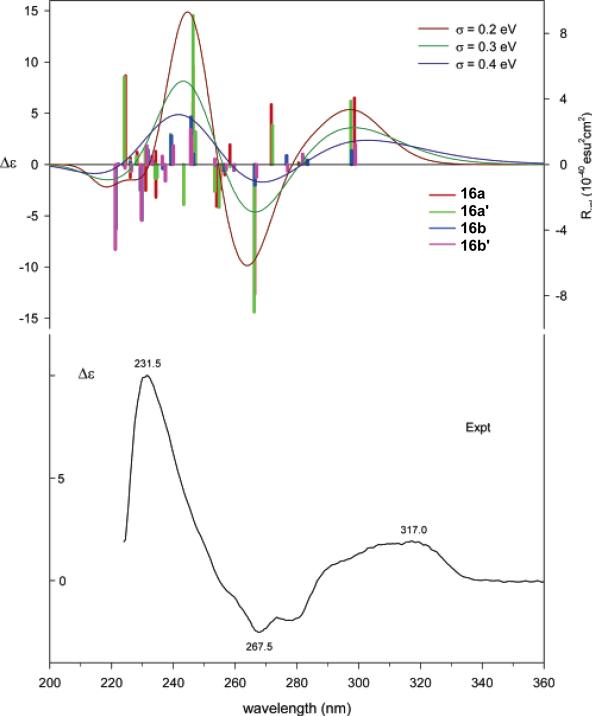
TDDFT calculations of the ECD spectra of the four conformers of (2R,7S,20S,21S)-16 were performed at the B3LYP/aug-cc-pVDZ//B3LYP/6-31G*, B3LYP/aug-cc-pVDZ//B3LYP/TZ2P, and B3LYP/aug-cc-pVDZ//B3PW91/TZ2P levels, all affording similar results. The small differences between length and velocity rotational strengths confirm that the aug-cc-pVDZ basis set is a good approximation to the basis set limit. The calculated ECD spectra of conformations 16a and 16a′ are similar, as are the spectra of conformations 16b and 16b', which differ significantly from those of the former. The conformationally averaged ECD spectra of (2R,7S,20S,21S)-16, based on the B3PW91/TZ2P geometries, are compared to the experimental spectrum in Fig. 37. The three calculated principal features at wavelengths around 300, 270, and 240 nm with positive, negative, and positive signs, respectively, in qualitative agreement with the experimental spectrum exhibiting positive, negative, and positive features at 317, 268 and 232 nm, allowed the AC assignment of this compound. In this study,64 theoretical calculation of optical rotations and VCD spectrum of 16 were also performed, providing convincing evidence for the AC assignment of this compound.
Fig. (37).
Comparison of B3LYP/aug-cc-pVDZ//B3PW91/TZ2P population-weighted velocity rotational strengths of the conformations of (2R,7S,20S,21S)-16 and the conformationally averaged ECD spectra, simulated using Gaussian band shapes (σ = 0.2, 0.3, and 0.4 eV), to the experimental ECD spectrum. Reprinted with permission from ref. 64. Copyright 2007 American Chemical Society.
3.8 DIHYDROXANTHENONES
In contrast to the above discussed examples where the experimental CD spectra were recorded in solution, a solid-state CD/TDDFT approach was successfully employed to determine the AC of globosuxanthone A (17) (Fig. 38), a cytotoxic dihydroxanthenone isolated from the endophytic fungi Chaetomium globosum and Microdiplodia sp. whose relative configuration was established by X-ray crystallography.65
Fig. (38).
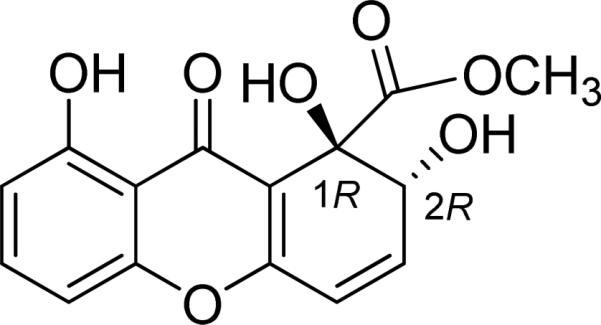
Structure of globosuxanthone A (17).
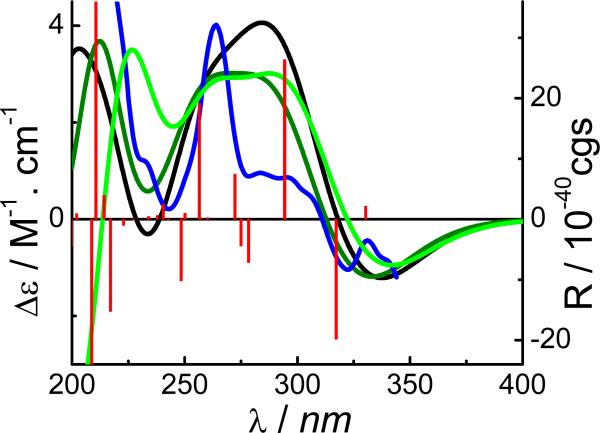
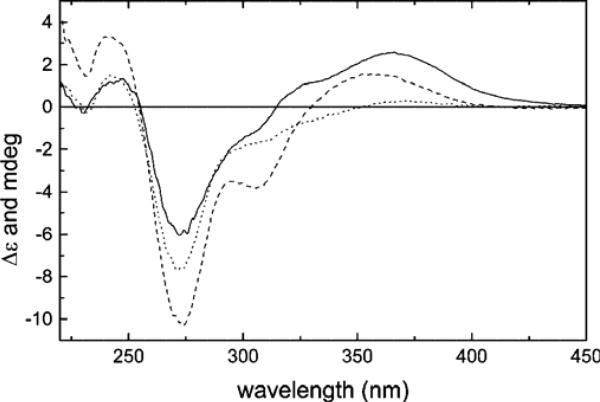
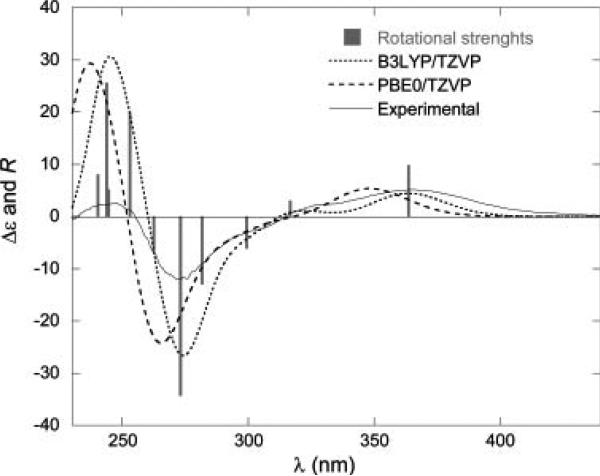
A solid-state ECD spectrum of 17 was acquired by using 0.13 mg sample mixed with 180.3 mg KCl. Despite some differences, the overall patterns of the solution and solid-state ECD spectra are similar for this particular compound presumably due to restrained conformation (Fig. 39). Using the X-ray coordinates and a chosen configuration (1R,2R), TDDFT calculations of its ECD at the B3LYP/TZVP and PBE0/TZVP levels were performed and the simulated spectra are shown in Fig. 40. It appears that the B3LYP/TZVP level better reproduces the main experimental features above 250 nm, in terms of wavelenth, sign, and amplitude of bands, including the weakest ones (shoulders at 303 and 326 nm).
Fig. (39).
ECD spectra of 17 measured in MeOH (dotted line), in MeCN/CH2Cl2/MeOH 1:1:1 (dashed line), and as KCl disc (solid line, in mdeg units). Reproduced with permission from ref. 65. Copyright Wiley-VCH Verlag GmbH & Co. KGaA.
Fig. (40).
ECD spectra of 17: experimental as KCl disc (solid line, multiplied by two), and computed with TDDFT with use of B3LYP/TZVP (dotted line) and PBE0/TZVP (dashed line). Vertical bars represent B3LYP-computed rotational strengths in 10–40 cgs units. Reproduced with permission from ref. 65. Copyright Wiley-VCH Verlag GmbH & Co. KGaA.
The advantage of this approach is the elimination of the conformational analysis step. A more recent example illustrated the assignment of the chiral axis of the natural product dioncophylline A using the TDDFD/B3LYP method and the more advanced DFT/MRCI approach.97 However, X-ray crystallography data is required to provide a starting conformation that would closely mimic the ‘solid’ conformation in the ECD measurement. In the case of a complex molecule with significant conformational flexibility where X-ray crystallography can only determine the relative configuration, this approach would be efficient and effective for AC assignment.
4. CONCLUSIONS
It is a chemists’ dream that a straightforward, non-destructive, easy to implement in silico method can be used to determine the AC of natural products. It appears that the TDDFD calculation of ECD spectra has emerged as a very promising tool in this regard. The fundamental issue of this approach is to utilize the conformers that best reflect their preferred conformations in solution. Generally, conformationally rigid molecules that possess restrained conformations will produce more reliable results, while conformationally flexible molecules require considerable efforts for conformational analysis and calculations. In most cases, conclusions for unambiguous configurational assignment can be drawn, even though the calculated ECD spectra do not perfectly match the experimental ones. However, cautions should be taken as minor conformational changes in some cases may cause significant changes of the calculated ECD spectra. Although ECD data may not provide complete stereochemical information of a structurally complex natural product with multiple stereogenic centers, the sensitivity of experimental ECD and simplicity of theoretical calculation highlights its advantages in determining the AC of natural products. ECD calculations may be further complemented by other chiroptical methods such as calculation of optical rotation values and VCD spectra. With the continued advancement of the computational technologies, it is expected that ECD calculations will become a routine tool for natural product chemists for AC assignment.
Table 3.
Conformational analysis of (2R,3S)-3 in the gas phase and in methanol solution
| Species | in gas phase | in methanol | ||||||
|---|---|---|---|---|---|---|---|---|
| Δ Ea | PE%b | Δ E′c | PE′%d | Δ Ge | PG%f | Δ Esg | PEs%h | |
| 3a1 | 0.41 | 10.0 | 0.39 | 7.8 | 1.30 | 3.2 | 2.86 | 0.3 |
| 3a2 | 0.00 | 19.8 | 0.02 | 14.7 | 1.07 | 4.7 | 2.44 | 0.5 |
| 3a3 | 0.67 | 6.4 | 0.51 | 6.4 | 0.88 | 6.5 | 3.85 | 0.1 |
| 3a4 | 0.11 | 16.6 | 0.00 | 15.2 | 0.63 | 9.9 | 2.87 | 0.2 |
| 3a5 | 0.53 | 8.2 | 0.23 | 10.2 | 0.78 | 7. 7 | 0.16 | 23.4 |
| 3a6 | 0.64 | 6.7 | 0.32 | 8. 9 | 0.39 | 14.7 | 0.00 | 30.8 |
| 3a7 | 0.43 | 9.6 | 0.15 | 11.8 | 0.00 | 28.6 | 1.29 | 3.5 |
| 3a8 | 0.37 | 10.5 | 0.08 | 13.3 | 0.25 | 18.7 | 0.42 | 15.2 |
| 3b1 | 2.84 | 0.2 | 3.06 | 0.1 | 4.15 | 0.0 | 4.84 | 0.0 |
| 3b2 | 5.12 | 0.0 | 5.17 | 0.0 | 5.77 | 0.0 | 8.42 | 0.0 |
| 3b3 | 2.52 | 0.3 | 2.71 | 0.2 | 3.34 | 0.1 | 6.42 | 0.0 |
| 3b4 | 4.85 | 0.0 | 5.04 | 0.0 | 6.11 | 0.0 | 6.99 | 0.0 |
| 3b5 | 0.31 | 11.7 | 0.16 | 11.5 | 0.93 | 5.9 | 0.10 | 26.1 |
Relative energy, relative energy with ZPE, and relative Gibbs free energy, respectively (kcal/mol).
Conformational distribution calculated by using the respective parameters above at the B3LYP/6-31G* level in the gas phase.
Relative energy, relative energy with ZPE, and relative Gibbs free energy, respectively (kcal/mol).
Conformational distribution calculated by using the respective parameters above at the B3LYP/6-31G* level in the gas phase.
Relative energy, relative energy with ZPE, and relative Gibbs free energy, respectively (kcal/mol).
Conformational distribution calculated by using the respective parameters above at the B3LYP/6-31G* level in the gas phase.
Relative energy (kcal/mol) and conformational distribution at the B3LYP-SCRF/6-31G*//B3LYP/6-31G* level with COSMO model in methanol solution, respectively.
Relative energy (kcal/mol) and conformational distribution at the B3LYP-SCRF/6-31G*//B3LYP/6-31G* level with COSMO model in methanol solution, respectively.
Acknowledgments
This work was supported in part by the USDA Agricultural Research Service Specific Cooperative Agreement No. 58-6408-2-0009 and NIH AI 027094.
REFERENCES
- 1.Mechlinski W, Schaffner CP, Ganis P, Avitabile G. Tetrahedron Lett. 1970;44:3873–3876. [Google Scholar]
- 2.Flack HD. Acta Crystallogr. Sect. A. 1983;39:876–881. [Google Scholar]
- 3.Flack HD, Bernardinelli G. J. Appl. Crystallogr. 2000;33:1143–1148. [Google Scholar]
- 4.Hooft RWW, Straver LH, Spek AL. J. Appl. Crystallogr. 2008;41:96–103. doi: 10.1107/S0021889807059870. [DOI] [PMC free article] [PubMed] [Google Scholar]
- 5.Kamel HN, Ding YQ, Li XC, Ferreira D, Fronczek FR, Slattery M. J. Nat. Prod. 2009;72:900–905. doi: 10.1021/np900040w. [DOI] [PubMed] [Google Scholar]
- 6.Fu X, Li X-C, Smillie TA, Carvalho P, Mabusela W, Syce J, Johnson Q, Folk W, Avery MA, Khan IA. J. Nat. Prod. 2008;71:1749–1753. doi: 10.1021/np800328r. [DOI] [PMC free article] [PubMed] [Google Scholar]
- 7.Nicolaou KC, Daines RA, Ogawa Y, Chakraborty TK. J. Am. Chem. Soc. 1988;110:4695–4705. [Google Scholar]
- 8.Nicolaou KC, Yang Z, Liu JJ, Ueno H, Nantermet PG, Guy RK, Claiborne CF, Renaud J, Couladouros EA, Paulvannan K, Sorensen EJ. Nature. 1994;367:630–634. doi: 10.1038/367630a0. [DOI] [PubMed] [Google Scholar]
- 9.Seco JM, Quiñoá E, Riguera R. Chem. Rev. 2004;104:17–117. doi: 10.1021/cr2003344. [DOI] [PubMed] [Google Scholar]
- 10.Dale JA, Mosher HS. J. Am. Chem. Soc. 1973;95:512–519. [Google Scholar]
- 11.Adams CM, Indranath Ghosh I, Kishi Y. Org. Lett. 2004;6:4723–4726. doi: 10.1021/ol048059o. [DOI] [PubMed] [Google Scholar]
- 12.Buist PH, Dale Marecak D, Holland HL, Brown FM. Tetrahedron-Asymmetry. 1995;6:7–10. [Google Scholar]
- 13.B'Hymer C, Montes-Bayon M, Caruso JA. J. Separ. Sci. 2003;26:7–19. [Google Scholar]
- 14.Hara S, Okabe H, Mihashi K. Chem. Pharm. Bull. 1987;35:501–506. [Google Scholar]
- 15.Tanaka T, Nakashima T, Ueda T, Tomii K, Kouno I. Chem. Pharm. Bull. 2007;55:899–901. doi: 10.1248/cpb.55.899. [DOI] [PubMed] [Google Scholar]
- 16.Klyne W. Biochem. J. 1950;47:xli–xlii. [PubMed] [Google Scholar]
- 17.Barton DHR. J. Chem. Soc. 1945:813–819. doi: 10.1039/jr9450000813. [DOI] [PubMed] [Google Scholar]
- 18.Moffitt W, Woodward RB, Moscowitz A, Klyne W, Djerassi C. J. Am. Chem. Soc. 1961;83:4013–4018. [Google Scholar]
- 19.Moscowitz A, Mislow K, Glass MAW, Djerassi C. J. Am. Chem. Soc. 1962;84:1945–1955. [Google Scholar]
- 20.DeAngelis GG, Wildman WC. Tetrahedron. 1969;25:5099–5112. [Google Scholar]
- 21.Harada N, Nakanishi K. Circular Dichroic Spectroscopy-Exciton Coupling in Organic Stereochemistry. University Science Books; Mill Valley, CA: 1983. [Google Scholar]
- 22.Harada N, Kohori J, Uda H, Toriumi K. J. Org. Chem. 1989;54:1820–1826. [Google Scholar]
- 23.Harada N, Uda H, Kobayashi M, Shimizu N, Kitagawa I. J. Am. Chem. Soc. 1989;111:5668–5674. [Google Scholar]
- 24.Ferris JP, Boyce CB, Briner RC, Weiss U, Qureshi IH, Sharpless NE. I Am. Chem. Soc. 1971;93:2963–2968. doi: 10.1021/ja00741a024. [DOI] [PubMed] [Google Scholar]
- 25.Slade D, Ferreira D, Marais JPJ. Phytochemistry. 2005;66:2177–2215. doi: 10.1016/j.phytochem.2005.02.002. [DOI] [PubMed] [Google Scholar]
- 26.Rodger A, Nordén B. Circular Dichroism and Linear Dichroism. Oxford University Press; Oxford, UK: 1997. [Google Scholar]
- 27.Fasman GD. Circular Dichroism and the Conformational Analysis of Biomolecules. Plenum Press; New York: 1996. [Google Scholar]
- 28.Berova N, Nakanishi K. In: Circular Dichroism Principles and Applications. Berova N, Nakanishi K, Woody RW, editors. John Wiley & Sons; New York: 2000. pp. 337–382. Chapter 12. [Google Scholar]
- 29.Berova N, Bari LD, Pescitelli G. Chem. Soc. Rev. 2007;36:914–931. doi: 10.1039/b515476f. [DOI] [PubMed] [Google Scholar]
- 30.Gaffield W. Tetrahedron. 1970;26:4093–4108. [Google Scholar]
- 31.Diedrich C, Grimme S. J. Phys. Chem. A. 2003;107:2524–2539. [Google Scholar]
- 32.Stephens PJ, McCann DM, Butkus E, Stoncius S, Cheeseman JR, Frisch MJ. J. Org. Chem. 2004;69:1948–1958. doi: 10.1021/jo0357061. [DOI] [PubMed] [Google Scholar]
- 33.Stephens PJ, McCann DM, Devlin FJ, Cheeseman JR, Frisch MJ. J. Am. Chem. Soc. 2004;126:7514–7521. doi: 10.1021/ja049185q. [DOI] [PubMed] [Google Scholar]
- 34.Schühly W, Crochett SL, Fabian WMF. Chirality. 2005;17:250–256. doi: 10.1002/chir.20164. [DOI] [PubMed] [Google Scholar]
- 35.McCann DM, Stephens PJ. J. Org. Chem. 2006;71:6074–6098. doi: 10.1021/jo060755+. [DOI] [PubMed] [Google Scholar]
- 36.Crawford TD, Tam MC, Abrams ML. J. Phys. Chem. A. 2007;111:12058–12068. doi: 10.1021/jp075046u. [DOI] [PubMed] [Google Scholar]
- 37.Stephens PJ, Devlin FJ, Gasparrini F, Ciogli A, Spinelli D, Cosimelli B. J. Org. Chem. 2007;72:4707–4715. doi: 10.1021/jo070302k. [DOI] [PubMed] [Google Scholar]
- 38.Ding Y, Li X-C, Ferreira D. J. Org. Chem. 2007;72:9010–9017. doi: 10.1021/jo071134z. [DOI] [PubMed] [Google Scholar]
- 39.Bringmann G, Bruhn T, Maksimenka K, Hemberger Y. Eur. J. Org. Chem. 2009:2717–2727. [Google Scholar]
- 40.Stephens PJ, Devlin FJ, Cheeseman JR, Frisch MJ. J. Phys.Chem. A. 2001;105:5356–5371. [Google Scholar]
- 41.Polavarapu PL. Chirality. 2002;14:768–781. doi: 10.1002/chir.10145. [DOI] [PubMed] [Google Scholar]
- 42.Stephens PJ, Devlin FJ, Cheeseman JR, Frisch MJ. Chirality. 2002;14:288–296. doi: 10.1002/chir.10039. [DOI] [PubMed] [Google Scholar]
- 43.Stephens PJ, Devlin FJ, Cheeseman JR, Frisch MJ, Bortolini O, Besse P. Chirality. 2003;15:S57–S64. doi: 10.1002/chir.10270. [DOI] [PubMed] [Google Scholar]
- 44.McCann DM, Stephens PJ, Cheeseman JR. J. Org. Chem. 2004;69:8709–8717. doi: 10.1021/jo048571n. [DOI] [PubMed] [Google Scholar]
- 45.Giorgio E, Roje M, Tanaka K, Hamersak Z, Sunjik V, Nakanishi K, Rosini C, Berova N. J. Org. Chem. 2005;70:6557–6563. doi: 10.1021/jo048023+. [DOI] [PubMed] [Google Scholar]
- 46.Stephens PJ, Pan JJ, Devlin FJ, Cheeseman JR. J. Nat. Prod. 2008;71:285–288. doi: 10.1021/np070502r. [DOI] [PubMed] [Google Scholar]
- 47.Aamouche A, Devlin FJ, Stephens PJ. Chem. Commun. 1999:361–362. [Google Scholar]
- 48.Aamouche A, Devlin FJ, Stephens PJ. J. Am. Chem. Soc. 2000;122:2346–2354. [Google Scholar]
- 49.Devlin FJ, Stephens PJ, Oesterle C, Wiberg KB, Cheeseman JR, Frisch MJ. J. Org. Chem. 2002;67:8090–8096. doi: 10.1021/jo020225n. [DOI] [PubMed] [Google Scholar]
- 50.Freedman TB, Cao X, Dukor RK, Nafie LA. Chirality. 2003;15:743–758. doi: 10.1002/chir.10287. [DOI] [PubMed] [Google Scholar]
- 51.Stephens PJ, McCann DM, Devlin FJ, Flood TC, Butkus E, Stoncius S, Cheeseman JR. J. Org. Chem. 2005;70:3903–3913. doi: 10.1021/jo047906y. [DOI] [PubMed] [Google Scholar]
- 52.Carosati E, Cruciani G, Chiarini A, Budriesi R, Ioan P, Spisani R, Spinelli D, Cosimelli B, Fusi F, Frosini M, Matucci R, Gasparrini F, Ciogli A, Stephens PJ, Devlin FJ. J. Med. Chem. 2006;49:5206–5216. doi: 10.1021/jm0604373. [DOI] [PubMed] [Google Scholar]
- 53.Monde K, Taniguchi T, Miura M, Vairappan CS, Suzuki M. Tetrahedron Lett. 2006;47:4389–4392. [Google Scholar]
- 54.Cerda-García-Rojas CM, Catalán CAN, Muro AC, Joseph-Nathan P. J. Nat. Prod. 2008;71:967–971. doi: 10.1021/np8000927. [DOI] [PubMed] [Google Scholar]
- 55.Crawford TD, Tam MC, Abrams ML. Mol. Phys. 2007;105:2607–2617. [Google Scholar]
- 56.Skomorowski W, Pecul M, Salek P, Helgaker T. J. Chem. Phys. 2007;127:085102/1–085102/1–085102/8. doi: 10.1063/1.2759203. [DOI] [PubMed] [Google Scholar]
- 57.Pecul M, Ruud K. Adv. Quant. Chem. 2005;50:185–212. [Google Scholar]
- 58.Kwit M, Sharma ND, Boyd DR, Gawronski J. Chem-Eur. J. 2007;13:5812–5821. doi: 10.1002/chem.200601851. [DOI] [PubMed] [Google Scholar]
- 59.Mori T, Inoue Y, Grimme S. J. Phys. Chem. A. 2007;111:7995–8006. doi: 10.1021/jp073596m. [DOI] [PubMed] [Google Scholar]
- 60.Giorgio E, Tanaka K, Ding W, Krishnamurthy G, Pitts K, Ellestad GA, Rosini C, Berova N. Bioorg. Med. Chem. 2005;13:5072–5079. doi: 10.1016/j.bmc.2005.04.007. [DOI] [PubMed] [Google Scholar]
- 61.Gawronski JK, Kwit M, Boyd DR, Sharma ND, Malone JF, Drake AF. J. Am. Chem. Soc. 2005;127:4308–4319. doi: 10.1021/ja042895b. [DOI] [PubMed] [Google Scholar]
- 62.Stephens PJ, McCann DM, Devlin FJ, Smith AB., III J. Nat. Prod. 2006;69:1055–1064. doi: 10.1021/np060112p. [DOI] [PubMed] [Google Scholar]
- 63.Stephens PJ, Pan JJ, Devlin FJ, Krohn K, Kurtan T. J. Nat. Prod. 2007;72:3521–3536. doi: 10.1021/jo070155q. [DOI] [PubMed] [Google Scholar]
- 64.Stephens PJ, Pan JJ, Devlin FJ, Urbanova M, Hajicek J. J. Org. Chem. 2007;72:2508–2524. doi: 10.1021/jo062567p. [DOI] [PubMed] [Google Scholar]
- 65.Hussain H, Krohn K, Floerke U, Schulz B, Draeger S, Pescitelli G, Antus S, Kurtán T. Eur. J. Org. Chem. 2007:292–295. doi: 10.1002/chir.20402. [DOI] [PubMed] [Google Scholar]
- 66.Stephens PJ, Pan J-J, Devlin FJ, Urbanova M, Julinek O, Hajicek J. Chirality. 2008;20:454–470. doi: 10.1002/chir.20466. [DOI] [PubMed] [Google Scholar]
- 67.Bringmann G, Gulder TAM, Reichert M, Gulder T. Chirality. 2008;20:628–642. doi: 10.1002/chir.20557. [DOI] [PubMed] [Google Scholar]
- 68.Grkovic T, Ding Y, Li XC, Webb VL, Ferreira D, Copp BR. J. Org. Chem. 2008;73:9133–9136. doi: 10.1021/jo801622n. [DOI] [PubMed] [Google Scholar]
- 69.Ross SA, Rodriguez-Guzman R, Radwan MM, Jacob MR, Ding YQ, Li XC, Ferreira D, Manly SP, Sorocenol GH. J. Nat. Prod. 2008;71:1764–1767. doi: 10.1021/np800446g. [DOI] [PubMed] [Google Scholar]
- 70.Ding Y, Li XC, Ferreira D. J. Nat. Prod. 2009;72:327–335. doi: 10.1021/np800146v. [DOI] [PMC free article] [PubMed] [Google Scholar]
- 71.Shukla YJ, Pawar RS, Ding Y, Li XC, Ferreira D, Khan IA. Phytochemistry. 2009;70:675–683. doi: 10.1016/j.phytochem.2009.02.006. [DOI] [PubMed] [Google Scholar]
- 72.Yang X-W, Ding Y, Li X-C, Ferreira D, Shen Y-H, Li SM, Wang N, Zhang W-D. Chem. Commun. 2009;25:3771–3773. doi: 10.1039/b905710b. [DOI] [PubMed] [Google Scholar]
- 73.Li J, Ding Y, Li X-C, Ferreira D, Khan SI, Smillie TJ, Khan IA. J. Nat. Prod. 2009;72:983–987. doi: 10.1021/np900068t. [DOI] [PubMed] [Google Scholar]
- 74.Taniguchi T, Martin CL, Monde K, Nakanishi K, Berova N, Overman LE. J. Nat. Prod. 2009;72:430–432. doi: 10.1021/np800665s. [DOI] [PMC free article] [PubMed] [Google Scholar]
- 75.Gan L-S, Zheng Y-L, Mo J-X, Liu X, Li X-H, Zhou C-X. J. Nat. Prod. 2009;72:1497–1501. doi: 10.1021/np900354q. [DOI] [PubMed] [Google Scholar]
- 76.Petrovic AG, He J, Polavarapu PL, Xiao LS, Armstrong D. W. Org. Biomol. Chem. 2005;3:1977–1981. doi: 10.1039/b501220a. [DOI] [PubMed] [Google Scholar]
- 77.Claps M, Parrinello N, Saa C, Varela JA, Caccamese S, Rosini C. Tetrahedron-Asymmetry. 2006;17:1387–1393. [Google Scholar]
- 78.Giorgio E, Tanaka K, Verotta L, Nakanishi K, Berova N, Rosini C. Chirality. 2007;19:434–445. doi: 10.1002/chir.20395. [DOI] [PubMed] [Google Scholar]
- 79.Tanaka T, Oelgemoller M, Fukul K, Aoki F, Mori T, Ohno T, Inoue Y. Chirality. 2007;19:415–427. doi: 10.1002/chir.20391. [DOI] [PubMed] [Google Scholar]
- 80.Ding S, Jia L, Durandin A, Crean C, Kolbanovskiy A, Shafirovich V, Broyde S, Geacintov NE. Chem. Res. Toxicol. 2009;22:1189–1193. doi: 10.1021/tx900107q. [DOI] [PMC free article] [PubMed] [Google Scholar]
- 81.Bicker W, Kacprzak K, Kwit M, Laemmerhofer M, Gawronski J, Lindner W. Tetrahedron-Asymmetry. 2009;20:1027–1035. [Google Scholar]
- 82.Sybyl 8.0. Tripos Inc.; www.tripos.com. [Google Scholar]
- 83.Spartan 02. Wavefunction, Inc.; www.wafefun.com. [Google Scholar]
- 84.Gaussian03. Gaussian, Inc.; www.gaussian.com. [Google Scholar]
- 85.Pecul M, Ruud K, Helgaker T. Chem. Phys. Lett. 2004;388:110–119. [Google Scholar]
- 86.Klamt A, Schürmann G. J. Chem. Soc., Perkin Trans. 2. 1993;2:799–805. [Google Scholar]
- 87.Klamt A. J. Phys. Chem. 1995;99:2224–2235. [Google Scholar]
- 88.Eckert F, Klamt A. AIChE J. 2002;48:369–385. [Google Scholar]
- 89.Al-Basheer W, Pagni RM, Compton RN. J. Phys. Chem. A. 2007;111:2293–2298. doi: 10.1021/jp068320d. [DOI] [PubMed] [Google Scholar]
- 90.Mori T, Inoue Y, Grimme S. J. Org. Chem. 2006;71:9797–9806. doi: 10.1021/jo061855i. [DOI] [PubMed] [Google Scholar]
- 91.Caccamese S, Caruso C, Parrinello N, Savarino A. J. Chromatogr. A. 2005;1076:155–162. doi: 10.1016/j.chroma.2005.04.024. [DOI] [PubMed] [Google Scholar]
- 92.Li X-C, Joshi AS, Tan B, ElSohly HN, Walker LA, Zjawiony JK, Ferreira D. Tetrahedron. 2002;58:8709–8717. [Google Scholar]
- 93.Duddeck H, Snatzke G, Yemul SS. Phytochemistry. 1978;17:1369–1373. [Google Scholar]
- 94.Li X-C, Jacob MR, Pasco DS, ElSohly HN, Nimrod AC, Walker LA, Clark AM. J. Nat. Prod. 2001;64:1282–1285. doi: 10.1021/np010172p. [DOI] [PubMed] [Google Scholar]
- 95.Okuda T, Yoshida T, Hatano T, Koga T, Toh N, Kuriyama K. Tetrahedron Lett. 1982;38:3937–3940. [Google Scholar]
- 96.Na M, Ding Y, Wang B, Tekwani BL, Schinazi RF, Franzblau S, Kelly M, Stone R, Li X-C, Ferreira D, Hamann MT. J. Nat. Prod. 2009 doi: 10.1021/np900281r. Article ASAP. DOI: 10.1021/np900281r. Publication Date (Web): September 23, 2009. [DOI] [PMC free article] [PubMed] [Google Scholar]
- 97.Bringmann G, Maksimenka K, Bruhn T, Reichert M, Harada T, Koroda R. Tetrahedron. 2009;65:5720–5728. [Google Scholar]


