Abstract
Purpose
To determine 1) how specific vocal fold structural and vibratory features relate to breathy voice quality and 2) the relation of perceived breathiness to four acoustic correlates of breathiness.
Method
A computational, kinematic model of the vocal fold medial surfaces was used to specify features of vocal fold structure and vibration in a manner consistent with breathy voice. Four model parameters were altered: vocal process separation, surface bulging, vibratory nodal point, and epilaryngeal constriction. Twelve naïve listeners rated breathiness of 364 samples relative to a reference. The degree of breathiness was then compared to 1) the underlying kinematic profile and 2) four acoustic measures: cepstral peak prominence (CPP), harmonics-to-noise ratio, and two measures of spectral slope.
Results
Vocal process separation alone accounted for 61.4% of the variance in perceptual rating. Adding nodal point ratio and bulging to the equation increased the explained variance to 88.7%. The acoustic measure CPP accounted for 86.7% of the variance in perceived breathiness, and explained variance increased to 92.6% with the addition of one spectral slope measure.
Conclusions
Breathiness ratings were best explained kinematically by the degree of vocal process separation and acoustically by CPP.
INTRODUCTION
Perceptual evaluation of voice quality is important in determining the presence and severity of a voice disorder. In spite of persistent concerns regarding reliability and validity, perceptual judgment remains the standard to which instrumental measurements are compared (Hillenbrand, Cleveland, & Erickson, 1994; Shrivastav & Sapienza, 2003; Kreiman, Gerratt, & Antoñanzas-Barroso, 2007; Kempster et al., 2009). Though the presence and type of laryngeal pathology are typically diagnosed using imaging techniques such as endoscopy and stroboscopy, the presence and severity of a voice disorder, as well as the success of treatment, continue to be determined by perceptual evaluation (Kreiman et al., 1993). In addition to perceived quality, acoustic measures are often used to demonstrate change with treatment. A common finding in treatment studies is that some of these measures signal improvement while others do not (Kotby et al., 1991; Chen et al, 2007; Hoffman et al., 2010; Little, Costello, & Harries, 2011; Colton et al., 2011). This is likely because voice quality results from auditory decoding of the acoustic signal radiated at the lips, and the radiated acoustic signal is the product of the anatomical structure, kinematic characteristics, and aeroacoustic interactions of the larynx and vocal tract. Understanding how the voice production system shapes the acoustic quantities, then, is essential for relating a voice quality percept to vocal health.
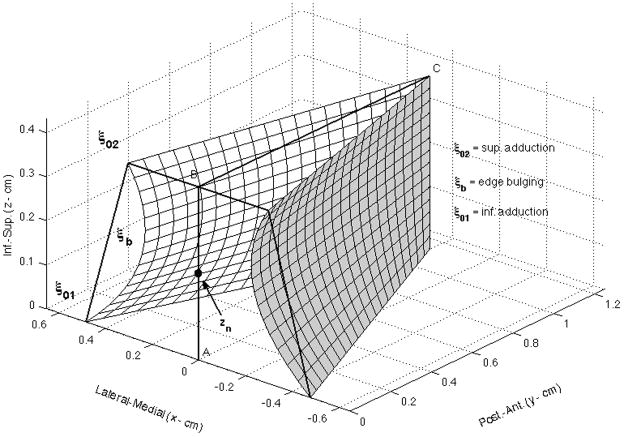
It is difficult, however, to study the voice producing system in humans directly because of the highly invasive nature, or impossibility, of acquiring signals generated within the larynx and vocal tract. An alternative is to develop a model of the system that simulates the sound producing mechanisms such that acoustic and aerodynamic quantities are generated analogously to the human system. Samlan and Story (2011) (henceforth referred to as SS11) reported a study in which vowels were simulated with a computational model of vocal fold vibration and acoustic wave propagation in the vocal tract. The model is based on the kinematic representation of the medial surfaces of the folds in which vibration is specified by superimposing a time-varying component onto a postural component, as shown in Fig. 1 (Titze, 1984; Titze, 1989; Titze, 2006a). The signals produced by varying the vocal process separation, nodal point ratio, shape of the vocal fold edge, and epilaryngeal constriction were used to determine cepstral peak prominence (CPP) and the amplitude of the first harmonic relative to the second (H1*-H2*). This allowed for understanding the causal relation between the sound-producing system and acoustic measures that could be used in clinical assessment. Perceptual rating of voice quality was not considered in SS11 and the purpose of the current study is to assess the relation of the anatomic/kinematic features and the acoustic measures to perceived breathiness ratings.
Figure 1. Kinematic Vocal Fold Model.
A snapshot of the simulated vocal fold surface during abduction. ξ02 and ξ01 are the distances from B and A, respectively, to the labeled points at the vocal process. Vocal fold thickness (T) and length (L) are defined as the distances between points A and B, and B and C, respectively. The nodal point zn is located between A and B, and is represented in this study as Rzn = zn/T. For the simulations, ξ02. ξb, and Rzn were directly manipulated to vary vocal process separation, bulging, and nodal point ratio, respectively.
Two sets of hypotheses arising from SS11 are tested. The first set (Hypotheses 1–4) involves changes in perceived breathiness when individual anatomic and kinematic model parameters are varied. The second set (Hypotheses 5–8) relates to how closely acoustic measures vary with perceived breathiness.
Relation of Laryngeal Anatomy and Kinematics to Breathy Voice Quality
Hypothesis 1: Increasing vocal processes separation will increase perceived breathiness
Breathiness has been defined as “audible air escape in the voice” (Kempster et al., 2009) and though it likely is not independent from other qualities such as asthenia or roughness (see Kreiman, Gerratt, & Berke, 1994, for a review), breathiness is often described as a consequence of increased airflow, which can be moderated through vocal process separation (Fritzell et al., 1986). Though correlation between the size of the glottal gap and breathiness is not always high (Södersten & Lindestad, 1990; Rammage, 1992), increasing vocal process separation, parameterized by ξ02, caused decreasing CPP in SS11 and is expected to increase perceived breathiness.
Hypothesis 2: Decreasing nodal point ratio will increase perceived breathiness
The nodal point (zn) is the pivot point for the rotational mode of vocal fold vibration and related to the point of mucosal upheaval (Yumoto, Kadota, & Kurokawa, 1993; Yumoto, Kadota, & Kurokawa, 1995; Yumoto, Kadota, & Mori, 1996; Titze & Story, 2002). In the kinematic computational model used for SS11 and the current study, it was represented as the ratio of the nodal point to the superior-inferior thickness of the vocal folds (see Fig. 1), such that a “nodal point ratio” is defined as Rzn = zn/T. The model is explained in more detail in the method section. In SS11, CPP was generally higher and H1*-H2* lower when nodal point ratio was high, leading to the expectation for the current study that decreasing nodal point ratio will be perceivable in the output pressure signal and captured as an increase in auditory-perceptual ratings of breathiness.
Hypothesis 3: Increasing edge bulging will decrease perceived breathiness
The curvature of the vocal fold edge is defined in the computational model as “bulging” (ξb) and can be seen in Fig. 1. Increasing ξb should assist adduction, lessening the effects of vocal process separation (Alipour & Scherer, 2000). In SS11, increasing ξb delayed the CPP decrease and lowered the maximum H1*-H2* increase that occurred with vocal process separation. Increased bulging is expected to decrease the perceived breathiness.
Hypothesis 4: Increasing epilaryngeal constriction will decrease perceived breathiness
The expectation of decreased breathiness with epilaryngeal constriction is based on previous modeling and excised larynx research demonstrating interactions between the source and filter. A narrowed epilarynx can increase inertance and skew the glottal flow relative to the glottal area, increasing the harmonic energy and producing new harmonic frequencies (Titze & Story, 1997; Titze, 2001; Titze, 2008). These changes should decrease perceived breathiness. Though epilaryngeal narrowing can also influence the modes of vocal fold vibration and lower phonation threshold pressure (Döllinger, Berry, & Montequin, 2006; Titze, 2008), this type of interaction is not possible in the model used for the current study.
Relation of Acoustic Measures to Breathy Voice Quality
The incomplete glottal closure and subsequent changes in glottal area and glottal flow are thought to lead to a series of acoustic consequences, including a large amplitude of the fundamental frequency component of the signal with a steep spectral slope and turbulent noise energy replacing the higher harmonic energy (Klatt & Klatt, 1990; Childers & Lee, 1991; Hillenbrand, Cleveland, & Erickson, 1994; Hanson, 1997). While many different measures have been proposed, the important and useful acoustic cues will be those that can be perceived, are used by listeners, and reflect the hypothesized underlying physiology (cf. Kreiman, Gerratt, & Antoñanzas-Barroso, 2007). Four acoustic measures thought to reflect the underlying physiology were selected for the current study: CPP, H1*-H2*, B0-B2, and HNR. Specific hypotheses follow.
Hypothesis 5: As CPP decreases, perceived breathiness will increase
One type of cepstrum is the log power spectrum of the log power spectrum (Bogert, Healy, & Tukey 1963; Oppenheim, Schafer, & Stockham Jr, 1968) and the CPP is measured as the prominence of the first rahmonic (peak) above a regression line that normalizes the energy of the cepstrum so accurate comparisons can be made across samples. CPP reflects the regularity and intensity of harmonics in the radiated acoustic signal; low CPP has been associated with more severe overall quality and breathiness ratings than high CPP (Hillenbrand, Cleveland, & Erickson, 1994; Hillenbrand & Houde, 1996; Heman-Ackah, Michael, & Goding, 2002; Awan, Roy, & Dromey, 2009). In SS11, CPP decreased as the simulated distance between the vocal processes increased and it is anticipated that breathiness will increase as vocal process separation increases. It is therefore expected that, consistent with the literature, mean breathiness rating and CPP will be inversely related.
Hypothesis 6: As H1*-H2* increases, perceived breathiness will not consistently increase or decrease
H1*-H2* is also thought to vary with incomplete glottal closure (Holmberg et al., 1995), and correspond to breathiness (Fischer-Jorgensen, 1967; Huffman, 1987; de Krom, 1995; Wayland & Jongman, 2003). This is a measure of the spectral slope of the low frequencies, and correction of the harmonic amplitudes for the effect of the first resonance of the vocal tract (F1) (Hanson, 1997) or multiple resonances (Iseli, Shue, & Alwan, 2007) has been advocated as an inverse filter to better approximate the glottal flow spectrum and compare results across vowels and speakers. H1*-H2* (the asterisk denoting corrected amplitudes) has been shown to relate to variability in the glottal pulse and spectral shapes (Kreiman, Gerratt, & Antoñanzas - Barroso, 2007), to be perceivable by listeners in the range produced by speakers (Kreiman & Gerratt, 2010), and H1-H2 can be used as a primary cue to phonemic breathiness (Esposito 2010). This measure, though, has been shown to be weak in its ability to differentiate degree of breathiness of normal and voice disordered subjects (Klatt & Klatt, 1990; Hillenbrand, Cleveland, & Erickson, 1994; Hillenbrand & Houde, 1996; Hartl et al., 2003; Holmberg et al., 2003; Shrivastav, 2003) and is influenced by nasality (Simpson, 2012).
In SS11, H1*-H2* increased with vocal process separation until a critical separation value, then decreased with further vocal process separation. Further analysis showed that the decreasing H1*-H2* was the result of aerodynamic interaction with the vocal tract rather than reflecting the glottal area open quotient (SS11). For the current study, it was anticipated that perceived breathiness would increase primarily based on vocal process separation and that, consistent with SS11, H1*-H2* would first increase and then decrease with increasing breathiness.
Hypothesis 7: As HNR decreases, perceived breathiness will increase
Variants of harmonics-to-noise (HNR), noise-to-harmonics (NHR), and signal-to-noise (SNR) ratios are measures thought to relate, in part, to overall severity and breathiness ratings (Martin, Fitch, & Wolfe 1995; de Krom, 1995; Heman-Ackah, Michael, & Golding, 2002; Heman-Ackah et al., 2003; Schindler et al., 2008; Cantarella et al., 2010). As previously described, noise energy replacing higher harmonic energy is characteristic of breathy voices and it was therefore expected that HNR would decrease as breathiness increased.
Hypothesis 8: As B0-B2 decreases, perceived breathiness will increase
Studies of the effects of spectral tilt on perceived breathiness have been inconclusive. Spectral tilt measures have been shown to correlate with breathiness (Fukazawa, El-Assuooty, & Honjo, 1988; Hartl et al., 2003), differentiate male from female voices, and possibly relate to degree of glottal closure (Hanson, 1997; Hanson & Chuang, 1999). In other studies, they were less clearly related to breathiness (Hillenbrand, 1988; Hillenbrand, Cleveland, & Erickson, 1994; de Krom, 1995; Hillenbrand & Houde, 1996). The contradictory findings are likely related both to differences in spectral tilt measurement and the reality that both inharmonic (noise) and harmonic components can increase overall spectral energy in the mid to high frequencies so that both non-breathy and breathy voices can have low spectral tilt (Hillenbrand & Houde, 1996; Kreiman, Gerratt, & Antoñanzas-Barroso, 2007). For the current study, spectral tilt was quantified with a measure referred to as B0-B2, which is the difference of energy in two frequency bands extending from 59–398 Hz (B0) and 2003–5001 Hz (B2), respectively. Decreased energy in B0 and increased noise in B2 are expected to occur in breathier voice, leading to a decreasing B0-B2 value with increasing breathiness.
METHOD
Kinematic Model
The computational model allows inputs that specify the postural and vibratory characteristics of the medial surfaces of vocal folds based on Titze (1984, 1989, 2006a). When coupled to a tracheal and vocal tract system, the model produces simulated signals such as glottal area (Ag), glottal flow (Ug), and radiated acoustic pressure (Pout). These signals can be analyzed or presented to listeners.
The medial surfaces of the vocal folds are shown in Fig.1 as a prephonatory postural configuration where the y-axis represents the fold length, L, in the posterior-anterior dimension and the z-axis represents the fold thickness, T, in the superior-inferior dimension. The prephonatory configuration in the x-direction, as function of y and z, is defined according to Titze (2006a) as,
| (1) |
where ξ02 is the distance of each vocal fold from midline at the antero-posterior location of the vocal process and superior-inferior location of the superior edge of the fold, ξ01 is similarly the distance of each fold from midline at the inferior edge, and ξb is a bulging parameter that specifies the curvature of the vocal fold surface. The surfaces are discretized such that there are 21 sections along the y-dimension and 15 sections along the z-dimension.
A vibrational component ξ(y,z,t) is then superimposed on the postural configuration to generate the time-varying glottal width,
| (2) |
The vibrational pattern is specified as
| (3) |
where ξm is the displacement amplitude at the midmembranous vocal fold, ω is the radian frequency, and c is the phase velocity of a mucosal wave traveling in the z direction. The vibrational pattern results from a combination of a translational mode representing the latero-medial movement in the horizontal plane, and a rotational mode, that determines the differential movement of the superior and inferior edges of the folds in the vertical plane. The rotational mode specifies the movement pattern often referred to as vertical phase difference, or mucosal wave. The nodal point (zn) is the pivot point around which the rotational mode changes phase. The amplitude and phase of the two modes were chosen so that an upward travelling mucosal wave is produced along the z-dimension (Titze, 2006a, p. 198). A sine function defines the anterior-posterior vibration pattern as a standing wave such that the displacement is zero at both y=0 and y=L (the length of the vocal folds), and maximum at y=L/2. Thus the vibrational pattern is superimposed on whatever configuration is set by the postural parameters in Eqn.1. It is noted that although ξ02 and ξb are specified directly, ξ01 is set automatically by a convergence rule such that ξ01 = (0.4–0.44zn/T)+ ξ02.
Glottal area is derived by calculating the minimum cross-sectional area in the x-y plane along the 15 z-dimension sections and summing them over the 21 sections in the y-dimension. The glottal area is then aerodynamically and acoustically coupled to the vocal tract (Liljencrants, 1985; Story, 1995; Titze, 2002) which generates the glottal flow signal in time synchrony with the acoustic pressures present at entrances to the trachea and vocal tract. The acoustic pressure radiated at the lip termination of the vocal tract is the output signal and is analogous to an audio recording.
The model was modified from that described by Titze (Titze, 1984; Titze, 1989; Titze, 2006a) to separate control of individual parameters from the rules that typically govern their relation. The modification was necessary to achieve the aims of the current study to assess the individual contributions of ξ02, Rzn, and ξb to vocal function and voice quality, and it is recognized that they likely covary in human phonation.
Aspiration noise is produced by turbulence when the airflow through the glottis is high. The effect of turbulence was approximated by adding a noise component to the glottal flow when the Reynolds number exceeded a threshold value. This approach has been often used in speech production modeling for both aspiration and fricative type sounds (e.g., Fant, 1960; Flanagan & Cherry, 1969), although it is clearly recognized that the physical realities of jet structure, vortex shedding, production of dipole and quadrupole noise sources, and potential multiple locations of such sources are not represented.
The specific formulation of a noise source added to the glottal flow used in this study is based on Titze (2006a, p. 263). At every time instant the Reynolds number is calculated as
| (4) |
where Ug is the instantaneous glottal flow, ρ is the air density, and μ is the air viscosity. If the Reynolds number has been specified with respect to particle velocity, an effective glottal diameter would appear in the numerator of the formula. Substitution of glottal flow, however, mathematically causes the glottal length, L, to appear in the denominator, and eliminates the effective diameter from the formula.
The noise component of the flow is then generated in the form proposed by Fant (1960) such that,
| (5) |
where Nf is a broadband noise signal (random noise generated with values ranging in amplitude from −0.5 to 0.5) that has been band-pass filtered between 300–3000 Hz (2nd order Butterworth), and Rec is a threshold value below which no noise is allowed to be generated. Fant (1960, p. 274) suggested that Rec should be on the order of 1800 or less for fricative sounds. Based on spectral analysis of simulated vowels and preliminary listening experiments, a value of Rec=1200 was chosen, along with the scaling factor of 4×10⁻⁶, for all subsequent simulations in this study. The result is a noise source whose amplitude is modulated by the periodic variation of the non-turbulent glottal flow.
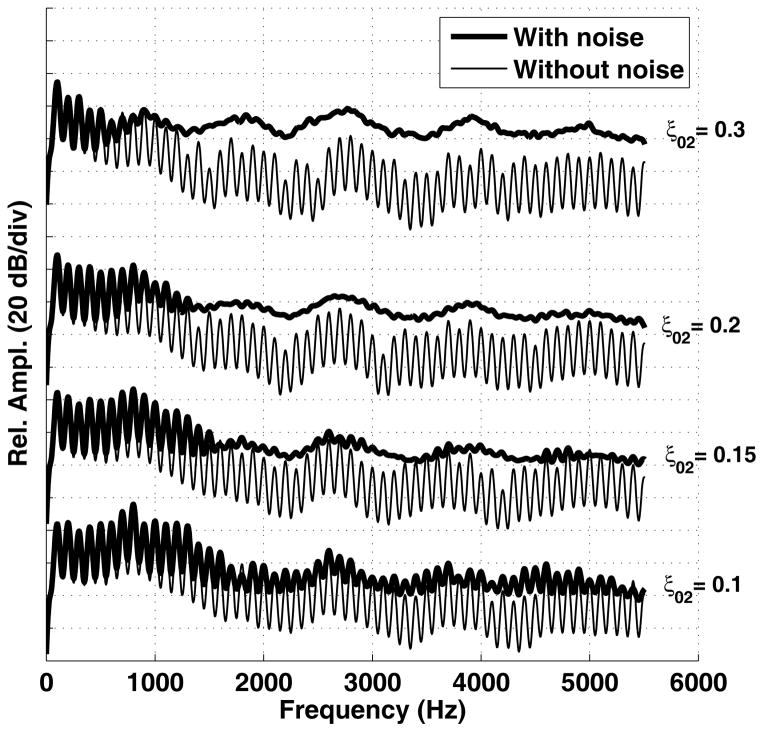
To demonstrate the effect of the noise component on the radiated pressure spectrum, four /a/ vowels were simulated for which the vocal process separation (ξ02) was set at values of 0.15, 0.2, 0.25, and 0.3 cm; the bulging parameter was set to ξb = 0.1 cm, and the nodal point ratio was 0.7. Spectra of each vowel are shown in Fig. 2. The thick lines indicate the case when the noise component was included and the thin lines are the spectra without a noise component. Clearly, an increase in vocal process separation increases the noise present for frequencies above 2000 Hz and consequently decreases the harmonically-related energy.
Figure 2. Spectra of radiated output pressure signal with and without the noise component.
Spectra generated from the output pressure signals when (ξ02) was 0.15, 0.2, 0.25, and 0.3 cm. Key: Thick lines = noise component included, Thin lines = no noise.
The vocal tract was configured as an /a/ vowel based on the area function reported in Story (2008). For this vowel, the “neutral” (original measured) cross-sectional area of the epilarynx at a point 1.2 cm superior to the glottis was 0.36 cm2. For the cases with a “constricted” epilarynx, the cross-sectional area of the vocal tract area was smoothly modified to reach 0.2 cm2 at the same location.
Perceptual Rating
Twelve naïve listeners (11 female, 1 male), all students at the University of Arizona, participated in the perceptual experiment. All listeners passed a hearing screening at 20 dB HL for the frequencies 0.5, 1, 2, and 4 kHz (American Speech-Language-Hearing Association, 1997). None were trained singers or had completed a graduate course in voice disorders. All study procedures were approved by the Institutional Review Board at the University of Arizona.
Four sets of 91 novel /a/ vowels were generated from 13 values of vocal process separation (range: 0 – 0.3 cm) and seven values of nodal point ratio (range: 0.2 – 0.8). The four conditions were: (a) bulging of 0.1 cm and neutral epilaryngeal, (b) bulging of 0.1 cm and constricted epilaryngeal area, (0.2 cm2), (c) bulging of 0.2 cm and neutral epilaryngeal area, and (d) bulging of 0.2 cm and constricted epilaryngeal area. The fundamental frequency (F0) for all vowels was 100 Hz and alveolar pressure was 8 cmH20. Each sample was compared to a standard reference /a/ generated using vocal process separation (ξ02) of 0.15 cm, nodal point ratio (Rzn) of 0.8, edge bulging (ξb) of 0.1 cm, and the neutral epilaryngeal area. Vowel samples were presented as paired comparisons, the reference and experimental vowels separated by a 0.4 second silent interval. Each pair was presented two times in separate trials, once with the reference as the first member of the pair and once with the reference the second member of the pair. Since each sample was paired twice with the reference, there were 182 comparisons per set. Each listener rated two of the four sets, counter-balanced across listeners. Sample presentation within a set was randomized. Listeners were provided with a short break between sets.
The rating task was presented in a sound-treated room using the Alvin graphical interface (Hillenbrand and Gayvert, 2005). Stimuli were presented through a speaker at a comfortable loudness level. The rating scale, based on that used by Tasko and Greilick (2010) for scaling speech clarity, was a visual analog scale in the form of a horizontal line bisected by vertical cursor. Participants were shown the following written instructions on the testing screen: “After each presentation, move the cursor (using a left click button on the mouse) in the direction of the breathier sample. The amount you move the cursor indicates the degree to which that sample was breathier. If the first sample was moderately breathier than the second, for example, you would place the cursor partway between the midpoint and the left end point. If the second sample was extremely breathy compared to the first, you would place the cursor close to (or at) the right endpoint of the line.” Instructions were also provided verbally in a similar manner, with the word “breathy” paired with the term “airy.” Listeners could replay the stimuli as many times as needed.
Prior to rating the experimental stimuli, listeners completed a practice set designed to orient them to the task and range of stimuli. The set was comprised of five samples of /a/ using the same vocal tract area function as the experimental stimuli. Compared to the reference, one was much breathier, one moderately breathier, one very similar, one moderately less breathy, and one much less breathy. As in the experimental task, each vowel was played once before the reference and once after the reference and the presentation order was randomized. Participants were given an opportunity to ask questions after the practice set.
Ratings were assigned negative values if they were to the left of center, and positive values if they were to the right. While the subjects did not see the numerical value being assigned, the maximum difference value was set at 500 and the difference was “0” if the cursor remained in the center (the samples sounded the same). An audio file containing three of the paired comparisons is available as supplemental online content associated with this article.
Signal Measurement
The CPP, H1*-H2*, and B0-B2 were automatically measured using custom-built MATLAB programs as the 91 vowels within any given set were simulated. CPP was measured using publicly- available software (Hillenbrand, 2008; Hillenbrand and Houde, 1996) executed from within a MATLAB script. For H1*-H2*, a peak-picking paradigm was used to measure the amplitude of the first two harmonics from a spectrum of the acoustic signal. Values were corrected for the amplitude of the first formant (F1) as described by Hanson (1997), and the corrected H2 (H2*) subtracted from corrected H1 (H1*). Because the vocal tract area function was available from the simulation, the F1 could be determined directly rather than relying on LPC-based analysis (cf. Samlan & Story, 2011). The H1*-H2* measurements were not pitch-synchronous; however, because the samples from which H1*-H2* were measured were simulated with exactly the same F0, the relation of the cycles to the spectral window was identical in every case. To assure that measurement technique did not affect results, H1*-H2* measurements were repeated using a pitch-synchronous method and the difference was only 0.05 dB. B0-B2 was obtained by calculating the mean RMS energy from two bands: B0 (59 – 398 Hz) and B2 (2003 – 5001 Hz). The mean intensity level (in dB) of B2 was then subtracted from that of B0. These bands are consistent with those selected by de Krom (1995) and Hartl et al. (2003). Higher bands could not be accurately calculated because the model itself is not valid beyond 5000 Hz. The HNR was separately calculated using Praat (Boersma and Weenink, 2011; Boersma, 1993).
Data Analysis
Intra-rater and inter-rater reliability were assessed using intraclass correlation (ICC). Stepwise linear regressions were completed to determine the relative importance of the model parameters and the acoustic measures in explaining the mean breathiness rating. Qualitative analysis was completed using MATLAB to generate a series of three-dimensional figures showing the relation among model parameters, acoustic measures, and mean ratings across listeners.
RESULTS
Reliability
The ICC for 10 of the 12 raters was between 0.764 and 0.938. Two listeners had lower ICC values; listener 1 and listener 9 had values of 0.668 and 0.513, respectively. The ICC and 95% confidence interval for each rater are presented in Table 1. Inter-rater reliability was also assessed with ICC. Across all raters, the ICC was .959 (95% confidence interval .952 – .965).
Table 1.
Intraclass correlation coefficient (ICC) for individual raters.
| Rater | ICC | 95% Confidence Interval |
|---|---|---|
| 1 | .668 | .555 – .752 |
| 2 | .764 | .684 – .824 |
| 3 | .828 | .770 – .872 |
| 4 | .803 | .736 – .853 |
| 5 | .853 | .803 – .890 |
| 6 | .830 | .772 – .873 |
| 7 | .856 | .808 – .893 |
| 8 | .892 | .855 – .919 |
| 9 | .513 | .348 – .637 |
| 10 | .901 | .868 – .926 |
| 11 | .938 | .917 – .954 |
| 12 | .847 | .795 – .886 |
Breathiness Ratings and Relation to Kinematic Model Parameter Variation
Vocal process separation contributed most to perceptual rating (adjusted r2 = 0.614) and three of the four model parameters assessed contributed significantly (p ≤ .01) to the final model where vocal process separation, bulging, and nodal point ratio together accounted for 88.7% of the variance in breathiness rating.
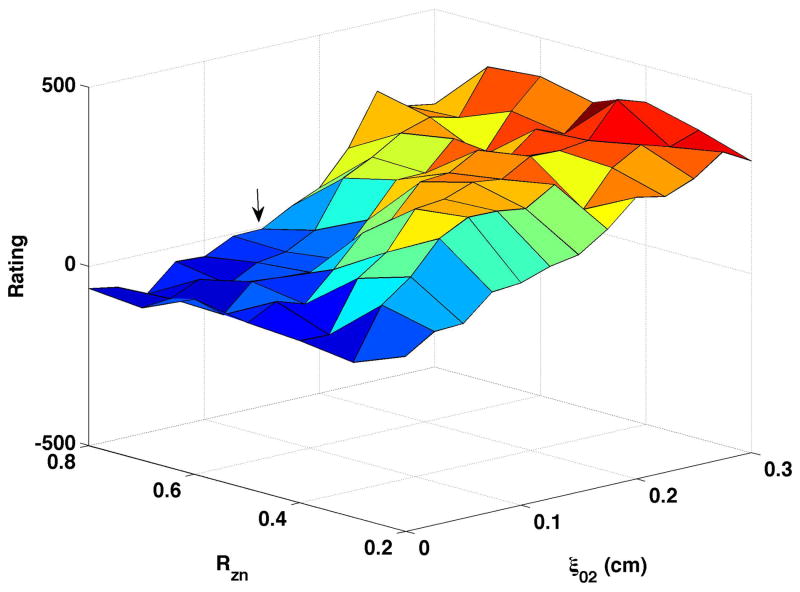
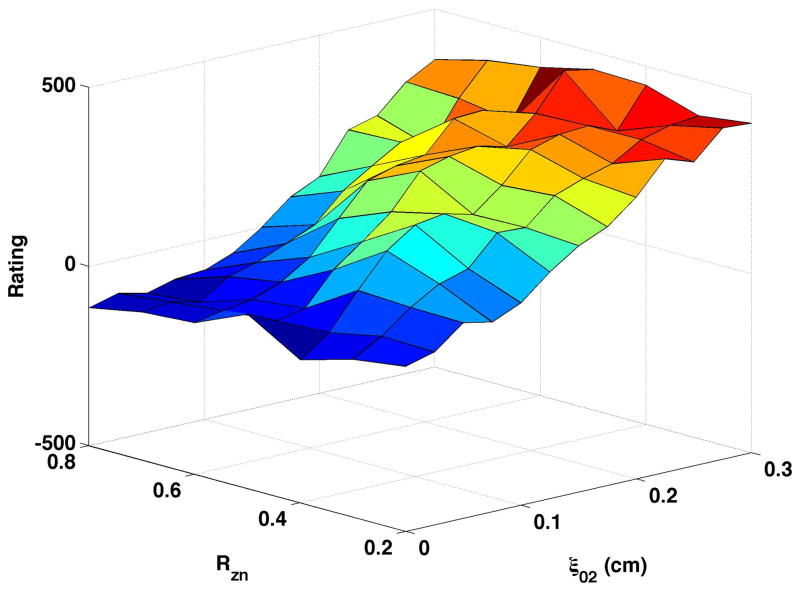
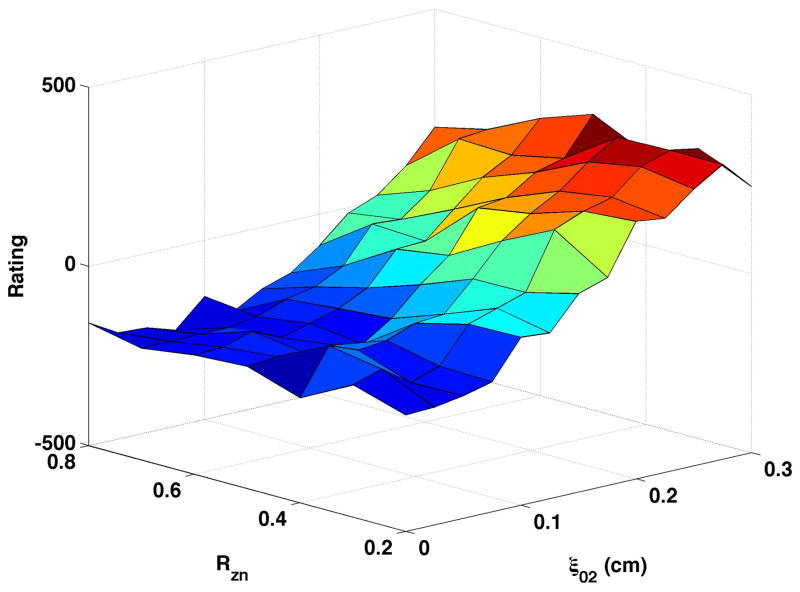
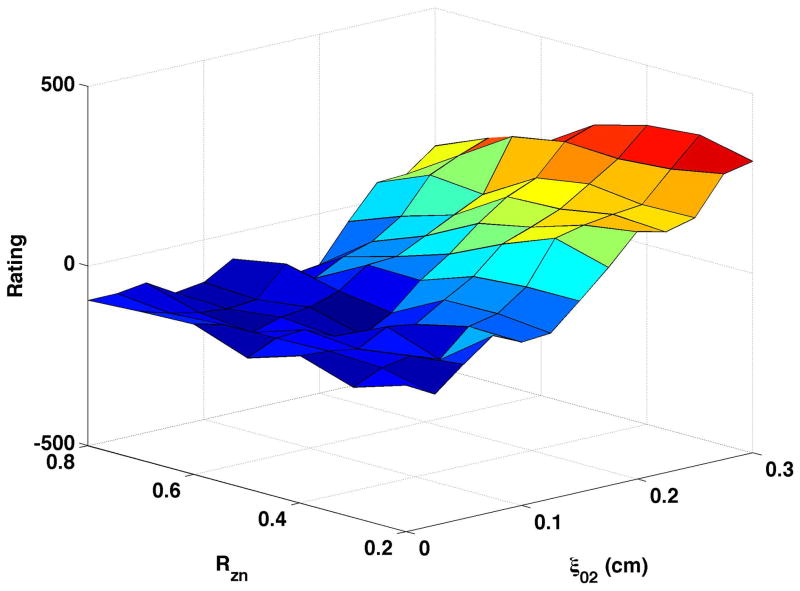
Breathiness ratings, based on 12 ratings by 6 listeners (only half of the listeners rated each production), were calculated for each production and mean ratings plotted as three-dimensional surfaces (Fig. 3). For each surface in Fig. 3, breathiness is presented on the z-axis, with a scale of −500 to +500. Negative values indicate that the sample was perceived as less breathy than the reference vowel (ξ02 = 0.15, ξb = 0.1, Rzn = 0.8, Aepi = neutral) and positive values indicate the sample was breathier than the reference. The nodal point ratio (Rzn) varies along the y-axis, and vocal process separation (ξ02) along the x-axis. Individual listeners used the full scale (−500 to +500) in each condition, though group means ranged from −154 to 391.
Figure 3. Perceptual Ratings.
In each panel, the x-axis displays 13 values of ξ02, the y-axis displays 7 values of Rzn, and the z-axis displays average perceptual rating of breathiness. (a) Bulging = 0.1 cm, neutral epilarynx, (b) Bulging = 0.1 cm, constricted epilarynx, (c) Bulging = 0.2 cm, neutral epilarynx, and (d) Bulging = 0.2 cm, constricted epilarynx. The arrow in Fig. 3a represents the reference sample.
Fig. 3a shows mean breathiness ratings of vowels generated with bulging of 0.1 and a neutral epilarynx. The reference sample is included in this surface and indicated by the arrow. In general, perceived breathiness increased with vocal process separation regardless of nodal point ratio. Breathiness was also influenced by nodal point ratio: mean rating across vocal process separation was lowest for nodal point ratio of 0.8 (mean rating = 51.6) and highest for nodal point ratio of 0.3 (215.8). There was a noticeable increase in perceived breathiness when both nodal point ratio and vocal process separation were mid-range.
Fig. 3b displays the breathiness ratings when the samples were generated with a constricted epilarynx. All samples were rated in comparison to the reference identified in Fig. 3a, so that the “0” value on the z-axis should represent a consistent degree of breathiness across figures. The range of the scale raters used and the shape of the surface across degree of vocal process separation and nodal point ratio were very similar to the neutral (Fig. 3a) condition.
Increasing the bulging value from 0.1 (Fig. 3a) to 0.2 cm (Fig. 3c) decreased the degree of breathiness listeners perceived. Breathiness still increased with increased vocal process separation yet average ratings were lower across the full range of productions generated. With bulging = 0.2 cm, perceived breathiness increased more steeply from high to low nodal point ratio than when bulging = 0.1 cm.
Constricting the epilarynx in the higher bulging setting (Fig. 3d) minimally altered the range of breathiness ratings. At vocal process separation values less than or equal to ξ02 = 0.15 cm, epilaryngeal constriction to 0.2 cm2 slightly increased the perceived breathiness. Increasing bulging while the epilaryngeal area was constricted (Fig. 3b to Fig. 3d) caused a larger decrease in perceived breathiness than when the epilarynx was neutral (Fig. 3a to Fig. 3c), particularly at moderate to large values of vocal process separation.
Acoustic Measures and Relation to Breathiness Ratings
The degree to which each measure contributed to the perception of breathiness was assessed using a stepwise linear regression. Two parameters contributed significantly (p ≤ .01) to the model; together, CPP and B0-B2 explained 91.8% of the variance in perceptual rating. Though HNR was not a significant contributor to the regression model, the variance inflation factor was 12.801, suggesting collinearity. The correlation between CPP and HNR was high, with r = .959.
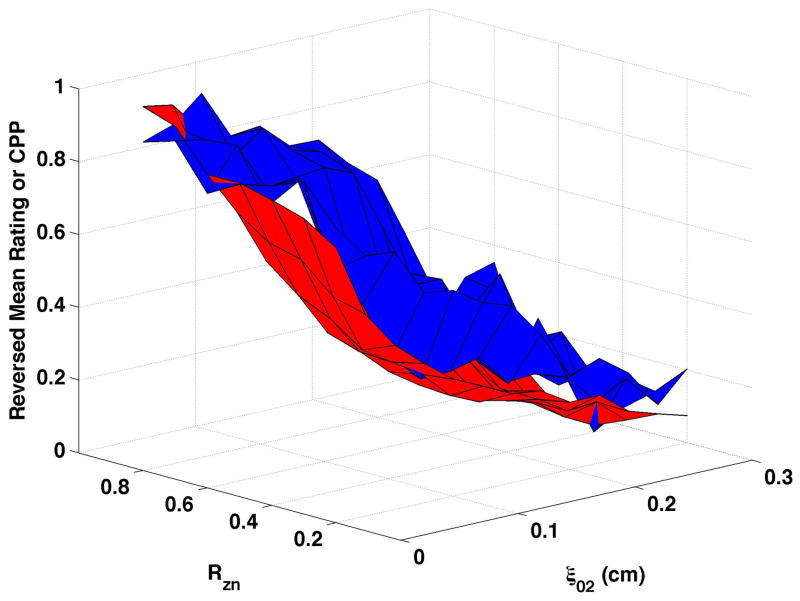
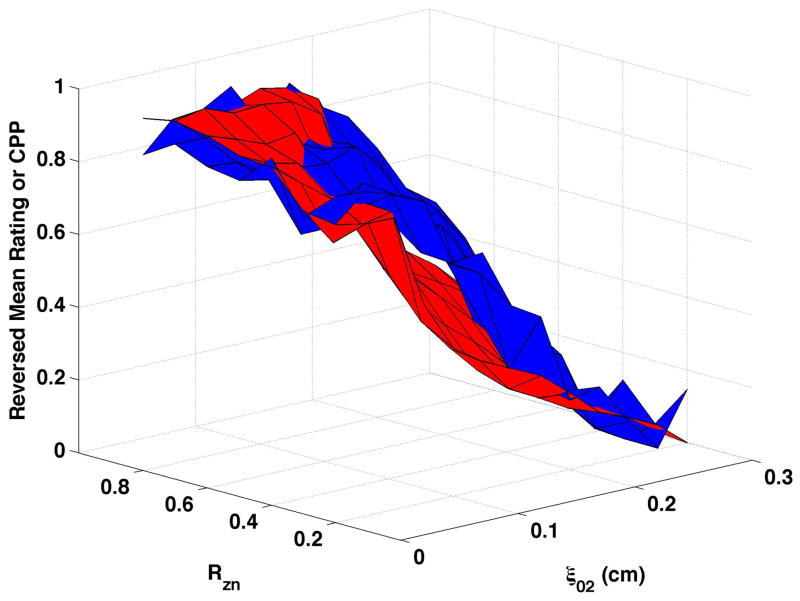
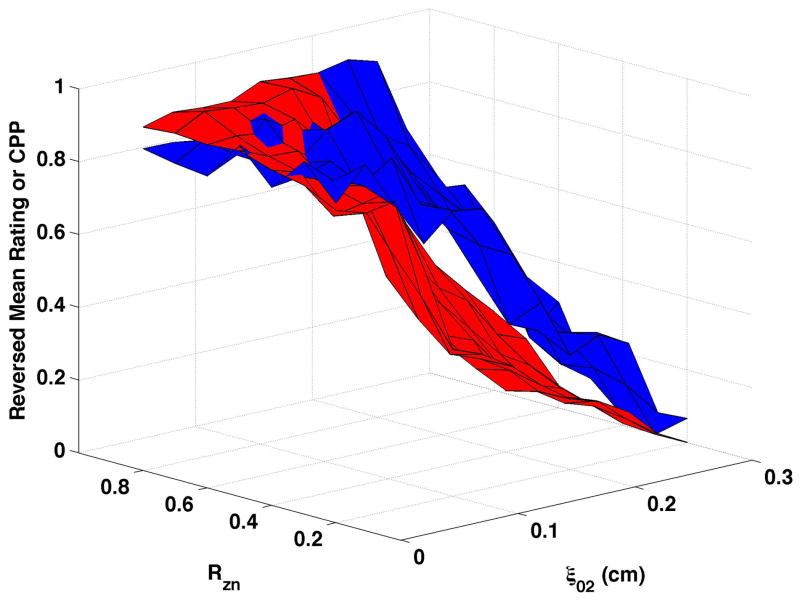
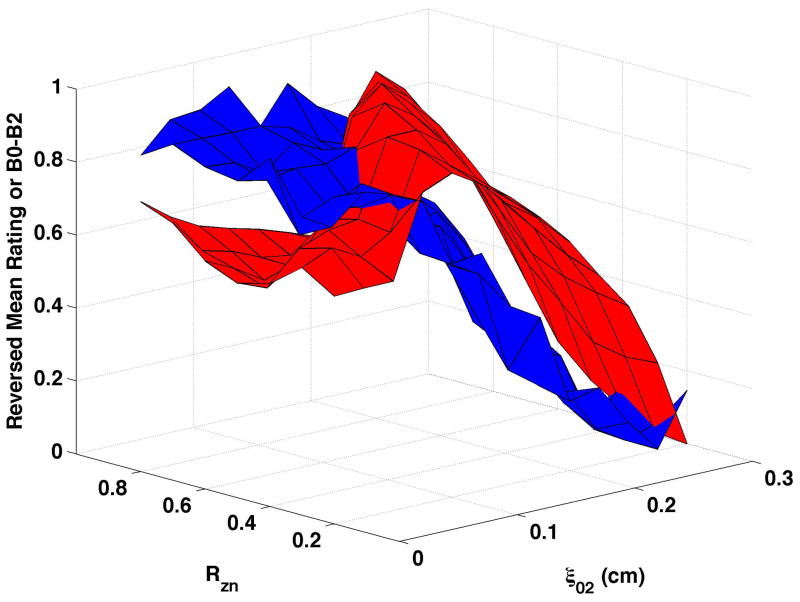
CPP is shown as the red surfaces in Fig. 4. The prominence of the cepstral peak decreased with increasing separation of the vocal processes (ξ02) and, to a smaller degree, with decreasing nodal point ratio (Rzn). The surfaces presented in the figure were normalized so that “0” was the minimum and “1” the maximum CPP for the condition in order to visually compare changes in CPP with changes in perceived quality. In real values, CPP varied by approximately 17 to 20 dB across each surface. Increasing bulging to 0.2 cm (Fig. 4c and Fig. 4d) led to higher CPP for comparable ξ02 and Rzn, and increasing epilaryngeal constriction (Fig. 4b) led to more subtle increase in CPP, primarily at low ξ02.
Figure 4. Comparisons of perceptual ratings and CPP.
Reversed normalized mean breathiness rating (blue) and normalized CPP (red) for all combinations of Rzn and ξ02.
Since higher cepstral peak is consistent with regular harmonic content, higher CPP should indicate lower values of the “breathy” percept. For visual comparison of breathiness ratings and CPP, mean ratings were multiplied by −1, reversing the scale, and the reversed ratings normalized to a scale of 0 to 1. The inversion has the effect of showing increasing breathiness as a decreasing value, consistent with expectations for CPP. The reversed normalized mean ratings are displayed in Fig. 4 in blue. Considerable co-variation and minimal differences were found across conditions. CPP generally decreased more rapidly and smoothly than the reversed mean ratings. Perceptual changes lagged behind CPP most consistently when bulging was 0.2 cm and the epilaryngeal area was constricted.
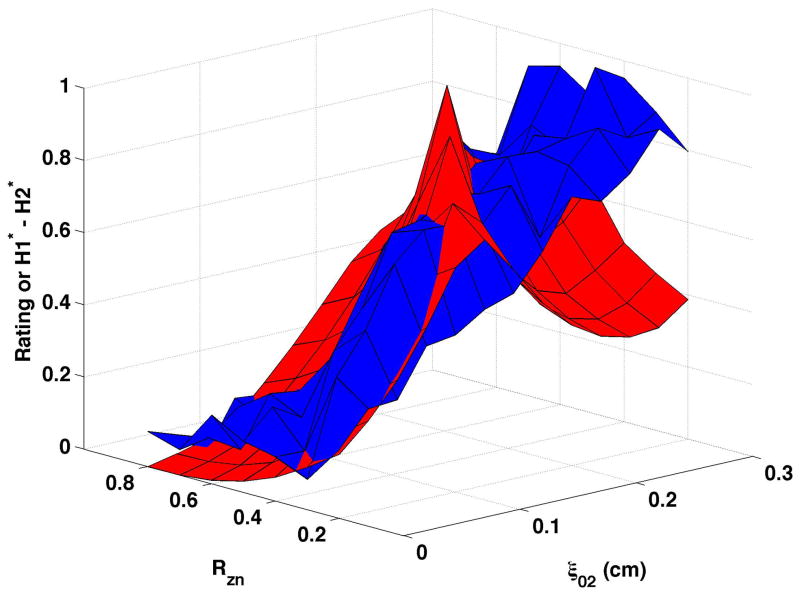
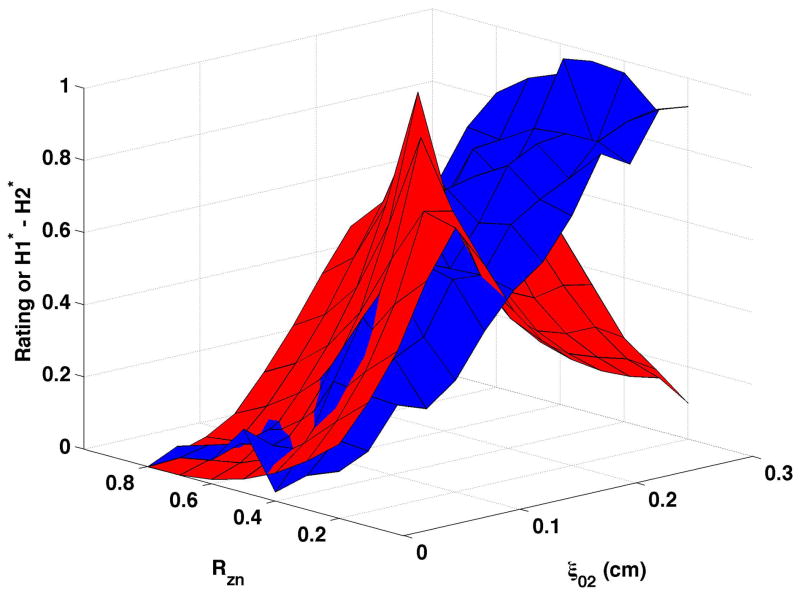
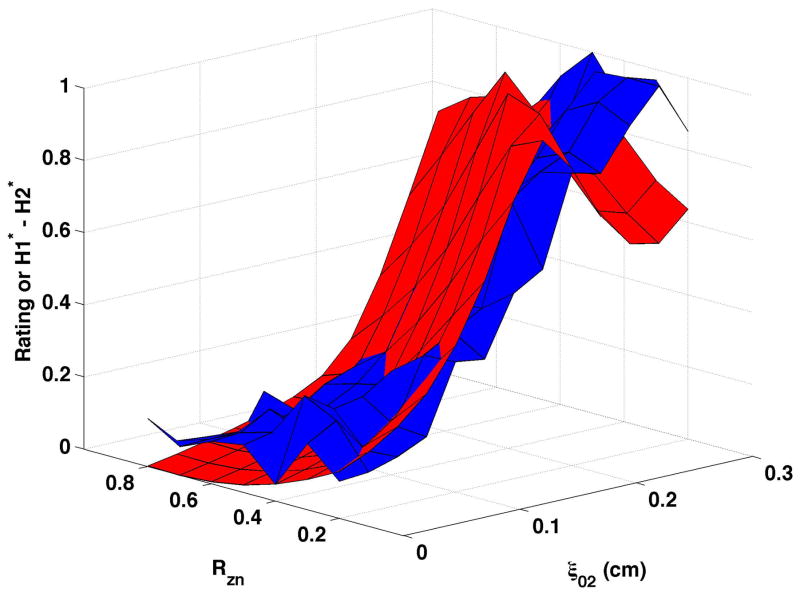
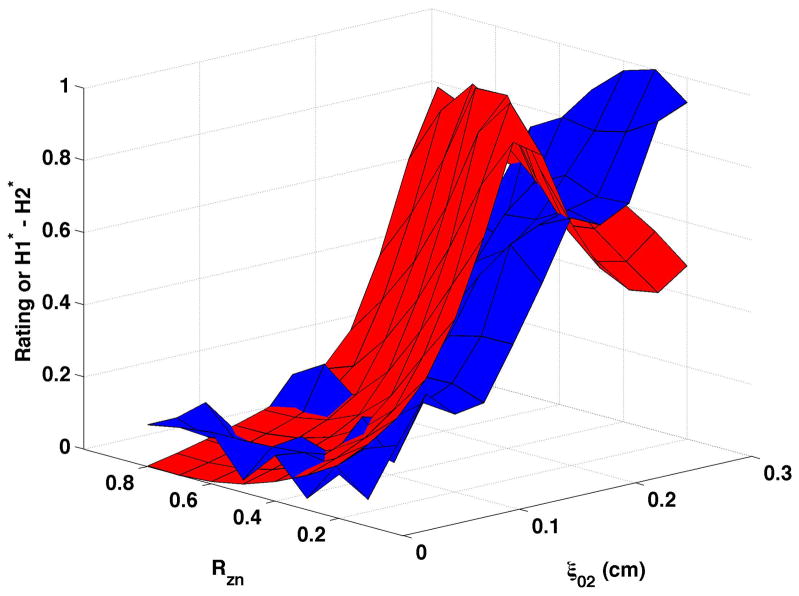
In contrast to CPP, H1*-H2* (shown normalized as the red surfaces in Fig. 5) demonstrated a more complex relation to the underlying model parameters. H1*-H2* did not rise steadily as vocal process separation increased, but increased for part of the surface and then decreased. Increasing bulging from 0.1 cm (Fig. 5a and Fig. 5b) to 0.2 cm (Fig. 5c and Fig. 5d) typically lowered H1*-H2* for small to moderate levels of vocal process separation. At moderate to large vocal process separation, increasing the bulging sometimes increased H1*-H2* and sometimes lowered H1*-H2*. Epilaryngeal constriction did not affect or slightly increased H1*-H2* at low ξ02 and decreased H1*- H2 at high ξ02. The mean breathiness ratings were normalized and are shown as the blue surfaces in Fig. 5. Ratings were not reversed for this figure because higher H1*-H2* was expected to reflect a higher degree of breathiness. While the surfaces overlapped for many sections of the figures, H1*-H2* diverged from perception in each panel, so that perceived breathiness continued to increase while H1*-H2* decreased. The divergence occurred at ξ02 of 0.125 cm to 0.25 cm, depending on the nodal point ratio, bulging, and epilaryngeal area.
Figure 5. Comparisons of perceptual ratings and H1*-H2*.
Normalized mean breathiness rating (blue) and normalized H1*-H2* (red) for all combinations of Rzn and ξ02.
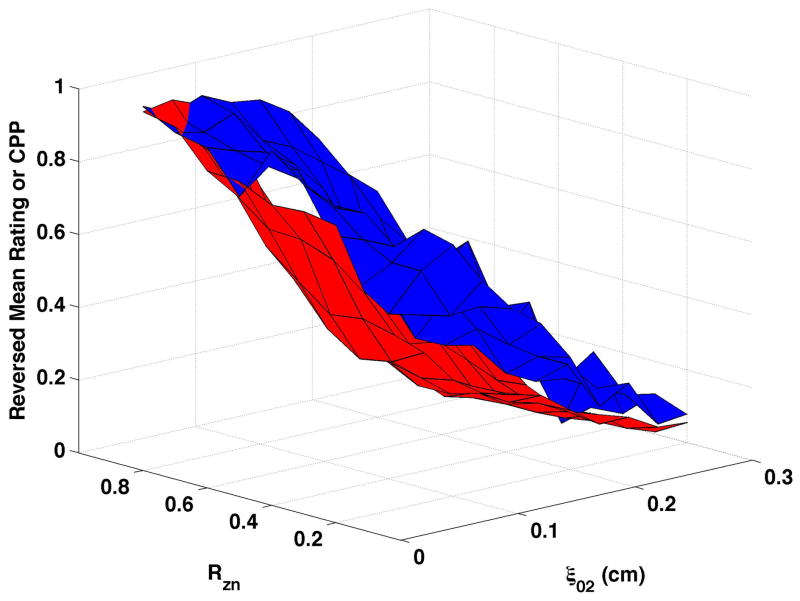
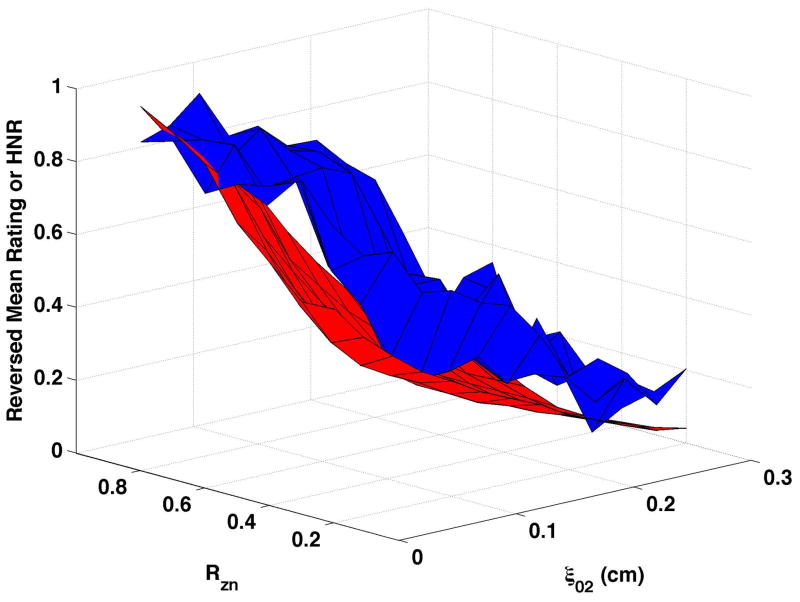
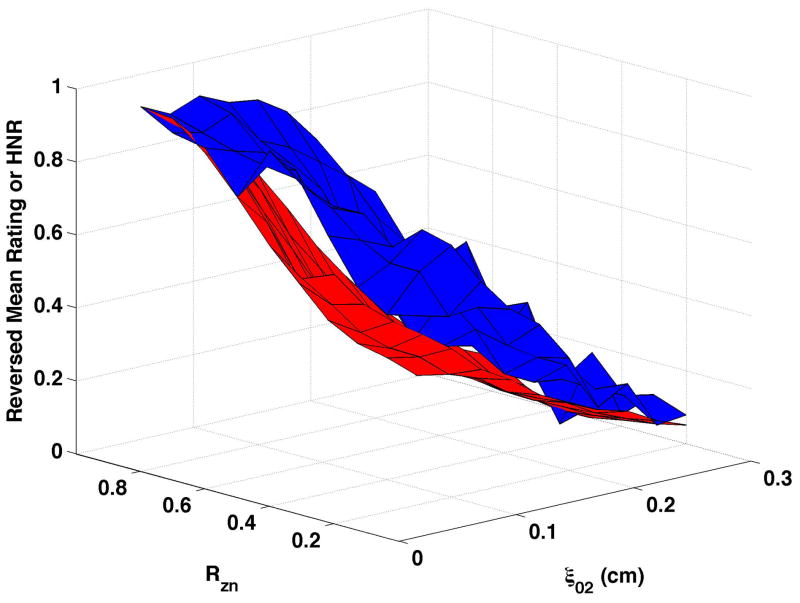
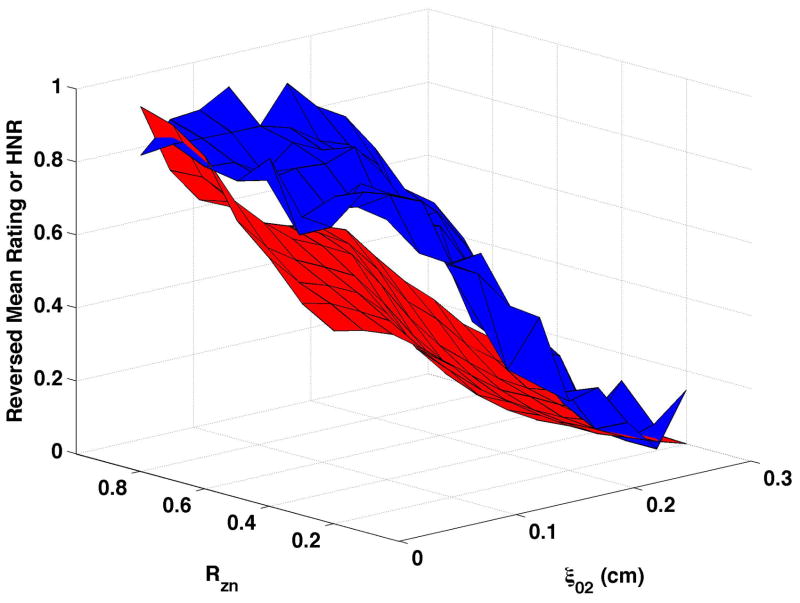
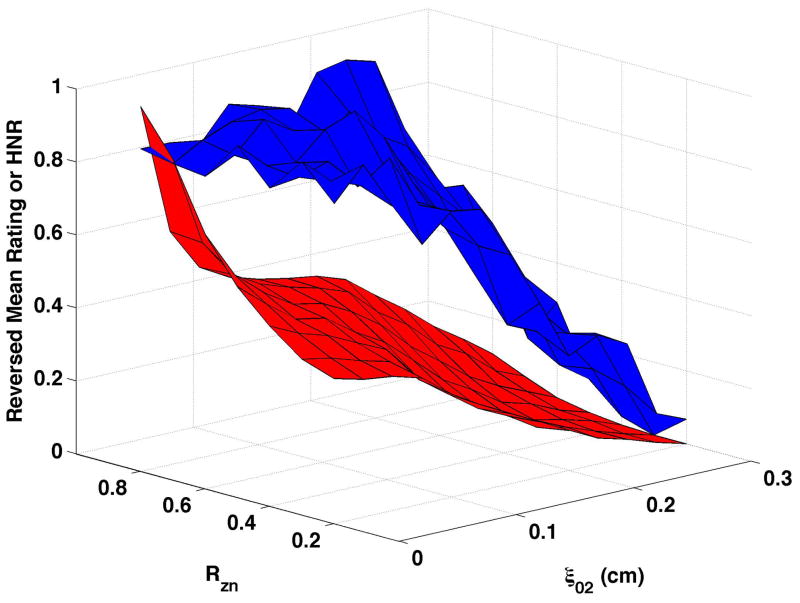
HNR (shown normalized as the red surfaces in Fig. 6) decreased as vocal process separation (ξ02) increased and, to a lesser degree, as nodal point ratio (Rzn) decreased. These changes can be seen in Fig. 6a as follows: HNR decreased by 38.3 dB from upper left portion of the surface (ξ02 = 0, Rzn = 0.8) to the upper right (ξ02 = 0.3, Rzn = 0.8), and by 17.2 dB from the upper left to the lower left (ξ02 = 0, Rzn = 0.2). Increasing bulging to 0.2 cm (Fig. 6c and Fig 6d) consistently increased HNR, and epilaryngeal constriction (Fig. 6b and Fig. 6d) caused HNR to increase when ξ02 was low. The reversed normalized mean ratings are plotted in Fig. 6 as the blue surfaces. These results were similar to CPP, with the closest matches occurring when bulging was 0.1 cm and the epilaryngeal area was neutral. The largest mismatches occurred when bulging was 0.2 cm and the epilaryngeal area was constricted (Fig. 6d).
Figure 6. Comparisons of perceptual ratings and HNR.
Reversed normalized mean breathiness rating (blue) and normalized HNR (red) for all combinations of Rzn and ξ02.
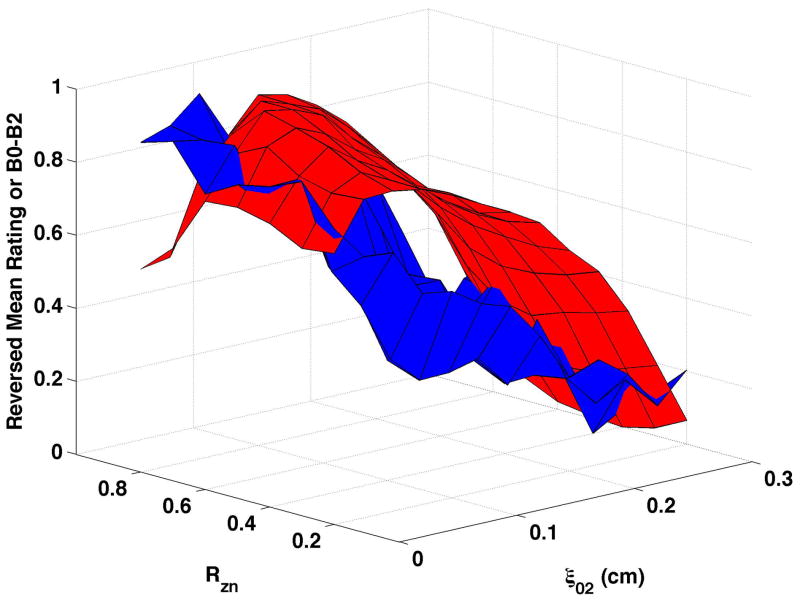
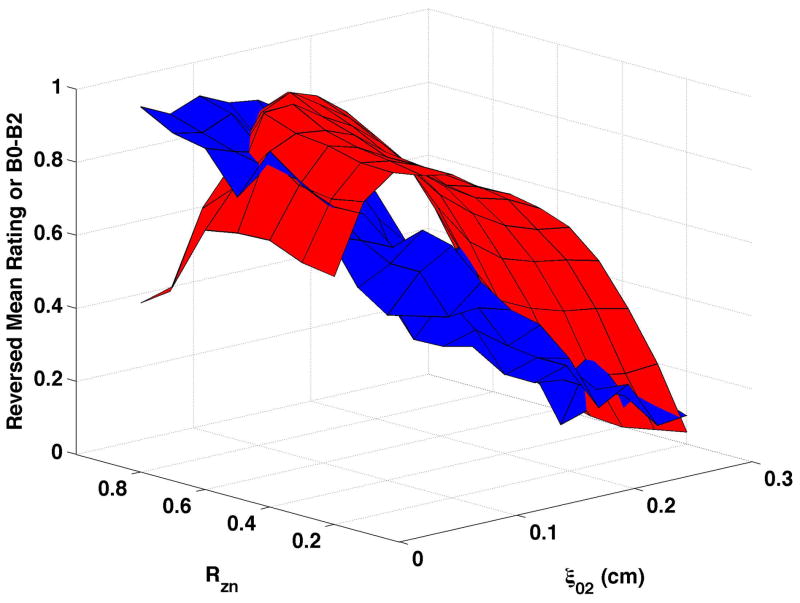
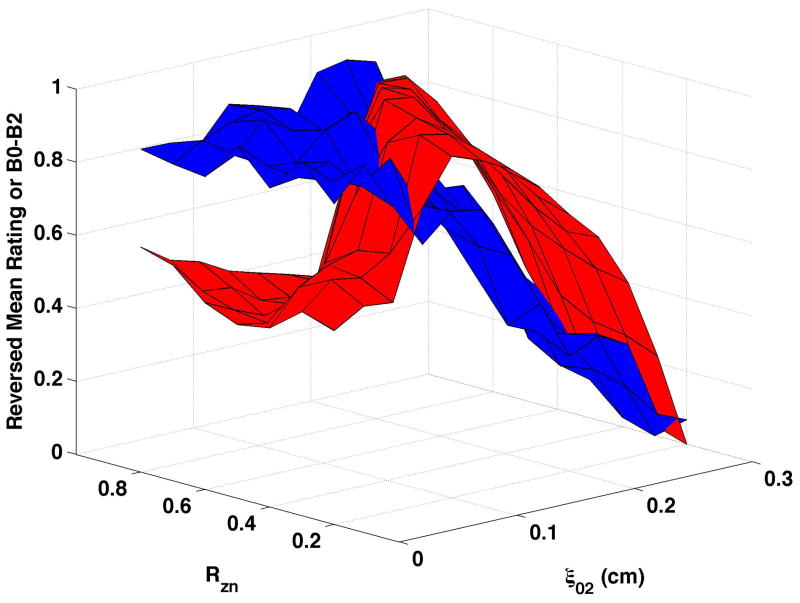
B0-B2 varied primarily as a function of vocal process separation when bulging was 0.1 cm and the epilarynx was neutral (Fig. 7a), though some influence of nodal point ratio was evident. B0-B2 increased until ξ02 ≥ 0.05 cm, then decreased with further vocal process separation. The ξ02 range over which B0-B2 increased varied with nodal point ratio. Constricting the epilarynx while maintaining bulging at 0.1 cm (Fig. 7b) or 0.2 cm (Fig. 7d) did not alter the shape of the surface, and B0-B2 of the descending portion was generally higher with the constricted epilarynx, except at the highest ξ02 values. Increasing bulging to 0.2 cm (Fig. 7c) led to a slight shape change with B0-B2 decreasing until ξ02 = 0.025 to 0.125 followed by the previous pattern of increasing and then decreasing with continued ξ02 increase. B0-B2 during the descending portion of the surface was typically higher at bulging of 0.2 cm.
Figure 7. Comparisons of perceptual ratings and B0-B2.
Reversed normalized mean breathiness rating (blue) and normalized B0-B2 (red) for all combinations of Rzn and ξ02.
Reversed normalized mean breathiness ratings are plotted as the blue surfaces in Fig. 7. In this set of figures, B0-B2 was inversely related to breathiness when breathiness was minimal and directly related to breathiness when breathiness was more substantial.
DISCUSSION
The use of the kinematic speech production model in this study allowed direct comparison of incremental modulation of the glottal airspace, measures of the acoustic output signal, and perceived breathy voice quality. In general, breathiness increased with larger vocal process separation and lower nodal point ratio, and decreased with higher bulging. Listener perception was well aligned with CPP and HNR across vocal process separation, H1*-H2* before a threshold of vocal process separation, and B0-B2 after a threshold of vocal process separation.
Perceptual Ratings
The mean ratings were considered reliable with an all-rater ICC of .959 and reference vowel rating of −4.67, close to the expected score of 0 on a scale of −500 to +500. As a group, listeners used more of the scale in the positive direction than the negative direction, indicating they perceived a larger range of breathiness for vowels breathier than the reference than they did for vowels less breathy than the reference. This might be an indication that the physical center of the continuum of vocal process separation (ξ02 = 0.15 cm) was not the perceptual center of breathiness for the vowels presented. The boundary for when samples sounded breathy was not tested in this experiment, but it is possible that the voices did not begin to sound breathy until close to the reference value for vocal process separation. Prior to that “breathy” threshold, voices might be considered normal, or even “pressed,” and pressed might be a different percept altogether, rather than part of the breathiness continuum.
Laryngeal Anatomy and Kinematics and Breathy Voice Quality (Hypotheses 1–4)
Hypothesis 1, Vocal process separation
As expected, increasing vocal process separation during simulated vocal fold vibration increased the average degree of breathiness listeners perceived; vocal process separation alone accounted for 61.4% of the variance in mean rating. This pattern was maintained across nodal point ratio, bulging, and epilaryngeal setting, though the degree of breathiness was moderated by the other parameters. Results are consistent with findings by many others that incomplete glottal closure leads to breathiness (e.g., Fritzell et al., 1986; Holmberg, Hillman, & Perkell, 1988; Klatt & Klatt, 1990; Hertegård & Gauffin, 1995). The findings are novel in that they were generated using a kinematic model so that degree of vocal process separation was controlled across a large range of equally spaced distances (from 0 to 0.6 cm). Interpreting results from studies with human subjects can be difficult since the closure pattern that occurs with vocal process separation is often part of a constellation of differences in mass, shape, and stiffness that interact with the closure deficit to produce a more complex range of voice qualities. A benefit of this particular model was the opportunity to vary one feature at a time, teasing apart the impact of incomplete glottal closure from altered subglottal pressure, amplitude of vibration, mucosal wave, symmetry, and regularity. It is likely that the ambiguous relationship between gap size and breathiness in human subjects (e.g., Rammage et al., 1992) occurs because gap size is not the only feature differing among study participants.
Hypothesis 2, Nodal point ratio
As expected, nodal point ratio influenced breathiness ratings, with the lowest rating for a particular value of vocal process separation typically occurring at nodal point ratio of 0.7 or 0.8 and the highest breathiness ratings at nodal point ratio of 0.3 or 0.4.
Vertical movement of the nodal point along the edge of the fold, as was done in the current study, has the effect of redistributing the cover mass, so that a high nodal point means greater vibratory mass and amplitude of vibration in the bottom portion of the folds, and low nodal point indicates larger vibratory amplitude of the top portion (Titze & Story, 2002). The “typical” location of the nodal point ratio in different phonation conditions is not known, though a tentative recommendation of setting the nodal point at one-third from the top of the fold in modal register and one-third from the bottom in falsetto register has been proposed for a body-cover model (Titze & Story, 2002). In a series of studies imaging the inferior surface of canine and human vocal folds during vibration, Yumoto and colleagues (1993; 1995; 1996) identified a ridge of mucosal upheaval on the inferior surface of the fold, between the anterior commissure and the vocal process, which has small vibratory amplitude and appears to be the origin of the mucosal wave. The location of the mucosal upheaval was further shown to shift in varying muscle activation, vocal fold length, and flow rate conditions. Further study using excised human and computational models is indicated given the findings in the current study that lowering the nodal point ratio increased the degree of breathiness perceived in sustained vowels at modal pitch.
Hypothesis 3, Bulging
As expected, increasing the convex curvature of the vocal fold edge provided some degree of compensation for vocal process separation, decreasing breathiness across most of the range of other parameters manipulated. These findings lend support to decreased breathiness with vocal fold medialization techniques (i.e., thyroplasty or injection) that slightly increase the convexity of the fold edge, with or without medializing the vocal process. Results are consistent with expectations based on modeling studies by Alipour and Scherer (2000) showing increased bulging offset increased ξ02, and clinical studies describing decreased breathiness following surgical medialization (Lundy et al., 2003; Billante et al., 2002; Milstein et al., 2005). Further study is needed to determine whether the vertical placement of the implant alters vibratory nodal point and whether a higher or lower vertical location would better improve voice quality. Notably, breathiness decreased more with increased bulging when the epilarynx was constricted than in the neutral setting.
Hypothesis 4, Epilaryngeal area
Contrary to expectations, decreasing the epilaryngeal area did not consistently decrease breathiness rating. Breathiness was not affected by epilaryngeal area when bulging was 0.1 cm and increased slightly when bulging was 0.2 cm and ξ02 ≥ 0.15 cm. Though the increased breathiness ratings were unexpected, the discrepancy is small and occurred for vowels with minimal vocal process separation and low nodal point ratio. Spectral analysis of waveforms associated with these vowels did not show characteristics indicative of increased breathiness; rather, amplitudes of various harmonics were shifted slightly due to the minor changes in the vocal tract resonance frequencies generated by epilaryngeal constriction. These changes are consistent with a “quality” change but not necessarily an increase in “breathiness.”
Regardless of whether that slight increase in breathiness rating is meaningful, the expectation that epilaryngeal constriction would decrease breathiness was not fulfilled. It is possible that the perceivable effects of constriction are caused primarily by the second level of interaction and, while the model used for this study allows for source – tract interaction to influence glottal flow, it does not provide a mechanism for the tract to influence vocal fold vibration itself. Additionally, the vocal tract used in the model already provides a resonant production of the /a/ vowel with epilaryngeal area of 0.36 cm2, and it might be that further constriction to an area of 0.2 cm2 at a point 1.2 cm from the glottis was not enough of a difference to decrease breathiness in the range of vowels tested. Further studies with multiple epilaryngeal configurations and bulging values would be needed to fully interpret the current results.
Acoustic Measures and Breathy Voice Quality (Hypotheses 5–8)
Hypothesis 5, Cepstral peak prominence
As expected, CPP was inversely related to breathiness in the current study (r = −0.921) (Fig. 4). The strong relation of breathiness ratings to CPP was expected because of the nature of the measure; regular harmonic content produces high CPP and breathy vowels are often characterized acoustically by noise energy replacing harmonic content above 2–3 kHz (Klatt & Klatt, 1990; Hillenbrand, Cleveland, & Erickson, 1994). At small separations of the vocal processes, CPP decreased more rapidly than average perceived breathiness increased. CPP decreased in response to increasing separation of the vocal processes and decreasing nodal point ratio, and it increased with edge bulging. The systematic variation in CPP that occurred with several underlying anatomic and vibratory properties that caused breathiness is reason to exercise caution when trying to determine the particular kinematic etiology of a change in CPP.
Hypothesis 6, H1*-H2*
As expected, the relation of H1*-H2* to perceived breathiness was nonlinear (Fig. 5). These findings are not surprising given the inconsistent reports of H1*-H2*co-varying with breathiness (Iseli, Shue, & Alwan, 2007; Chen et al., 2007; Holmberg et al., 2003; Hartl et al., 2001; Hanson, 1997; Hillenbrand, Cleveland, & Erickson, 1994; Klatt & Klatt, 1990). The finding that H1*-H2* was lower in the breathiest conditions than in moderately breathy conditions can likely be explained based on previous findings that particular parameter combinations result in an open quotient that suppresses the second harmonic to varying degrees (cf. SS11).
Hypothesis 7, HNR
As hypothesized, HNR decreased as breathiness increased (r = −0.884). In other studies, HNR within spectral bands B1 and B2 (400–2000 Hz and 2000–5000 Hz) accounted for approximately 40–50% of the variability in breathiness ratings (de Krom, 1995) and overall noise-to-harmonics ratio (NHR) for 30% of the variance in breathiness ratings (Heman-Ackah, Michael, & Goding, 2002). In the current study, HNR was not a significant contributor to the linear regression model explaining mean breathiness rating. This is likely because of its strong correlation with CPP, consistent with Murphy’s (2006) finding that the prominence of the first cepstral peak was directly proportional to a geometric mean HNR.
Hypothesis 8, B0-B2
It was hypothesized that B0-B2 would decrease with increased breathiness. The hypothesis was supported for moderate-severe breathiness but not mild-moderate breathiness, though B0-B2 was one of the two significant measures explaining mean breathiness. In order to better understand the relative contributions of harmonic and noise energy in the two bands, spectra from different vocal fold adduction values were further analyzed and are available as online supplemental material. The increasing B0-B2 at low vocal process separation appears related primarily to decreased harmonic energy in B2, and the decreasing B0-B2 at higher vocal process separation related to decreased low frequency harmonic energy in B0 and increased noise energy in B2.
CLINICAL IMPLICATIONS AND CONCLUSIONS
The findings of this study support recognition that aspects of vocal fold structure and vibration other than vocal process separation influence perceived breathiness. In the current study, vocal fold edge contour and nodal point moderated the degree of breathiness. Increased bulging can be accomplished through muscle contraction or surgical intervention, and the additional influence of nodal point indicates that vertical location of the bulge along the vocal fold thickness might contribute to intervention outcomes. Further research is necessary to identify determinants of nodal point ratio in humans and how nodal point ratio and bulging interact to alter voice quality.
The current study offers very little support for decreasing breathiness through increasing epilaryngeal constriction, though the constriction generally resulted in slightly higher HNR, higher CPP at low ξ02, and higher B0-B2 at mid to high ξ02. It was anticipated that a decreased epilaryngeal area would increase supraglottal inertance, a property common to many voice therapies such as lip or tongue vibration, resonant voice techniques, twang, vocal function exercises, and others (Titze, 2006b). The results of the current study should be interpreted cautiously given the limitations of the model and the few conditions tested. It should also be noted that there appears to be an interaction between bulging and epilaryngeal area that requires further exploration; it is possible that a combination of medialization and epilaryngeal constriction could decrease breathiness more than medialization alone.
Selecting acoustic measures that are perceptually meaningful and might provide information about production can be challenging, especially given the large number of measures calculated using commercially-available systems. HNR and CPP appeared strongly related to one another and were linearly related to mean breathiness rating across the range assessed. Either one would appear to be a useful component of a clinical acoustic analysis battery and both are available in no-cost and commercially available software. Neither H1*-H2* nor B0-B2 was linearly related to the underlying model parameters or perceived breathiness. Both measures capture part of the spectral slope of the acoustic signal and there was a portion of the vocal process separation range for each where each measure demonstrated a predictable relation to breathiness. It might be the case that H1*-H2* is a useful measure for quantifying breathy quality changes at low to moderate levels of breathiness, where decreased energy in the fundamental component is the primary spectral change, and B0-B2 is useful at higher levels of breathiness, where increased noise in the B2 region is more perceptually important. Regardless, it is important to recognize that low H1*-H2* and B0-B2 can occur when perceived voice quality is mildly or severely impaired.
The results also serve as reminder that the same level of perceived breathiness or same value measured from an acoustic signal can result from more than one laryngeal feature (e.g., vocal process separation, nodal point ratio, edge shape). While all parameter modifications in the current study were applied to both vocal folds, continued study of symmetric and asymmetric systems will further knowledge regarding the interaction of vocal fold structure, vibration, and vocal tract modification with acoustic measures and perceived quality.
Supplementary Material
Acknowledgments
We would like to acknowledge Mark Borgstrom’s contributions to the statistical analysis. Parts of this research were supported by NIH Grants R01-DC04789 and F31-DC011201.
References
- Alipour F, Scherer RC. Vocal fold bulging effects on phonation using a biophysical computer model. J Voice. 2000;14(4):470–483. doi: 10.1016/s0892-1997(00)80004-1. [DOI] [PubMed] [Google Scholar]
- American Speech-Language-Hearing Association. Guidelines for Audiologic Screening [Guidelines] 1997 doi: 10.1044/policy.GL1997-00199. Available from www.asha.org/policy. [DOI]
- Awan SN, Roy N, Dromey C. Estimating dysphonia severity in continuous speech: application of a multi-parameter spectral/cepstral model. Clin Linguist Phon. 2009;23(11):825–841. doi: 10.3109/02699200903242988. [pii] [DOI] [PubMed] [Google Scholar]
- Billante CR, Clary J, Sullivan C, Netterville JL. Voice outcome following thyroplasty in patients with longstanding vocal fold immobility. Auris Nasus Larynx. 2002;29(4):341–345. doi: 10.1016/s0385-8146(02)00020-2. S0385814602000202 [pii] [DOI] [PubMed] [Google Scholar]
- Boersma P. Accurate short-term analysis of the fundamental frequency and the harmonics-to-noise ratio of a sampled sound. Institute of phonetic sciences, proceedings. 1993;17:97–110. [Google Scholar]
- Boersma P, Weenink D. Praat: doing phonetics by computer [Computer program]. Version 5.2.40. 2011 retrieved 11 September 2011 from http://www.praat.org/
- Bogert BP, Healy MJR, Tukey JW. The quefrency analysis of time series for echoes: Cepstrum, pseudo-autocovariance, cross cepstrum, and saphe cracking. In: Rosenblatt M, editor. Time series analysis, proc symp. Brown University; Wiley; 1963. pp. 209–243. 1962. [Google Scholar]
- Cantarella G, Viglione S, Stella Forti B, Pignataro L. Voice therapy for laryngeal hemiplegia: the role of timing of initiation of therapy. J Rehabil Med. 2010;42(5):442–446. doi: 10.2340/16501977-0540. [DOI] [PubMed] [Google Scholar]
- Chen SH, Hsiao T, Hsiao L, Chung Y, Chiang S. Outcome of resonant voice therapy for female teachers with voice disorders: perceptual, physiological, acoustic, aerodynamic, and functional measurements. J Voice. 2007;21(4):415–425. doi: 10.1016/j.jvoice.2006.02.001. [DOI] [PubMed] [Google Scholar]
- Childers DG, Lee CK. Vocal quality factors: analysis, synthesis, and perception. J Acoust Soc Am. 1991;90(5):2394–2410. doi: 10.1121/1.402044. [DOI] [PubMed] [Google Scholar]
- Colton RH, Paseman A, Kelley RT, Stepp D, Casper JK. Spectral moment analysis of unilateral vocal fold paralysis. J Voice. 2011;25(3):330–336. doi: 10.1016/j.jvoice.2010.03.006. S0892-1997(10)00046-9 [pii] [DOI] [PubMed] [Google Scholar]
- de Krom G. Some spectral correlates of pathological breathy and rough voice quality for different types of vowel fragments. J Speech Hear Res. 1995;38(4):794–811. doi: 10.1044/jshr.3804.794. [DOI] [PubMed] [Google Scholar]
- Döllinger M, Berry DA, Montequin DW. The influence of epilarynx area on vocal fold dynamics. Otolaryngol Head Neck Surg. 2006;135(5):724–729. doi: 10.1016/j.otohns.2006.04.007. [DOI] [PubMed] [Google Scholar]
- Esposito CM. The effects of linguistic experience on the perception of phonation. J Phonetics. 2010;38:306–316. doi: 10.1016/j.wocn.2010.02.002. [DOI] [Google Scholar]
- Fant G. The Acoustic Theory of Speech Production. The Hague: Mouton; 1960. [Google Scholar]
- Fischer-Jorgensen E. Phonetic analysis of breathy (murmured) vowels in Gujarati. Indian Linguistics. 1967;28:71–139. [Google Scholar]
- Flanagan JL, Cherry L. Excitation of vocal-tract synthesizers. J Acoust Soc Am. 1969;45(3):764–769. doi: 10.1121/1.1911461. [DOI] [PubMed] [Google Scholar]
- Fritzell B, Hammarberg B, Jan G, Karlsson I, Sundberg J. Breathiness and insufficient vocal fold closure. Journal of Phonetics. 1986;14:549–553. [Google Scholar]
- Fukazawa T, el-Assuooty A, Honjo I. A new index for evaluation of the turbulent noise in pathological voice. J Acoust Soc Am. 1988;83(3):1189–1193. doi: 10.1121/1.396012. [DOI] [PubMed] [Google Scholar]
- Hanson HM. Glottal characteristics of female speakers: acoustic correlates. J Acoust Soc Am. 1997;101(1):466–481. doi: 10.1121/1.417991. [DOI] [PubMed] [Google Scholar]
- Hanson HM, Chuang ES. Glottal characteristics of male speakers: acoustic correlates and comparison with female data. J Acoust Soc Am. 1999;106(2):1064–1077. doi: 10.1121/1.427116. [DOI] [PubMed] [Google Scholar]
- Hartl DM, Hans S, Vaissière J, Brasnu DF. Objective acoustic and aerodynamic measures of breathiness in paralytic dysphonia. Eur Arch Otorhinolaryngol. 2003;260(4):175–182. doi: 10.1007/s00405-002-0542-2. [DOI] [PubMed] [Google Scholar]
- Hartl DM, Hans S, Vaissière J, Riquet M, Brasnu DF. Objective voice quality analysis before and after onset of unilateral vocal fold paralysis. J Voice. 2001;15(3):351–361. doi: 10.1016/S0892-1997(01)00037-6. [DOI] [PubMed] [Google Scholar]
- Heman-Ackah YD, Heuer RJ, Michael DD, Ostrowski R, Horman M, Baroody MM, Hillenbrand J, Sataloff RT. Cepstral peak prominence: a more reliable measure of dysphonia. Ann Otol Rhinol Laryngol. 2003;112(4):324–333. doi: 10.1177/000348940311200406. [DOI] [PubMed] [Google Scholar]
- Heman-Ackah YD, Michael DD, Goding GS. The relationship between cepstral peak prominence and selected parameters of dysphonia. J Voice. 2002;16(1):20–27. doi: 10.1016/s0892-1997(02)00067-x. [DOI] [PubMed] [Google Scholar]
- Hertegård S, Gauffin J. Glottal area and vibratory patterns studied with simultaneous stroboscopy, flow glottography, and electroglottography. J Speech Hear Res. 1995;38(1):85–100. doi: 10.1044/jshr.3801.85. [DOI] [PubMed] [Google Scholar]
- Hillenbrand J. SpeechTool with CPP scripts [computer program] 2008 Downloaded on 8/25/08 from http://homepages.wmich.edu/~hillenbr/
- Hillenbrand J. Perception of aperiodicities in synthetically generated voices. J Acoust Soc Am. 1988;83(6):2361–2371. doi: 10.1121/1.396367. [DOI] [PubMed] [Google Scholar]
- Hillenbrand J, Cleveland RA, Erickson RL. Acoustic correlates of breathy vocal quality. J Speech Hear Res. 1994;37(4):769–778. doi: 10.1044/jshr.3704.769. [DOI] [PubMed] [Google Scholar]
- Hillenbrand J, Gayvert RT. Open source software for experiment design and control. J Speech Lang Hear Res. 2005;48(1):45–60. doi: 10.1044/1092-4388(2005/005). [DOI] [PubMed] [Google Scholar]
- Hillenbrand J, Houde RA. Acoustic correlates of breathy vocal quality: dysphonic voices and continuous speech. J Speech Hear Res. 1996;39(2):311–321. doi: 10.1044/jshr.3902.311. [DOI] [PubMed] [Google Scholar]
- Hoffman MR, Witt RE, Chapin WJ, McCulloch TM, Jiang JJ. Multiparameter comparison of injection laryngoplasty, medialization laryngoplasty, and arytenoid adduction in an excised larynx model. Laryngoscope. 2010;120(4):769–776. doi: 10.1002/lary.20830. [DOI] [PMC free article] [PubMed] [Google Scholar]
- Holmberg EB, Doyle P, Perkell JS, Hammarberg B, Hillman RE. Aerodynamic and acoustic voice measurements of patients with vocal nodules: variation in baseline and changes across voice therapy. J Voice. 2003;17(3):269–282. doi: 10.1067/s0892-1997(03)00076-6. [DOI] [PubMed] [Google Scholar]
- Holmberg EB, Hillman RE, Perkell JS. Glottal airflow and transglottal air pressure measurements for male and female speakers in soft, normal, and loud voice. Journal of the Acoustical Society of America. 1988;84(2):511–529. doi: 10.1121/1.396829. [DOI] [PubMed] [Google Scholar]
- Holmberg EB, Hillman RE, Perkell JS, Guiod PC, Goldman SL. Comparisons among aerodynamic, electroglottographic, and acoustic spectral measures of female voice. J Speech Hear Res. 1995;38(6):1212–1223. doi: 10.1044/jshr.3806.1212. [DOI] [PubMed] [Google Scholar]
- Huffman MK. Measures of phonation type in Hmong. Journal of the Acoustical Society of America. 1987;81(2):495–504. doi: 10.1121/1.394915. [DOI] [PubMed] [Google Scholar]
- Iseli M, Shue YL, Alwan A. Age, sex, and vowel dependencies of acoustic measures related to the voice source. J Acoust Soc Am. 2007;121(4):2283–2295. doi: 10.1121/1.2697522. [DOI] [PubMed] [Google Scholar]
- Kempster GB, Gerratt BR, Verdolini Abbott K, Barkmeier-Kraemer J, Hillman RE. Consensus auditory-perceptual evaluation of voice: development of a standardized clinical protocol. Am J Speech Lang Pathol. 2009;18(2):124–132. doi: 10.1044/1058-0360(2008/08-0017). 1058-0360_2008_08-0017 [pii] [DOI] [PubMed] [Google Scholar]
- Klatt DH, Klatt LC. Analysis, synthesis, and perception of voice quality variations among female and male talkers. J Acoust Soc Am. 1990;87(2):820–857. doi: 10.1121/1.398894. [DOI] [PubMed] [Google Scholar]
- Kotby MN, El-Sady SR, Basiouny SE, Abou-Rass YA, Hegazi MA. Efficacy of the accent method of voice therapy. J Voice. 1991;5(4):316–320. [Google Scholar]
- Kreiman J, Gerratt BR, Antoñanzas-Barroso N. Measures of the glottal source spectrum. J Speech Lang Hear Res. 2007;50(3):595–610. doi: 10.1044/1092-4388(2007/042). 50/3/595 [pii] [DOI] [PubMed] [Google Scholar]
- Kreiman J, Gerratt BR, Berke GS. The multidimensional nature of pathologic vocal quality. J Acoust Soc Am. 1994;96(3):1291–1302. doi: 10.1121/1.410277. [DOI] [PubMed] [Google Scholar]
- Kreiman J, Gerratt BR, Kempster GB, Erman A, Berke GS. Perceptual evaluation of voice quality: review, tutorial, and a framework for future research. J Speech Hear Res. 1993;36(1):21–40. doi: 10.1044/jshr.3601.21. [DOI] [PubMed] [Google Scholar]
- Kreiman J, Gerratt BR. Perceptual sensitivity to first harmonic amplitude in the voice source. J Acoust Soc Am. 2010;128(4):2085–2089. doi: 10.1121/1.3478784. [DOI] [PMC free article] [PubMed] [Google Scholar]
- Liljencrants J. Speech Synthesis with a Reflection-Type Line Analog. (D.S.), Royal Inst. of Tech; Stockholm, Sweden: 1985. [Google Scholar]
- Little MA, Costello DA, Harries ML. Objective dysphonia quantification in vocal fold paralysis: comparing nonlinear with classical measures. J Voice. 2011;25(1):21–31. doi: 10.1016/j.jvoice.2009.04.004. S0892-1997(09)00057-5 [pii] [DOI] [PMC free article] [PubMed] [Google Scholar]
- Lundy DS, Casiano RR, McClinton ME, Xue JW. Early results of transcutaneous injection laryngoplasty with micronized acellular dermis versus type-I thyroplasty for glottic incompetence dysphonia due to unilateral vocal fold paralysis. J Voice. 2003;17(4):589–595. doi: 10.1067/s0892-1997(03)00081-x. [DOI] [PubMed] [Google Scholar]
- Martin D, Fitch J, Wolfe V. Pathologic voice type and the acoustic prediction of severity. J Speech Hear Res. 1995;38(4):765–771. doi: 10.1044/jshr.3804.765. [DOI] [PubMed] [Google Scholar]
- Milstein CF, Akst LM, Hicks MD, Abelson TI, Strome M. Long-term effects of micronized Alloderm injection for unilateral vocal fold paralysis. Laryngoscope. 2005;115(9):1691–1696. doi: 10.1097/01.mlg.0000173163.07828.30. 00005537-200509000-00031 [pii] [DOI] [PubMed] [Google Scholar]
- Murphy PJ. On first rahmonic amplitude in the analysis of synthesized aperiodic voice signals. J Acoust Soc Am. 2006;120(5):2896–2907. doi: 10.1121/1.2355483. [DOI] [PubMed] [Google Scholar]
- Oppenheim AV, Schafer RW, Stockham TG., Jr Nonlinear filtering of multiplied and convolved signals. Proc IEEE. 1968;56(8):1264–1291. [Google Scholar]
- Rammage LA, Peppard RC, Bless DM. Aerodynamic, laryngoscopic, and perceptual-acoustic characteristics in dysphonic females with posterior glottal chinks: a retrospective study. J Voice. 1992;6(1):64–78. [Google Scholar]
- Samlan RA, Story BH. Relation of structural and vibratory kinematics of the vocal folds to two acoustic measures of breathy voice based on computational modeling. J Speech Lang Hear Res. 2011;54(5):1267–1283. doi: 10.1044/1092-4388(2011/10-0195). 1092-4388_2011_10-0195 [pii] [DOI] [PMC free article] [PubMed] [Google Scholar]
- Schindler A, Bottero A, Capaccio P, Ginocchio D, Adorni F, Ottaviani F. Vocal improvement after voice therapy in unilateral vocal fold paralysis. J Voice. 2008;22(1):113–118. doi: 10.1016/j.jvoice.2006.08.004. S0892-1997(06)00103-2 [pii] [DOI] [PubMed] [Google Scholar]
- Shrivastav R. The use of an auditory model in predicting perceptual ratings of breathy voice quality. J Voice. 2003;17(4):502–512. doi: 10.1067/s0892-1997(03)00077-8. [DOI] [PubMed] [Google Scholar]
- Shrivastav R, Sapienza CM. Objective measures of breathy voice quality obtained using an auditory model. J Acoust Soc Am. 2003;114(4 Pt 1):2217–2224. doi: 10.1121/1.1605414. [DOI] [PubMed] [Google Scholar]
- Simpson AP. The first and second harmonics should not be used to measure breathiness in male and female voices. J Phonetics. 2012;40:477–490. doi: 10.1016/j.wocn.2012.02.001. [DOI] [Google Scholar]
- Story BH. PHD. University of Iowa; Iowa City: 1995. Speech Simulation with an Enhanced Wave-Reflection Model of the Vocal Tract. [Google Scholar]
- Story BH. Comparison of magnetic resonance imaging-based vocal tract area functions obtained from the same speaker in 1994 and 2002. J Acoust Soc Am. 2008;123(1):327–335. doi: 10.1121/1.2805683. [DOI] [PMC free article] [PubMed] [Google Scholar]
- Södersten M, Lindestad PA. Glottal closure and perceived breathiness during phonation in normally speaking subjects. J Speech Hear Res. 1990;33(3):601–611. doi: 10.1044/jshr.3303.601. [DOI] [PubMed] [Google Scholar]
- Tasko SM, Greilick K. Acoustic and articulatory features of diphthong production: a speech clarity study. J Speech Lang Hear Res. 2010;53(1):84–99. doi: 10.1044/1092-4388(2009/08-0124). 1092-4388_2009_08-0124 [pii] [DOI] [PubMed] [Google Scholar]
- Titze IR. Parameterization of the glottal area, glottal flow, and vocal fold contact area. J Acoust Soc Am. 1984;75(2):570–580. doi: 10.1121/1.390530. [DOI] [PubMed] [Google Scholar]
- Titze IR. A four-parameter model of the glottis and vocal fold contact area. 1989;8(3):191–201. [Google Scholar]
- Titze IR. Acoustic interpretation of resonant voice. J Voice. 2001;15(4):519–528. doi: 10.1016/S0892-1997(01)00052-2. S0892-1997(01)00052-2 [pii] [DOI] [PubMed] [Google Scholar]
- Titze IR. Regulating glottal airflow in phonation: application of the maximum power transfer theorem to a low dimensional phonation model. J Acoust Soc Am. 2002;111(1 Pt 1):367–376. doi: 10.1121/1.1417526. [DOI] [PubMed] [Google Scholar]
- Titze IR. The myoelastic aerodynamic theory of phonation. Iowa City: National Center for Voice and Speech; 2006a. [Google Scholar]
- Titze IR. Voice training and therapy with a semi-occluded vocal tract: rationale and scientific underpinnings. J Speech Lang Hear Res. 2006b;49(2):448–59. doi: 10.1044/1092-4388(2006/035). [DOI] [PubMed] [Google Scholar]
- Titze IR. Nonlinear source-filter coupling in phonation: theory. J Acoust Soc Am. 2008;123(5):2733–2749. doi: 10.1121/1.2832337. [DOI] [PMC free article] [PubMed] [Google Scholar]
- Titze IR, Story BH. Acoustic interactions of the voice source with the lower vocal tract. J Acoust Soc Am. 1997;101(4):2234–2243. doi: 10.1121/1.418246. [DOI] [PubMed] [Google Scholar]
- Titze IR, Story BH. Rules for controlling low-dimensional vocal fold models with muscle activation. J Acoust Soc Am. 2002;112(3):1064–76. doi: 10.1121/1.149608. [DOI] [PubMed] [Google Scholar]
- Wayland R, Jongman A. Acoustic correlates of breathy and clear vowels: the case of Khmer. Journal of Phonetics. 2003;31:181–201. [Google Scholar]
- Yumoto E, Kadota Y, Kurokawa H. Infraglottic aspect of canine vocal fold vibration: effect of increase of mean airflow rate and lengthening of vocal fold. J Voice. 1993;7(4):311–318. doi: 10.1016/s0892-1997(05)80119-5. [DOI] [PubMed] [Google Scholar]
- Yumoto E, Kadota Y, Kurokawa H. Thyroarytenoid muscle activity and infraglottic aspect of canine vocal fold vibration. Arch Otolaryngol Head Neck Surg. 1995;121(7):759–764. doi: 10.1001/archotol.1995.01890070045010. [DOI] [PubMed] [Google Scholar]
- Yumoto E, Kadota Y, Mori T. Vocal fold vibration viewed from the tracheal side in living human beings. Otolaryngol Head Neck Surg. 1996;115(4):329–334. doi: 10.1016/S0194-5998(96)70047-5. S0194599896014775 [pii] [DOI] [PubMed] [Google Scholar]
Associated Data
This section collects any data citations, data availability statements, or supplementary materials included in this article.


