

Supplemental Digital Content is available in the text.
Abstract
Background:
Prolonged high temperatures and air pollution from wildfires often occur together, and the two may interact in their effects on mortality. However, there are few data on such possible interactions.
Methods:
We analyzed day-to-day variations in the number of deaths in Moscow, Russia, in relation to air pollution levels and temperature during the disastrous heat wave and wildfire of 2010. Corresponding data for the period 2006–2009 were used for comparison. Daily average levels of PM10 and ozone were obtained from several continuous measurement stations. The daily number of nonaccidental deaths from specific causes was extracted from official records. Analyses of interactions considered the main effect of temperature as well as the added effect of prolonged high temperatures and the interaction with PM10.
Results:
The major heat wave lasted for 44 days, with 24-hour average temperatures ranging from 24°C to 31°C and PM10 levels exceeding 300 μg/m3 on several days. There were close to 11,000 excess deaths from nonaccidental causes during this period, mainly among those older than 65 years. Increased risks also occurred in younger age groups. The most pronounced effects were for deaths from cardiovascular, respiratory, genitourinary, and nervous system diseases. Continuously increasing risks following prolonged high temperatures were apparent during the first 2 weeks of the heat wave. Interactions between high temperatures and air pollution from wildfires in excess of an additive effect contributed to more than 2000 deaths.
Conclusions:
Interactions between high temperatures and wildfire air pollution should be considered in risk assessments regarding health consequences of climate change.
Heat waves and wildfires constitute important public health threats. Predictions based on climate change scenarios indicate that more intense and longer heat events are likely to become more frequent in temperate zones.1,2 Acute effects of heat waves on mortality are well documented.3,4 Primarily, cardiovascular mortality in the elderly population is affected, but studies have generally lacked adequate power to assess risks for other less common causes, as well as for persons of working ages. Furthermore, there is limited evidence on the interplay between heat intensity and duration regarding their adverse health effects.
Wildfire activity is also expected to be affected by climate change and leads to increased exposure to combustion-related particles.5 There is compelling evidence linking particulate air pollution in general to total6 and cardiovascular mortality7 after both short- and long-term exposure. More specifically, some studies have reported associations between wildfires and increased mortality,8,9 whereas others found no such relation10,11 or reported weak associations,12 which may be a result of low statistical power. Evidence is lacking on interactions between extended high temperatures and air pollution from wildfires on cause-specific mortality although these exposures often occur together.2
The prolonged heat wave in Moscow during the summer of 2010 triggered numerous wildfires in forests and peat bogs near the city. Earlier studies in Moscow have reported both heat and particulate-related effects on mortality, although under less extreme circumstances than in 2010.13,14 The initial death toll estimate for the heat wave in the summer of 2010 was around 55,000 for the European part of the Russian Federation.15 However, data on daily mortality have not previously been available, and analyses have not been possible on daily variations in temperature, air pollution levels, and mortality. Our aim was to analyze day-to-day variations of cause-specific mortality in Moscow in relation to air pollution levels and temperature during the heat wave and wildfire period in July and August 2010.
METHODS
Air Pollution and Meteorology
Daily meteorological and air pollution data from 2006 to 2010 were supplied by the State Environmental Protection Institution Mosecomonitoring, which operates the Moscow State Environmental Monitoring System.16,17 Automatic air quality monitoring stations are placed in all functional zones of the city: residential zones, mixed residential/industrial zones, green areas, and near motorways. Each station continuously monitors a set of pollutants under WHO maintenance and air quality measurement guidelines.18
PM10 and ozone measurements are the focus of our analyses. The number of PM10 measuring stations in Moscow increased from six in 2006 to nine in 2008. PM10 was initially measured by Russian-made radio-isotopic devices. Between 2006 and 2008, these instruments were gradually replaced at all stations with oscillating microbalance monitors TEOM1400a (Thermo Fisher Scientific, Franklin, MA). Although PM10 measurements for this study were obtained mostly from TEOM1400a, three stations that used radio-isotopic devices until 2008 were also included. A factor of 1.3 was used to convert TEOM1400a to reference gravimetric measurements, as recommended for Northern and Central Europe.19 This factor was not applied during the days with maximum air temperatures above 30°C. The number of ozone-monitoring stations increased from nine in 2006 to 13 in 2010. Ozone was measured by ultraviolet fluorescence methodology and differential optical absorption spectroscopy.
Only the stations that had more than 75% of valid hourly averages during each day were included in calculations of city average pollution levels during that day. Day-to-day variations in numbers of operating stations were taken into account by a standardization procedure. Thus, each observation from a station was subtracted from that station’s annual mean and the resulting value divided by the corresponding standard deviation. Then, a common daily mean was constructed by averaging all available standardized observations for that day. Finally, this average was multiplied by the standard deviation of the most representative station, and the mean annual concentration of this station was added. Selection of the most representative station was based on the completeness of measurements during a particular year. Data from at least one PM10-monitoring and one O3-monitoring station were available for each day during the observation period.
Average daily temperatures and relative humidity were obtained by Mosecomonitoring from the Meteorological Observatory of the Moscow State University, which has data acquisition procedures complying with requirements of the World Meteorological Organization. In the calculation of heat wave threshold temperatures, data from 1980 and onward were used.
Mortality
Information on daily deaths in the city of Moscow during the 5-year period 2006–2010 was based on Russian State statistics. With a population of 11.5 million in 2010, Moscow experiences about 300 deaths a day. Each death in Russia is certified by an authorized medical expert, who identifies the date, place, and primary cause of death using International Classification of Diseases, Tenth Revision (ICD-10) codes. This expert issues a “medical certificate of death” that is reported to the local civil registration office. This office then makes an official record of death and reports it to the Russian State Statistical Service. No specific validation of death records was performed for this study, but the autopsy rate in Moscow is relatively high, varying from 46% in 2006 to 50% in 2009. The proportion of ill-defined and unspecified causes of death (ICD-10 code R99) was 4–5% during this period.
Statistical Analysis
A detailed description of the statistical methodology is provided in the eAppendix (http://links.lww.com/EDE/A778). Data were analyzed using two complementary approaches. In the first, we analyzed mortality from all major causes defined in the ICD-10 chapters, except for those with fewer than 100 deaths during the heat wave period (6 July to 18 August 2010). Generalized linear models with identity link and Gaussian errors were applied to estimate the expected death counts for each cause of death separately.20 The death count during the period 2006–2009 was modeled as a function of time to predict the expected death counts during the heat wave period in 2010. In the second approach, we considered the effects of air pollution and temperature (and their interaction) on total nonaccidental mortality, using a generalized linear model with a logarithmic link function and Gaussian errors during the whole study period 2006–2010. The independent variables included long-term time trend modeled by linear and quadratic functions of day number during the study period; seasonal periodicity modeled by a restricted cubic spline for day of year; day of week introduced by indicator variables; relative humidity during the day of the outcome; average measures of PM10, ozone, and temperature over the day of the outcome and the previous day; average measures of PM10, ozone, and temperature over the time period between the 6th and the 2nd day before the outcome; an interaction term between ozone and season; and a multiplicative interaction term between PM10 and temperature exceeding 18°C (minimum of the mortality-temperature relationship). The variables used to model the “added” effect of the number of days into the heat wave (sometimes called “wave effect”) follow the approach described by Gasparrini and Armstrong.21
RESULTS
Figure 1 shows daily temperature and PM10 levels in Moscow from 1 June to 31 August 2010, as well as total number of nonaccidental deaths. On several days, 24-hour average temperatures exceeded 30°C and PM10 levels exceeded 300 μg/m3. A heat wave threshold was set at the 98th percentile of daily mean temperatures (23.6°C). Using a heat wave definition of at least three consecutive days with temperatures above this threshold, six heat waves were identified in 2006–2009 and two in 2010 (6 days in late June and 44 days between 6 July and 18 August). The latter prolonged heat wave period in 2010 is the primary focus of our analyses. We observed three episodes when daily mean PM10 levels exceeded the 98th percentile (90 μg/m3), and all are nested within the prolonged heat wave period. As seen in Figure 1, both temperature and air pollution levels influenced the mortality. The highest number of deaths followed the major air pollution episode in early August, during the final part of the heat wave, when daily death rates were three times higher than normal. For comparison, data on daily temperature, PM10 levels, and mortality during the whole observation period (2006–2010) are shown in eFigure 1 (http://links.lww.com/EDE/A778).
FIGURE 1.
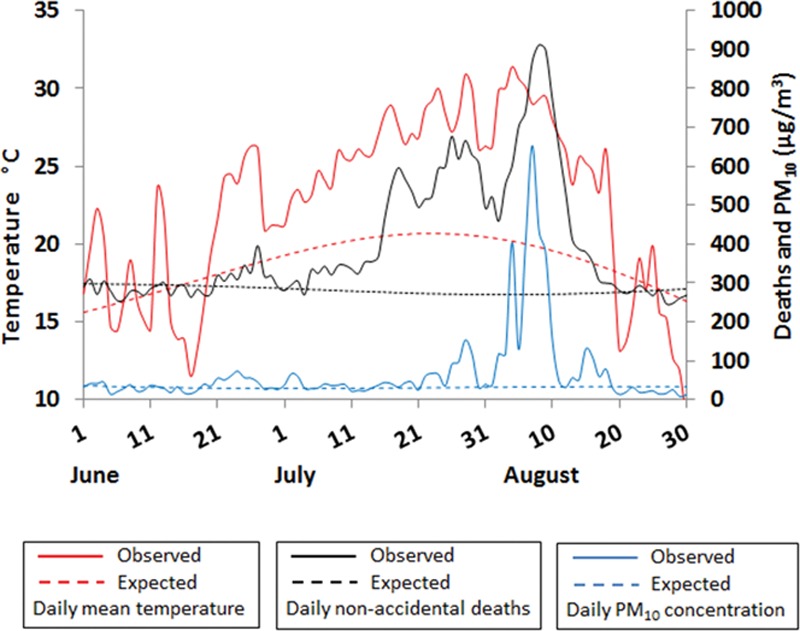
Daily nonaccidental deaths, mean temperature, and PM10 levels in Moscow during the summer of 2010. Solid lines show observed values; dashed lines, expected values.
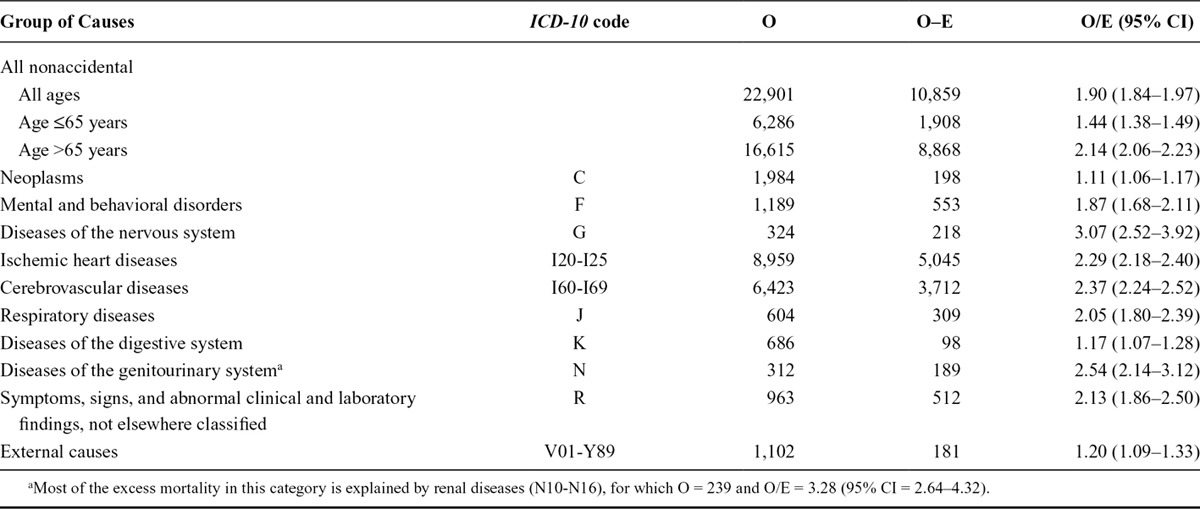
The Table shows observed and expected number of deaths from 6 July to 18 August 2010, according to age and major disease groups. The total number of excess deaths from nonaccidental causes during this period was 10,860. Risks were higher among those older than 65 years, although a clear increase was seen also in those of working ages. Risks were elevated for all specific causes; the greatest relative increases were observed for deaths from nervous system (relative risk [RR] = 3.07), genitourinary (RR = 2.54), cerebrovascular (RR = 2.37), ischemic heart (RR = 2.29), and respiratory (RR = 2.05) diseases. Renal diseases were responsible for most of the excess risk among the genitourinary diseases. We saw no clear sex-related differences in excess number of deaths during the heat wave (data not shown).
TABLE.
Observed (O) and Expected (E) Deaths During the Moscow Heat Wave from 6 June to 18 August 2010
There was a strong increase in mortality during the heat wave not explained by temperature as estimated from previous years. Figure 2 shows the main effect of temperature specified as an increase in mortality attributable to variations of daily temperatures over the preceding week, relative to the minimum of the mortality-temperature relationship. The minimum appeared at 18°C, and high temperatures in particular led to sharp increases in mortality. Figure 3 shows the effect of consecutive heat wave days (“added” effect of temperature) specified by the relative increase in mortality from nonaccidental causes modeled as a smooth function of day number starting 6 July 2010. There is a steep increase in RR during the first 2 weeks of the heat wave, up to 1.38 (95% confidence interval [CI] = 1.27–1.50), and then a gradual decrease until the end of the heat wave.
FIGURE 2.
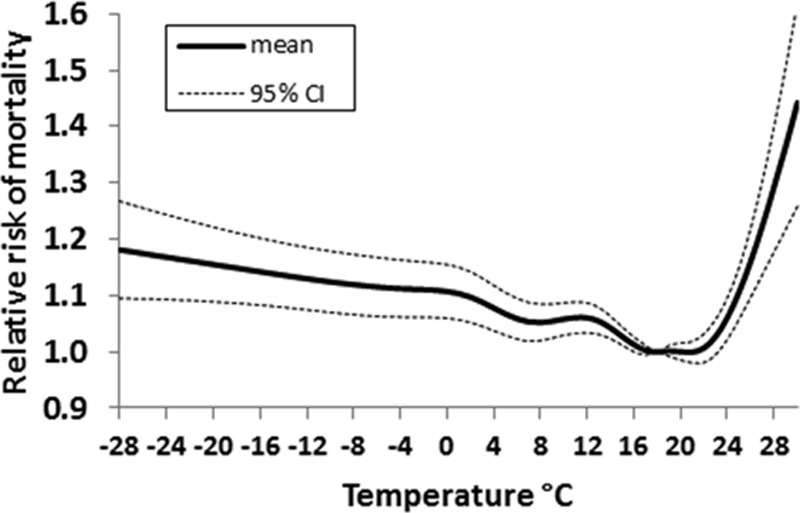
Relative increase in nonaccidental mortality 2006–2010 in Moscow related to temperature, averaged over 1 week, compared with a temperature of 18°C. The graphs indicate mean relative increase and 95% confidence interval.
FIGURE 3.
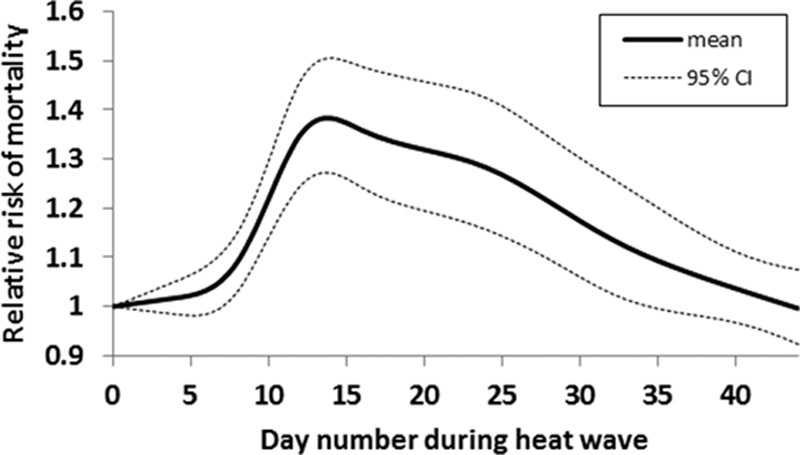
Relative increase in nonaccidental mortality in Moscow between 6 July and 18 August 2010 attributable to the effect of consecutive heat wave days. The graphs indicate mean relative increase and 95% confidence interval.
The estimated relative increases in daily nonaccidental mortality attributable to temperature, air pollution, and their interaction are illustrated in Figure 4. The relative increases attributable to air pollution and interaction are calculated against the mean levels of PM10 and ozone during the summers 2006–2009 (36 and 35 μg/m3, respectively). Each curve marks up the respective multiplier or factor: AB represents the expected death count from model (1); AC/AB is the relative increase in mortality attributable to the main effect of high temperatures; AD/AC represents the relative increase in mortality attributable to the “added” effect of prolonged high temperatures on consecutive days; AE/AD is the relative increase attributed to linear terms with air pollution; and AF/AE is the relative increase attributed to interaction between PM10 and temperature.
FIGURE 4.
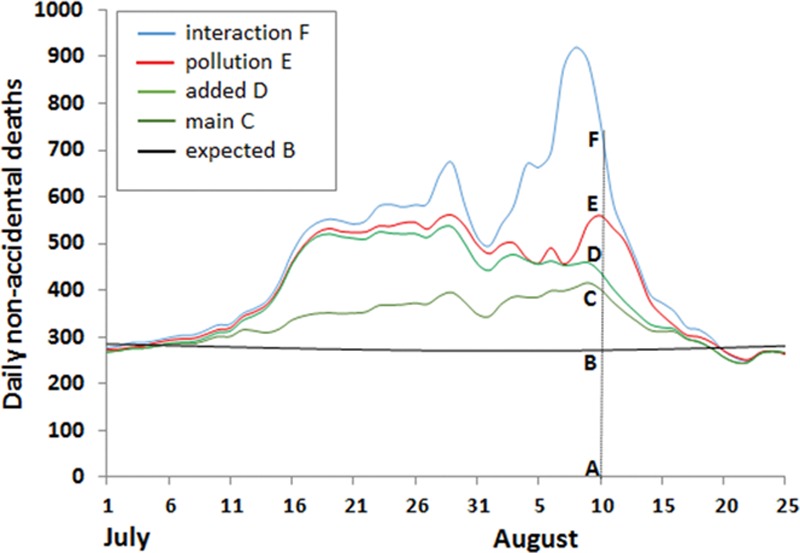
Estimated contributions from temperature, air pollution, and their interaction to daily number of nonaccidental deaths in Moscow during the heat wave period in the summer of 2010. “Interaction” is between PM10 and temperature; “pollution” is PM10 and ozone; “added” is the heat wave effect in addition to the temperature effect; and “main” is the temperature effect.
We chose the order of explanatory variables in Figure 4 to illustrate what would happen if all pollution is taken away, leaving only temperature as a risk factor. This hypothetical situation would correspond to the area below the D line in the graph. The relative magnitude of the interaction term can be illustrated by comparing the predicted responses of total nonaccidental mortality with increases in PM10 at varying temperatures. For example, relative increases in mortality per 10 μg/m3 PM10 were 0.43% (95% CI % = 0.09–0.77%) at temperature ≤18°C, 0.77% (0.40%–1.13%) at temperature equal to 22°C, and 1.44% (0.94%–1.94%) at temperature equal to 30°C. Risk coefficients for PM10 and ozone at various time lags after the exposure are reported in the eAppendix (http://links.lww.com/EDE/A778).
Three types of sensitivity analyses were performed to test the robustness of estimated risks to key assumptions of the statistical model. Regarding the method of accounting for temporal confounding, we observed a convergence of the results obtained from models with sinusoidal and restricted cubic splines of day of year. The risk coefficient for PM10 remained fairly stable when we changed the specification of the main effect of temperature, varying the degree of residual confounding over the course of 1 week after the exposure. Regarding the choice of the heat wave threshold, it is of note that the model based on 99% percentile threshold resulted in a marked reduction in the heat-PM10 interaction coefficient. This more strict definition led to a later start of the heat wave, a greater influence by the “added” effect of temperature, and relatively less important interaction effects. Model assumptions and results of sensitivity analyses are reported in eTable 1 (http://links.lww.com/EDE/A778).
We also estimated the approximate partial contributions from several risk factors to the total nonaccidental excess mortality during the heat wave period by linearization of the multiplicative model (2). The predominant influence appeared to be from the main effect of temperature, ie, the increased risk attributable to the independent effects of daily temperature levels, which accounted for 40% of the excess number of nonaccidental deaths, corresponding to more than 4300 deaths. Air pollution and temperature-air pollution interaction (exceeding an additive effect) showed shares of 9% and 20%, respectively, corresponding to about 1000 and 2200 deaths. Both PM10 and ozone were included under “air pollution,” with contributions of 5% and 4%, respectively, while the interaction focused on temperature and PM10. The total attributable proportion for temperature effects, including both main and “added” effects, as well as interactions with air pollution, amounted to 91%, whereas the corresponding proportion for air pollution was 29%.
DISCUSSION
Our study is unique in the combination of the intensity and duration of the heat wave, the high levels of air pollution from wildfires, and the large size of the affected population. These circumstances, together with the high-quality information on daily levels of air pollution and other environmental factors, as well as cause-specific mortality, made it possible to address some crucial issues for risk assessment in relation to climate change. For example, there are no previous data on combined effects on mortality by heat waves and air pollution from wildfires, although exposure to these combined factors is likely to occur more frequently with global warming. The importance of the interaction between high temperatures and air pollution in relation to mortality was highlighted for ozone during the 2003 heat wave in Europe.22 Overall, the excess number of deaths in Moscow during the heat wave period was more than 10,000, which exceeds the number of deaths during heat waves in Chicago in 199523 and Paris in 2003,24 and illustrates the public health impact of extreme weather conditions.
Most evidence on heat wave–related mortality comes from older people.4,25 We found clear effects in people younger than 65 years, although stronger associations were observed in those above this age. High excess risks were seen primarily for diseases of the cardiovascular, respiratory, nervous, and genitourinary systems. Earlier evidence has pointed mainly to associations with cardiovascular and respiratory mortality, but a few studies have also reported heat wave–related excess mortality for mental and renal diseases.26,27 Increased cardiovascular stress, kidney dysfunction, and disturbances of the electrolytic balance caused by dehydration contribute to the more pronounced effects for certain causes of death. We also found excess risks for other common causes of death, including cancer and diseases of the digestive system. This is probably related to poor conditions in hospitals and other treatment facilities, such as lack of air conditioning. In addition, heat wave effects on mortality are affected by both intensity and duration in a complex interplay.3,21,28,29 Our findings show increasing excess risks with up to 2 weeks of prolonged high temperatures, followed by a downward trend that may indicate harvesting of the most susceptible individuals or the development of better coping strategies with time.
Several studies on particulate air pollution in cities, mainly from traffic and other sources unrelated to wildfires, indicate stronger effects by PM10 or other measures of particulate air pollution during months with high temperatures.30–32 For example, a study from Korea found a yearly excess mortality of 0.28% per 10 μg/m3 PM10, which increased to 0.57% in the summer.31 In our data, the excess mortality per 10 μg/m3 PM10 increased from 0.43% below 18°C to 1.44% at 30°C. Our results contribute to the available evidence on air pollution from wildfires and mortality, which is limited and inconclusive,8–12 and indicate that interactions with high temperatures are of importance, similar to the situation for urban particulate air pollution. A recent report estimated the global mortality attributable to smoke from vegetation fires to more than 300,000 deaths annually.33 Our findings provide strong evidence that interactions between high temperatures and wildfire air pollution need to be considered in health risk assessments, particularly because the two often occur together.
In conclusion, our study shows major acute effects on mortality by high temperatures and air pollution during the prolonged 2010 heat wave in Moscow. Effects were seen among the working age population as well as the older population and for causes of death in addition to cardiovascular disease. Mortality related to the prolonged heat wave increased steeply during the first 2 weeks, after which the excess risk gradually tapered off. Interaction between high temperatures and air pollution from wildfires added a substantial number of deaths.
Footnotes
Supported by grants from the Swedish Research Council FORMAS and the Swedish Environmental Protection Agency.
Supplemental digital content is available through direct URL citations in the HTML and PDF versions of this article (www.epidem.com). This content is not peer-reviewed or copy-edited; it is the sole responsibility of the author.
Editors' note: A commentary on this article appears on page 365.
REFERENCES
- 1.Meehl GA, Tebaldi C. More intense, more frequent, and longer lasting heat waves in the 21st century. Science. 2004;305:994–997. doi: 10.1126/science.1098704. [DOI] [PubMed] [Google Scholar]
- 2.De Sario M, Katsouyanni K, Michelozzi P. Climate change, extreme weather events, air pollution and respiratory health in Europe. Eur Respir J. 2013;42:826–843. doi: 10.1183/09031936.00074712. [DOI] [PubMed] [Google Scholar]
- 3.Anderson GB, Bell ML. Heat waves in the United States: mortality risk during heat waves and effect modification by heat wave characteristics in 43 U.S. communities. Environ Health Perspect. 2011;119:210–218. doi: 10.1289/ehp.1002313. [DOI] [PMC free article] [PubMed] [Google Scholar]
- 4.Åström DO, Forsberg B, Rocklöv J. Heat wave impact on morbidity and mortality in the elderly population: a review of recent studies. Maturitas. 2011;69:99–105. doi: 10.1016/j.maturitas.2011.03.008. [DOI] [PubMed] [Google Scholar]
- 5.Climate Change 2007. The physical science basis. Contribution of working group 1 to the fourth assessment report of the intergovernmental panel on climate change (IPCC). In: Solomon S, Qin D, Manning M, editors. United Kingdom and New York, NY: Cambridge University Press; 2007. [Google Scholar]
- 6.Pope CA, 3rd, Dockery DW. Health effects of fine particulate air pollution: lines that connect. J Air Waste Manag Assoc. 2006;56:709–742. doi: 10.1080/10473289.2006.10464485. [DOI] [PubMed] [Google Scholar]
- 7.Anderson JO, Thundiyil JG, Stolbach A. Clearing the air: a review of the effects of particulate matter air pollution on human health. J Med Toxicol. 2012;8:166–175. doi: 10.1007/s13181-011-0203-1. [DOI] [PMC free article] [PubMed] [Google Scholar]
- 8.Johnston F, Hanigan I, Henderson S, Morgan G, Bowman D. Extreme air pollution events from bushfires and dust storms and their association with mortality in Sydney, Australia 1994-2007. Environ Res. 2011;111:811–816. doi: 10.1016/j.envres.2011.05.007. [DOI] [PubMed] [Google Scholar]
- 9.Analitis A, Georgiadis I, Katsouyanni K. Forest fires are associated with elevated mortality in a dense urban setting. Occup Environ Med. 2012;69:158–162. doi: 10.1136/oem.2010.064238. [DOI] [PubMed] [Google Scholar]
- 10.Vedal S, Dutton SJ. Wildfire air pollution and daily mortality in a large urban area. Environ Res. 2006;102:29–35. doi: 10.1016/j.envres.2006.03.008. [DOI] [PubMed] [Google Scholar]
- 11.Morgan G, Sheppeard V, Khalaj B, et al. Effects of bushfire smoke on daily mortality and hospital admissions in Sydney, Australia. Epidemiology. 2010;21:47–55. doi: 10.1097/EDE.0b013e3181c15d5a. [DOI] [PubMed] [Google Scholar]
- 12.Hänninen OO, Salonen RO, Koistinen K, Lanki T, Barregard L, Jantunen M. Population exposure to fine particles and estimated excess mortality in Finland from an East European wildfire episode. J Expo Sci Environ Epidemiol. 2009;19:414–422. doi: 10.1038/jes.2008.31. [DOI] [PubMed] [Google Scholar]
- 13.Revich B, Shaposhnikov D. Excess mortality during heat waves and cold spells in Moscow, Russia. Occup Environ Med. 2008;65:691–696. doi: 10.1136/oem.2007.033944. [DOI] [PubMed] [Google Scholar]
- 14.Revich B, Shaposhnikov D. The effects of particulate and ozone pollution on mortality in Moscow, Russia. Air Qual Atmos Health. 2010;3:117–123. doi: 10.1007/s11869-009-0058-7. [DOI] [PMC free article] [PubMed] [Google Scholar]
- 15.Barriopedro D, Fischer EM, Luterbacher J, Trigo RM, García-Herrera R. The hot summer of 2010: redrawing the temperature record map of Europe. Science. 2011;332:220–224. doi: 10.1126/science.1201224. [DOI] [PubMed] [Google Scholar]
- 16.Newsletter No. 46, 2010. Berlin: WHO Collaborating Centre for Air Quality Management and Air Pollution Control; 2010. Air quality monitoring in Moscow. pp. 9–14. Available at: http://www.umweltbundesamt.de/whocc/archiv/NL-46.pdf. [Google Scholar]
- 17.Gorchakov G, Semoutnikova E, Karpov A, Lezina E. Air pollution in Moscow megacity. In: Moldoveanu AM, editor. Advanced Topics in Envi ronmental Health and Air Pollution Case Studies. Rijeka, Croatia: InTech; [Google Scholar]
- 18.Copenhagen: WHO Regional Publications, European Series; 1999. Monitoring ambient air quality for health impact assessment. Bower J et al, eds. World Health Organization Regional Office for Europe. No. 85, [PubMed] [Google Scholar]
- 19.Williams M, Bruckmann P. Brussels: 2002. Guidance to member states on PM10 monitoring and intercomparisons with the reference method. EC Working group on particulate matter. Available at: http://ec.europa.eu/environment/air/pdf/finalwgreporten.pdf. [Google Scholar]
- 20.McCullagh P, Nelder JA. Generalized Linear Models. 2nd ed. London, UK: Chapman and Hall; 1989. [Google Scholar]
- 21.Gasparrini A, Armstrong B. The impact of heat waves on mortality. Epidemiology. 2011;22:68–73. doi: 10.1097/EDE.0b013e3181fdcd99. [DOI] [PMC free article] [PubMed] [Google Scholar]
- 22.Filleul L, Cassadou S, Médina S, et al. The relation between temperature, ozone, and mortality in nine French cities during the heat wave of 2003. Environ Health Perspect. 2006;114:1344–1347. doi: 10.1289/ehp.8328. [DOI] [PMC free article] [PubMed] [Google Scholar]
- 23.Whitman S, Good G, Donoghue ER, Benbow N, Shou W, Mou S. Mortality in Chicago attributed to the July 1995 heat wave. Am J Public Health. 1997;87:1515–1518. doi: 10.2105/ajph.87.9.1515. [DOI] [PMC free article] [PubMed] [Google Scholar]
- 24.Vandentorren S, Suzan F, Medina S, et al. Mortality in 13 French cities during the August 2003 heat wave. Am J Public Health. 2004;94:1518–1520. doi: 10.2105/ajph.94.9.1518. [DOI] [PMC free article] [PubMed] [Google Scholar]
- 25.Baccini M, Kosatsky T, Analitis A, et al. PHEWE Collaborative Group. Impact of heat on mortality in 15 European cities: attributable deaths under different weather scenarios. J Epidemiol Community Health. 2011;65:64–70. doi: 10.1136/jech.2008.085639. [DOI] [PubMed] [Google Scholar]
- 26.Kovats RS, Hajat S. Heat stress and public health: a critical review. Annu Rev Public Health. 2008;29:41–55. doi: 10.1146/annurev.publhealth.29.020907.090843. [DOI] [PubMed] [Google Scholar]
- 27.WHO. Copenhagen: World Health Organization Regional Office for Europe; 2009. Improving public health responses to extreme weather/heat-waves–EuroHEAT. [Google Scholar]
- 28.D’Ippoliti D, Michelozzi P, Marino C, et al. The impact of heat waves on mortality in 9 European cities: results from the EuroHEAT project. Environ Health. 2010;9:37. doi: 10.1186/1476-069X-9-37. [DOI] [PMC free article] [PubMed] [Google Scholar]
- 29.Rocklov J, Barnett AG, Woodward A. On the estimation of heat-intensity and heat-duration effects in time series models of temperature-related mortality in Stockholm, Sweden. Environ Health. 2012;11:23. doi: 10.1186/1476-069X-11-23. [DOI] [PMC free article] [PubMed] [Google Scholar]
- 30.Peng RD, Dominici F, Pastor-Barriuso R, Zeger SL, Samet JM. Seasonal analyses of air pollution and mortality in 100 US cities. Am J Epidemiol. 2005;161:585–594. doi: 10.1093/aje/kwi075. [DOI] [PubMed] [Google Scholar]
- 31.Stafoggia M, Schwartz J, Forastiere F, Perucci CA SISTI Group. Does temperature modify the association between air pollution and mortality? A multicity case-crossover analysis in Italy. Am J Epidemiol. 2008;167:1476–1485. doi: 10.1093/aje/kwn074. [DOI] [PubMed] [Google Scholar]
- 32.Yi O, Hong YC, Kim H. Seasonal effect of PM(10) concentrations on mortality and morbidity in Seoul, Korea: a temperature-matched case-crossover analysis. Environ Res. 2010;110:89–95. doi: 10.1016/j.envres.2009.09.009. [DOI] [PubMed] [Google Scholar]
- 33.Johnston FH, Henderson SB, Chen Y, et al. Estimated global mortality attributable to smoke from landscape fires. Environ Health Perspect. 2012;120:695–701. doi: 10.1289/ehp.1104422. [DOI] [PMC free article] [PubMed] [Google Scholar]