Abstract
Purpose
Previous studies showed that lowering PrPC concomitantly reduced PrPSc in the brains of mice inoculated with prions. We aimed to develop assays that measure PrPC on the surface of human T98G glioblastoma and IMR32 neuroblastoma cells. Using these assays, we sought to identify chemical hits, confirmed hits, and scaffolds that potently lowered PrPC levels in human brains cells, without lethality, and that could achieve drug concentrations in the brain after oral or intraperitoneal dosing in mice.
Methods
We utilized HTS ELISA assays to identify small compounds that lower PrPC levels by ≥30% on the cell surface of human glioblastoma (T98G) and neuroblastoma (IMR32) cells.
Results
From 44,578 diverse chemical compounds tested, 138 hits were identified by single point confirmation (SPC) representing 7 chemical scaffolds in T98G cells, and 114 SPC hits representing 6 scaffolds found in IMR32 cells. When the confirmed SPC hits were combined with structurally related analogs, >300 compounds (representing 6 distinct chemical scaffolds) were tested for dose-response (EC50) in both cell lines, only studies in T98G cells identified compounds that reduced PrPC without killing the cells. EC50 values from 32 hits ranged from 65 nM to 4.1 μM. Twenty-eight were evaluated in vivo in pharmacokinetic studies after a single 10 mg/kg oral or intraperitoneal dose in mice. Our results showed brain concentrations as high as 16.2 μM, but only after intraperitoneal dosing.
Conclusions
Our studies identified leads for future studies to determine which compounds might lower PrPC levels in rodent brain, and provide the basis of a therapeutic for fatal disorders caused by PrP prions.
Keywords: prion, PrPC, PrPSc, neurodegeneration, Creutzfeldt-Jakob disease
1. INTRODUCTION
Prion diseases are caused by the aberrant processing of the normal, cellular prion protein (PrPC) into a disease-causing isoform, denoted PrPSc. Accumulation of PrPSc results in neurologic dysfunction. In both cells and animal models, transmission and propagation of prions can be titrated by controlling levels of PrPC expression and prevented if PrPC expression is abolished by knockout (KO) of the PrP gene (1–5). These results argued that PrPC expression is required for the initiation and propagation of prion disease. Because PrP-null mice have no apparent deficits or developmental problems, and have a normal life span (6), a therapy that effectively lowers PrPC levels might be efficacious and well tolerated.
Here we report results from high-throughput screening (HTS) of nearly 45,000 diverse chemical compounds using novel PrPC assays in human T98G glioblastoma and IMR32 neuroblastoma cells to identify and confirm hits that lower levels of PrPC on the cell surface. Many confirmed hits in T98G cells showed good to excellent potency (half-effective concentrations (EC50) by ELISAs < 1 μM), had minimal to no effect on cell viability (half-lethal dose (LC50) by calcein AM assays > 10 μM), and ultimately represented 6 chemical scaffolds. Leads were evaluated in vivo in pharmacokinetic studies after oral (PO) and intraperitoneal (IP) doses in mice. Brain concentrations were much higher after IP than after PO dosing. Our findings suggest that it may be possible to identify novel compounds to lower PrPC and thereby PrPSc in brain. Such compounds could prove efficacious in the treatment of Creutzfeldt-Jakob disease, for which there is currently no effective medication.
2. MATERIALS AND METHODS
2.1. Materials
Minimum essential medium (MEM), Geneticin, Dulbecco’s phosphate-buffered saline (PBS), TrisHCl, glycerol, SDS sample buffer and calcein-AM were purchased from Invitrogen (Carlsbad, CA); fetal bovine serum (FBS) from Thermo Scientific Hyclone (Rockford, IL); penicillin and streptomycin from Cellgro (Manassas, VA); cell dissociation buffer from Millipore (Billerica, MA); NaCl, ABTS peroxidase substrate and ABTS stop solution from Fisher Chemical (Houston, TX); ethyl alcohol from Gold Shield Chemical Co. (Hayward, CA); benzonase from EMD chemicals (Gibbstown, NJ); phenylmethylsulfonyl fluoride (PMSF) from MP Biomedicals (Solon, OH); and guanidine isothiocyanate from RPI (Mt. Prospect, IL). D18 and D13 antibodies were obtained as previously described (7). All other compounds and reagents were purchased from Sigma (St. Louis, MI) unless otherwise specified below.
Blank sodium heparinized plasma from mouse (CD-1) and human were obtained from Bioreclamation (Hicksville, NY). Pooled female CD-1 liver microsomes and pooled human liver microsomes, 0.5 M potassium phosphate pH 7.4, and NADPH Regenerating System Solutions A and B were obtained from BD Biosciences (Bedford, MA). Dextromethorphan HBr (positive control for microsomal assay) was obtained from Sigma-Aldrich (St. Louis, MO), and d3-dextromethorphan (internal standard for dextromethorphan) was obtained from Toronto Research Chemicals (Ontario, Canada).
Dose formulations for in-vivo pharmacokinetic studies contained propylene glycol (Sigma-Aldrich, St. Louis, MO), absolute ethanol (Fisher Scientific, Pittsburg, PA), labrosol (Gattefosse, France), polyethylene glycol 400 (PEG400; Hampton Research, Aliso Viejo, CA), and dimethyl sulfoxide (DMSO; Thermo Fisher Scientific, Rockford). Brain tissue was homogenized using a Precellys 24 (Bertin Technologies, France) tissue homogenizer. LC/MS/MS analysis was performed using an API 4000 triple quadruple mass spectrometer (Applied Biosystems) with Analyst 1.4.2 software, coupled to a Shimadzu CBM-20A controller, LC20AD pumps, and SIL-5000 auto sampler (Shimadzu Scientific, Columbia, MD).
2.2 Chemical library
The 44,578 compounds (as ~570 plates) used in HTS in the PrPC assays were two subsets of the ChemBridge commercially available compound library referred to as ChB-1 (~24,000 compounds) and ChB-2 (~20,000 compounds). The ChB-2 set was a custom “CNS Set” obtained directly from ChemBridge. The ChB-1 library was supplied by the Small Molecule Discovery Center (SMDC) at the University of California San Francisco and represents a diversity set derived from a larger set of ~150,000 compounds (3,014 plates in 96-well format). Primary HTS hits from all libraries were first confirmed by SPC using the original screening stocks. Full dose-titration curves (EC50) were generated using fresh powders purchased from the corresponding vendor. For SAR expansion, analogs of validated lead compounds were acquired from various vendors, including Albany Molecular Research, ASDI, ASINEX, Chemical Block, ChemBridge, ChemDiv, Enamine, InterBioScreen, Intermed Ltd, Key Organics, Life Chemicals, Maybridge, NanoSyn, Otava, Peakdale Molecular (Ryan Scientific), Princeton BioMolecular Research, Scientific Exchange, Sigma-Aldrich, SPECS, TCI North America, TimTec, and Vitas M Labs.
2.3 Plate selection
Seeking to extend our screening collection in the PrPC assay, we evaluated two commercially available (ChemBridge) preplated collections for their ability to complement the ChB-1 library we had already screened. The two libraries were termed the “1.0 μL” set of 14,240 compounds and the “0.5 μL” set of 39,838 compounds. We evaluated the library based on one traditional criterion, the coverage of chemical fragment space, and one non-traditional one, the coverage of predicted biological target space, as predicted by the similarity ensemble approach (SEA; http://sea.bkslab.org/) (8).
For the chemical analysis, we first analyzed our already screened in-house collection and compared it to each of the candidate libraries. Using a Daylight fingerprint (www.daylight.com), we computed the nearest neighbor of each compound in the candidate set to the in-house dataset, rejecting compounds that were more than 60% similar. The qualifying compounds were counted as a metric for the additional coverage of chemical space.
We then investigated whether there was any difference between the libraries at the molecular fragment level. We fragmented the molecules in three different ways, using the Molinspiration software package “mib” (http://molinspiration.com/docu/mib/): by the flag “-r1” ring systems, the flag “-ringSystems”, and Murcko scaffolds using the flag “-scaffold”. In each case, we counted the number of each type of fragment that was present in the new databases but was missing in the previously screened collection as a metric for chemical fragment novelty.
For biological target novelty, we used SEA to predict the target of each ligand in each collection, based on targets represented by ligands in the ChEMBL medicinal chemistry database version 02 (www.ebi.ac.uk/chembl/). We counted the number of targets that had at least one predicted active and at least 10 predicted actives for the previously screened collection. We then asked whether the candidate libraries provided coverage for any of the ChEMBL targets that did not have predicted ligands in the previously screened collection (9). We found no difference between the two libraries on this basis. Because we wanted to achieve maximum chemical and target diversity, we chose the larger set of compounds (39,838; ChB-2) for the second-round testing in the PrPC assay in order to identify more hits and leads. In total, we tested 44,578 compounds in the PrPC assays derived from ChB-1 (~24,000) and half of the set from ChB-2 (20,000). Although we purchased all 39,838 compounds in ChB-2 set, we had tested only 20,000 of these at the time the manuscript was prepared.
2.4. Potency and cellular toxicity assays
2.4.1. PrPC ELISA
Human T98G glioblastoma, human IMR32 neuroblastoma cells, and mouse N2a neuroblastoma cells (ATCC CRL-1690, CCL-127 and CCL-131), were maintained in tissue culture flasks (175 cm2) containing 32 mL of supplemented MEM (without Geneticin). To seed plates for compound treatment, the growth medium (supplemented MEM) was aspirated from the flasks, the cells washed twice with 10 mL of calcium- and magnesium-free Dulbecco’s PBS, and then detached by addition of 3 mL of cell dissociation buffer after incubation at room temperature (RT) for 5 min. The dissociation buffer was aspirated and the cells suspended in 10 mL of growth medium before counting using a Cellometer Auto T4 (Nexcelom Biosciences; Lawrence, MA). Each well of a white, clear-bottom, 96-well plate (Greiner) was seeded with 10,000 cells using a Matrix Wellmate dispenser and allowed to incubate overnight at 37 °C. The next day, test compounds were added to each well and the plates returned to the incubator. After 2 days, the growth medium was aspirated, and each well washed once with PBS supplemented with 0.25 mg/mL BSA (wash buffer) and aspirated dry. IMR32 and N2a cells were fixed by the addition of 50 μL/well of 4% paraformaldehyde (in PBS); T98G cells were used without fixation by paraformaldehyde. After 20 min at RT, the paraformaldehyde was removed by three washes of 250 μL/well of PBS and the wells aspirated dry. Horseradish peroxidase (HRP)–conjugated anti-human PrPC P antibody (7) (100 μL of a 1:1000 dilution in PBS supplemented with 3% w/v nonfat milk) was added to each well and the plate incubated at RT for 1 h. The antibody was removed with 5–6 washes of buffer (300 μL/well/wash), then 50 μL of Supersignal ELISA Pico Chemiluminescent substrate (Pierce Thermo) added to each well and the luminescence at 425 nm read immediately using a Spectramax M5 plate reader.
2.4.2. PrPC knockdown by siRNA
Reduction of PrPC expression was achieved by treating T98G cells (5000 cells/well) with 25 nM SMARTpool Accell PRNP siRNA (Dharmacon, catalog #E-011101-00-0005) for 5 h at 37 °C in 100 μL serum-free growth medium containing 0.3 μL Lipofectamine 2000 (Invitrogen, catalog #11668030). The PRNP siRNA targets human PRNP, NCBI accession numbers NM_000311, NM_001080121, NM_001080122, NM_001080123 and NM_183079. After 5 h, an additional 100 μL of medium containing 20% FBS was added to achieve a final culture concentration of 10% FBS. As a control, T98G cells were treated with a scrambled siRNA (AllStars Negative Control, Qiagen, catalog #1027280). The cells were maintained in a humidified, 5% CO2-enriched environment at 37 °C for 2 days. PrPC levels were quantified by ELISA (above) and by confocal fluorescence microscopy (below.)
2.4.3 PrPC quantification by confocal fluorescence microscopy
PrPC expression in T98G cells was measured using a GE IN Cell Analyzer 6000 imaging system. Following incubation with PRNP siRNA or the scrambled oligonucleotide for 2 days in 96-well plates, the growth medium was aspirated and a 1:500 dilution of a 1 mg/mL HuM-P antibody solution in growth medium was added to each well for 1 h at 37 °C. The cells were washed one time with wash buffer (PBS with 0.25 mg/mL BSA), then fixed with 4% paraformaldehyde in PBS for 30 min at RT. The plates were washed three times with wash buffer, blocked for 30 min at RT with PBS containing 0.01% Tween and 5% goat serum (PBS-TG), then incubated for 2 h at room temperature with goat anti-human Fab-FITC secondary antibody (1:200 dilution from 1.5 mg/mL stock, Jackson Immunosearch, cat#109-095-006). The plates were washed three times with wash buffer to remove unbound secondary antibody and the nuclei stained with Hoechst 33342 (1 μg/mL in PBS, Invitrogen, cat# H21492) for 10 min at RT. A final wash was done and the plates stored in PBS containing 1 mM sodium azide. The nuclear- and PrPC- labeled dyes were excited by laser emission at 405 and 488 nm, respectively.
2.4.4 Cell viability assays
Human T98G, human IMR32, or mouse N2a cells were seeded into 96-well, black polystyrene plates (Greiner) and treated with compound as described above for the ELISA plates. After 2 days, the growth media was aspirated, the plates washed once with PBS (250 μL/well) and then aspirated dry. Calcein-AM (100 μL/well, 5 μg/mL solution in calcium- and magnesium-free PBS) was added, and the plates were incubated at 37 °C for 45 min. Fluorescent emission intensity was quantified using a Spectramax M5 plate reader, excitation/emission spectra of 485 nm/530 nm.
2.5 Hepatic microsomal stability
Stock solutions of the compounds (0.5 mM) were prepared in DMSO. These were diluted 500-fold into 1 mL of microsomal incubation mixture to yield a final concentration of 1 μM. The incubation mixture was composed of 100 mM phosphate buffer, pH 7.4, and NADPH regenerating system (BD Biosciences NADPH Regenerating System Solutions A & B). This mixture was preincubated at 37 °C for 5 min in an Eppendorf Thermo mixer, and the reaction initiated by addition of 0.5 mg (25 μl of a 20 mg/mL solution) of liver microsomes. Aliquots (50 μl) were withdrawn at 0, 5, 15, 30, and 60 min, and added to 100 μl acetonitrile containing internal standard. After centrifugation at ~12,000 × g for 10 min, the supernatants were analyzed by LC/MS/MS. The percentage of solute remaining at the end of the incubation was used to determine the in-vitro half-life (t1/2) (10).
where (−k) is the slope of the linear regression line from the plot of log percent remaining versus incubation time.
2.6 Data analysis
Chemiluminescence (PrPC ELISA) and fluorescence (calcein cell viability) data were exported from the plate readers as text files and normalized either to positive controls (calcein) or to background (PrPC). Data were processed and stored in a Collaborative Drug Discovery (CDD) web-based database (www.collaborativedrug.com). Inhibition curves were generated using nonlinear regression employing the Levenberg Marquardt algorithm programmed into the CDD database (11). Search results were exported to Excel as structure-data files (sdf) or comma-separated values (csv) files for further data manipulation and SAR analysis.
2.7 Analyzing assay performance
Z′ (calcein assay) and Z (PrPC ELISA) scores to assess the precision, accuracy, and robustness were calculated using the following equations (12):
for which the positive control is calcein; the negative control is DMSO; and the background is the chemiluminescence signal in the absence of HRP-conjugated P antibody.
2.8 Structure-activity relationships
SAR analyses were performed using SARvision (Altoris Inc.), permitting the visualization, mining, and organization of chemical data. Chemical structure and biological assay data were combined in sdf files. SARvision was used to generate a list of scaffold(s) and organize them into hierarchical tree structures using the IDENTIFY SCAFFOLDS feature. Scaffolds were also drawn manually by selecting DRAW SCAFFOLD under the TREE dropdown menu. Additions or deletions by column/row were accomplished by selecting the appropriate function item under the TABLE dropdown menu, specifically to filter data by scaffold type or any associated data, such as HTS results, SPC data, EC50 values and physicochemical information. SARvision was also used to generate R-group tables to better visualize SAR for each chemical scaffold. The sorted data and table were then exported to MS Word, MS Excel, plain text, HTML, and sdf formats.
2.9 Physicochemical parameters
Physicochemical parameters were calculated for topological polar surface area relating to N and O atoms (TPSA_NO), partition coefficient (xlogP), hydrogen bond donor (HBD), and hydrogen bond acceptor (HBA) using Vortex v2011, Dotmatics Limited.
2.10 In-vivo pharmacokinetic studies and LC/MS/MS assays
Pharmacokinetic protocols involving animals were all reviewed and approved by the UCSF institutional animal care and use committee (IACUC). For in-vivo pharmacokinetic studies, compounds were dissolved either in a formulation containing 20% propylene glycol, 5% ethanol, 5% labrosol, and 70% PEG400 and administered by oral gavage or in DMSO for IP administration to female CD-1 mice weighing ~25 g. At specified time points after dosing (0.5, 2, 4, and 6 h for PO dosing, and 0.083, 0.25, 0.5, and 2 h for IP dosing), 2 animals each were euthanized by CO2, and ~1 mL blood (by cardiac puncture) and brain samples were collected to determine the concentration of the compounds. The heparinized blood samples were centrifuged to obtain plasma, which was stored at −80 °C until analysis. Brain samples were weighed, diluted 4-fold with water, and then homogenized using a Precellys 24 tissue homogenizer. Brain homogenates (20% wt/vol) were stored at −80 °C until analysis. Plasma and brain homogenate samples were extracted using a protein-precipitation method and analyzed by specific LC/MS/MS methods developed for each compound dosed in vivo, similar to that described in another report (13). The analytical method accuracy and precision were monitored by analyzing quality control (QC) samples that were prepared and treated using the same methods as calibration standards for the plasma or brain homogenate samples.
For LC/MS/MS quantification, samples and their respective internal standards were injected onto a BetaBasic C18 column maintained at RT and separated using a gradient between 0.1% formic acid in water and 0.1% formic acid in acetonitrile. Data acquisition used multiple reaction monitoring (MRM) in the positive-ion mode, using appropriate MRM transitions for each compound.
3. RESULTS
3.1 Chemical libraries screened
In IMR32 cells, 43,858 total compounds were tested: 23,858 from the ChB-1 library and 20,000 from the ChB-2, Set B library. In T98G cells, 44,578 total compounds were tested: 23,778 from ChB-1 and 20,800 from ChB-2, Set B library. Characteristics for Set A and Set B of ChB-2 are compared in Table 1.
Table 1.
Selected characteristics for compounds in the ChB-2 library sets.
| Set | Size (n) | 60% different (n) | Fragments (n) | Rings (n) | Murcko scaffolds (n) |
|---|---|---|---|---|---|
| Set A | 14,240 | 1,691 | 8,280 | 157 | 3,735 |
| Set B | 39,840 | 4,371 | 17,698 | 304 | 8,030 |
3.2 HTS
We screened all 23,858 small molecule compounds in the ChB-1 set first. We then analyzed two sets of compounds in the ChB-2 library—set A included 24,000 small molecules and set B included 39,840 compounds—for chemical fragment and biological target novelty to determine which would be screened next. At the whole molecule level, we found that 1,691 compounds from set A and 4,371 compounds from set B were more than 60% different from their nearest neighbor in the previously screened collection. This demonstrated that set B, almost twice the size of set A, had nearly three times as many new compounds as set A. At the fragment level, there were three different fragment types: the “-r1” ring systems, Murcko scaffolds, and small ring systems. We found that set B had 17,698 new fragments, whereas set A had only 8,280 new fragments. Considering Murcko scaffolds, set B had 8,030 new scaffolds, whereas set A had 3,735 new scaffolds. Finally, considering the smallest ring systems, set B had 304 new rings, whereas set A had only 157 new rings. Based on all measures of chemical fragment novelty, set B, at nearly twice the size of set A, provided at least twice the novelty as well. Therefore, we used set B for the second round of screening in the PrPC assays and screened 20,000 compounds. Set B is denoted the ChB-2 set of compounds (Table 1).
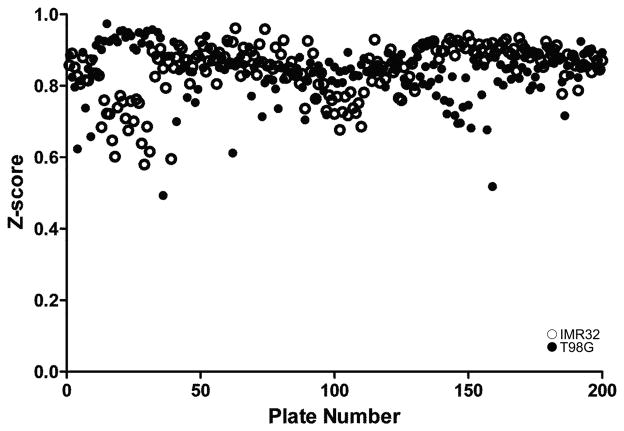
To establish the potency in reducing PrPC levels and effect on cell viability of the commercial compounds, we used dose-response curves to calculate EC50 in ELISA and LC50 in calcein AM assays in human T98G glioblastoma and human IMR32 neuroblastoma cells. Z-scores for 190 runs were excellent in both cells lines, ranging from 0.6–0.95 (Fig. 1).
Figure 1.
Z-scores in 190 assay runs for PrPC in human IMR32 neuroblastoma (open circles) and T98G glioblastoma (filled circles) cells.
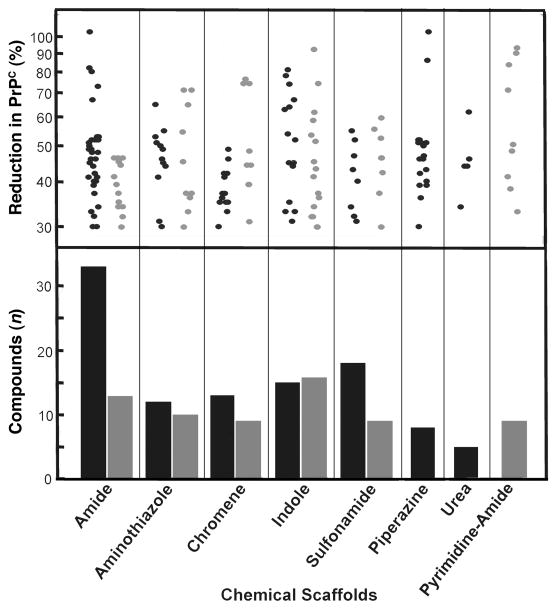
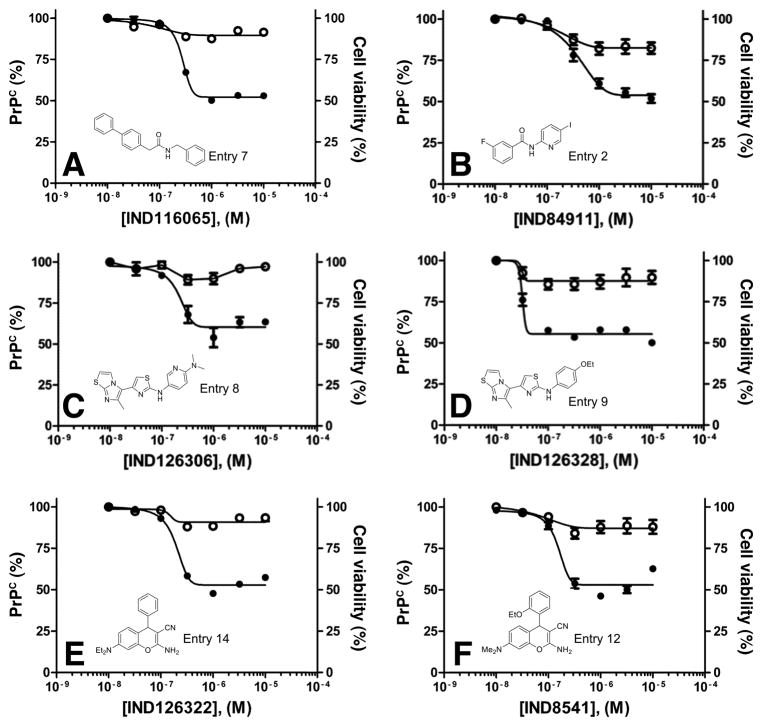
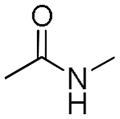
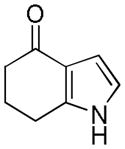
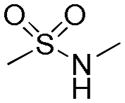
Compounds that reduced levels of PrPC by ≥30% relative to DMSO controls were considered hits. For T98G and IMR32 cells, 579 and 675 HTS hits, respectively, were identified. SPC assays were performed on these HTS hits, and 138 and 114 confirmed SPC hits were found for T98G and IMR32 cells, respectively. Confirmed SPC hits led to the initial identification of 7 chemical scaffolds for T98G cells and 6 chemical scaffolds for IMR32 cells, 5 of which were active in both cell lines (Fig. 2). Over 300 confirmed SPC hits and related analogs were tested for potency and cell viability assays by generating dose-titration curves in both cell lines. All confirmed SPC hits identified in IMR32 cells were either inactive (EC50 > 10 μM) or active (EC50 < 10 μM) at a concentration that also negatively affected cell viability (data not shown); these compounds, which included those from the indole and urea scaffolds, were therefore not evaluated further. Dose-response curves of the SPC hits identified in T98G cells resulted in many active compounds (EC50 ≤ 10 μM); these compounds represented 6 chemical scaffolds (Table 2). From these, as well as structurally related but distinct scaffolds purchased from commercial vendors, 32 compounds showed EC50 values < 5 μM (Supplemental Figure 1) and their physicochemical properties were calculated (Table 3). Dose-response curves for potency and cell viability for two of the potent confirmed hits from three representative scaffolds are shown (Fig. 3).
Figure 2.
(top) Reductions in PrPC levels by confirmed SPC hits in T98G (black) and IMR32 (gray) cells, given as percentages relative to PrPC in control cells treated with DMSO. Total SPC hits were 138 compounds representing 7 scaffolds in T98G cells and 114 compounds representing 6 scaffolds. (bottom) The number of compounds tested for each chemical scaffold is indicated.
Table 2.
Distribution of EC50 values for the final 6 chemical scaffolds confirmed in T98G cells, based on potency testing of confirmed SPC hits and related analogs.
| Scaffold | Murcko Fragment | Compounds tested (n) | Compounds with EC50 <1 μM (n) | Compounds with EC50 = 1–10 μM (n) |
|---|---|---|---|---|
| Amide |
|
159 | 5 | 8 |
| Aminothiazole |

|
26 | 5 | 3 |
| Chromene |

|
5 | 5 | 0 |
| Fused Pyrrole |
|
14 | 6 | 3 |
| Sulfonamide |
|
60 | 4 | 4 |
| Piperazine |

|
21 | 3 | 1 |
Table 3.
Scaffold, compound, potency (EC50 by ELISA), and calculated physicochemical parametersa for the 32 confirmed PrPC SPC hits in T98G cells.
| Scaffold | Compound | # | Structure | MW | EC50 ± SEM (μM)b | n | TPSA | xlogP | HBA/HBD |
|---|---|---|---|---|---|---|---|---|---|
| Amide | IND82865 | 1 |

|
316.4 | 0.15 ± 0.04 | 4 | 52.9 | 4.54 | 2/1 |
| IND84911 | 2 |

|
342.1 | 0.45 ± 0.10 | 6 | 42.0 | 3.22 | 2/1 | |
| IND116063 | 3 |

|
316.7 | 0.65 ± 0.06 | 4 | 58.6 | 2.88 | 3/1 | |
| IND85671 | 4 |

|
384.2 | 1.31 ± 0.35 | 7 | 60.4 | 3.04 | 4/1 | |
| IND85692 | 5 |

|
329.4 | 2.24 ± 0.39 | 6 | 77.6 | 4.44 | 5/1 | |
| IND87406 | 6 |

|
324.4 | 1.02 ± 0.09 | 18 | 88.3 | 1.98 | 3/1 | |
| IND116065 | 7 |

|
301.4 | 0.44 ± 0.11 | 6 | 29.1 | 5.05 | 1/1 | |
|
| |||||||||
| Aminothiazole | IND126306 | 8 |

|
356.5 | 0.22 ± 0.06 | 4 | 58.3 | 4.28 | 5/1 |
| IND126328 | 9 |

|
356.5 | 0.03 ± 0.01 | 4 | 51.4 | 5.59 | 4/1 | |
| IND9756 | 10 |

|
363.5 | 0.11 ± 0.01 | 3 | 45.5 | 5.29 | 4/1 | |
| IND115948 | 11 |

|
341.8 | 2.44 ± 1.37 | 6 | 55.1 | 4.49 | 4/1 | |
|
| |||||||||
| Chromene | IND8541 | 12 |

|
335.4 | 0.14 ± 0.02 | 4 | 71.5 | 3.37 | 5/1 |
| IND17990 | 13 |

|
309.3 | 0.03 ± 0.00 | 6 | 62.3 | 3.1 | 4/1 | |
| IND126322 | 14 |

|
319.4 | 0.17 ± 0.01 | 4 | 62.3 | 3.82 | 4/1 | |
| IND126361 | 15 |

|
291.4 | 0.12 ± 0.02 | 3 | 62.3 | 3 | 4/1 | |
| IND23846 | 16 |

|
297.4 | 0.22 ± 0.01 | 6 | 62.3 | 2.95 | 4/1 | |
|
| |||||||||
| Fused pyrrole | IND73602 | 17 |

|
289.4 | 0.41 ± 0.10 | 4 | 59.2 | 3.09 | 4/1 |
| IND116088 | 18 |

|
317.4 | 0.24 ± 0.07 | 3 | 59.2 | 4.01 | 4/1 | |
| IND126429 | 19 |

|
331.8 | 0.45 ± 0.03 | 4 | 59.2 | 4.18 | 4/1 | |
| IND126432 | 20 |

|
297.4 | 0.11 ± 0.02 | 4 | 59.2 | 3.56 | 4/1 | |
| IND87564 | 21 |

|
287.3 | 0.68 ± 0.34 | 6 | 83.96 | 2.80 | 4/1 | |
|
| |||||||||
| Piperazine | IND30802 | 22 |

|
365.3 | 0.17 ± 0.02 | 3 | 32.8 | 4.17 | 4/0 |
| IND116050 | 23 |

|
326.4 | 3.24 ± 2.35 | 3 | 42 | 2.89 | 4/0 | |
| IND126339 | 24 |

|
340.4 | 0.27 ± 0.02 | 4 | 42 | 3.17 | 4/0 | |
|
| |||||||||
| Sulfonamide | IND5418 | 25 |

|
341.5 | 3.77 ± 3.11 | 3 | 37.4 | 4.87 | 2/0 |
| IND16365 | 26 |

|
371.5 | 0.69 ± 0.17 | 3 | 46.6 | 4.96 | 3/0 | |
| IND18762 | 27 |

|
290.4 | 4.13 ± 0.66 | 4 | 59.1 | 2.11 | 3/1 | |
| IND86287 | 28 |

|
381.5 | 1.52 ± 0.66 | 4 | 79.4 | 2.35 | 4/1 | |
| IND116071 | 29 |

|
305.4 | 1.32 ± 0.32 | 4 | 55.8 | 2.15 | 4/0 | |
| IND126331 | 30 |

|
380.9 | 0.51 ± 0.17 | 3 | 75.7 | 3.33 | 4/1 | |
|
| |||||||||
| Bi-aryl ketone | IND1323 | 31 |

|
321.8 | 0.09 ± 0.01 | 4 | 70.8 | 3.21 | 5/1 |
| IND5672 | 32 |

|
285.3 | 0.53 ± 0.04 | 6 | 59.2 | 3.68 | 3/1 | |
Physicochemical parameters included MW = molecular weight; TPSA = topological polar surface area relating to N and O atoms (TPSA_NO); xlogP = lipophilicity coefficient; HBA = H-bond acceptor; and HBD = H-bond donor, calculated in Vortex v2011, Dotmatics Limited.
Mean ELISA EC50 values based on n ≥ 3. Twenty-nine compounds were also tested in N2a-cl3 cells, three of which showed good potency, noted in parentheses.
Figure 3.
Dose-response curves for potency (EC50 by ELISA; filled circles) and cell viability (LC50 by calcein assay; open circles) for two potent confirmed SPC hits in T98G cells from each of three representative scaffolds: amide (A and B), aminothiazole (C and D), and chromene (E and F). Percentages were normalized to the maximal absorbance measured at the highest concentration tested. See Table 3 for exact EC50 values.
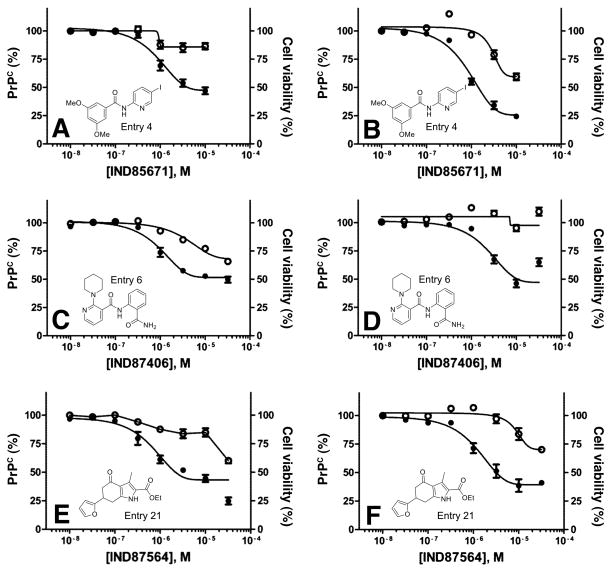
Twenty-nine of the 32 SPC hits that had good to excellent potency in T98G cells were also tested in neuroblastoma cells that overexpress PrPC, denoted N2a-cl3 cells. Three compounds showed good potency and minimal effect on cell viability in N2a-cl3 cells (Fig. 4B, D, F), in comparison with results in T98G cells (Fig. 4A, C, E).
Figure 4.
Dose-response curves for potency (EC50 by ELISA; filled circles) and cell viability (LC50 by calcein assay; open circles) for IND85671, IND87406, and IND87564, three potent confirmed SPC hits, in T98G (A, C, E) and N2a-cl3 (B, D, F) cells. Percentages were normalized to the maximal absorbance measured at the highest concentration tested. See Table 3 for exact EC50 values.
3.3 SAR studies
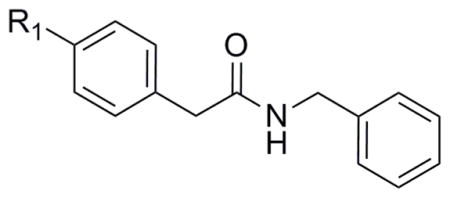
From SAR analysis of SPC hits in PrPC assays using T98G cells, 7 scaffolds representing amides, AMTs, chromenes, indoles or fused indoles, sulfonamides, piperazines, and ureas were initially found. Five scaffolds—amide, AMT, chromene, indole or fused indole, and sulfonamide—were hits for both IMR32 and T98G cells. For the T98G cell line, we identified and confirmed active analogs from the amide, AMT, chromene, sulfonamide, and piperazine scaffolds. In addition, we also found and confirmed several active analogs from a fused pyrrole scaffold, which has some structural resemblance to the fused indole scaffold. Preliminary SAR trends became apparent for some of the scaffolds, such as the benzyl amide series where several analogs were purchased and tested along with the original SPC hit IND61769 (Table 4). When the substitution required at the para-position of the benzene ring was probed, we found that a bigger phenyl group (IND116065) was 5-fold more potent than the bromo analog (IND61769). Upon replacing the bromine atom with a smaller chlorine, the resulting analog (IND126416) was inactive at concentrations up to 10 μM. Substituting a methoxy group, which has a size similar to that of the bromo atom, produced an analog (IND6612) with potency similar to that exhibited by the bromo analog in reducing PrPC levels in T98G cells.
Table 4.
Preliminary SAR evaluating EC50 values by ELISA and LC50 values by calcein for selected amide analogs that lower levels of PrPC in T98G cells.
| ||||
|---|---|---|---|---|
| Compound | R1 | EC50 ± SEM (μM) | LC50 (μM) | Replicates (n) |
| IND61769 |

|
2.33 ± 0.30 | >10 | 4 |
| IND6612 |
|
3.13 ± 0.35 | >10 | 3 |
| IND126416 |

|
>10 | >10 | 3 |
| IND116065 |

|
0.44 ± 0.11 | >10 | 6 |
3.4 Reduction of PrPC expression by siRNA knockdown
PrPC was measured on the surface of T98G cells by ELISA and confocal fluorescence microscopy after treatment with scrambled or PRNP siRNA. In T98G cells treated with PRNP siRNA for 2 days, PrPC expression was reduced by approximately 80% (Fig. 5), which is consistent with previously published results (14, 15). In comparison, treatment with scrambled siRNA produced no significant knockdown in PrPC expression.
Figure 5.
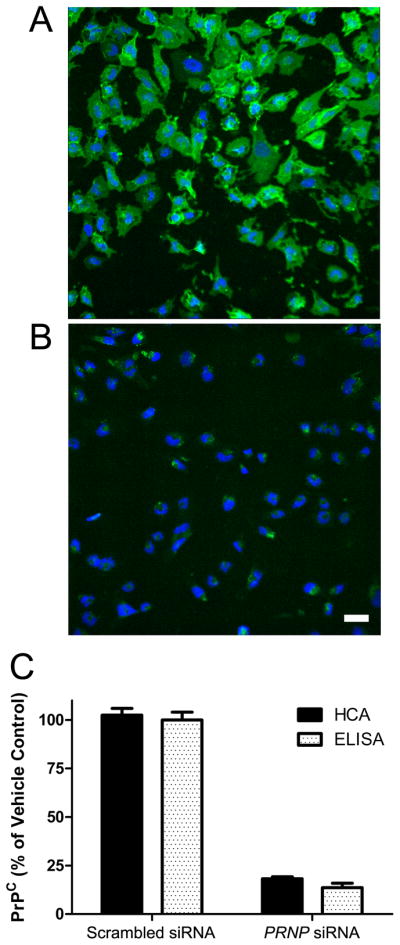
PrPC expression on the surface of T98G glioblastoma cells after 2 d of treatment with scrambled siRNA (A) or 25 nM PRNP siRNA (B), and quantified (C) by high content analysis (HCA, solid bars) and ELISA (open bars). In B, scale bar represents 50 μm and also applies to A. In A and B, PrP is stained with anti-PrP antibody (green) and cell nuclei stained with DAPI (blue). In C, data were normalized to scrambled siRNA control. Bars represent mean ± standard error of the mean from three independent experiments.
3.5 Pharmacokinetics, brain distribution, and microsomal stability
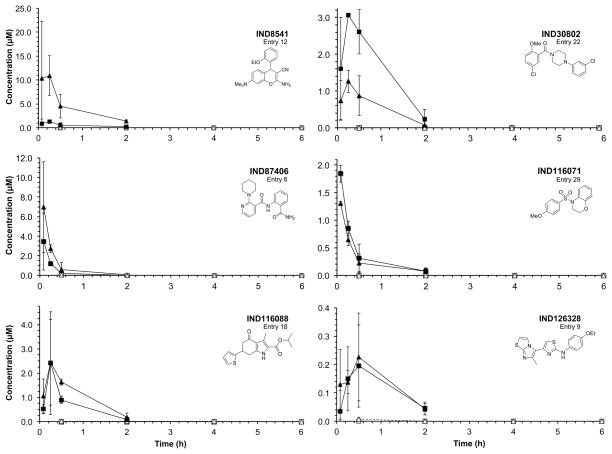
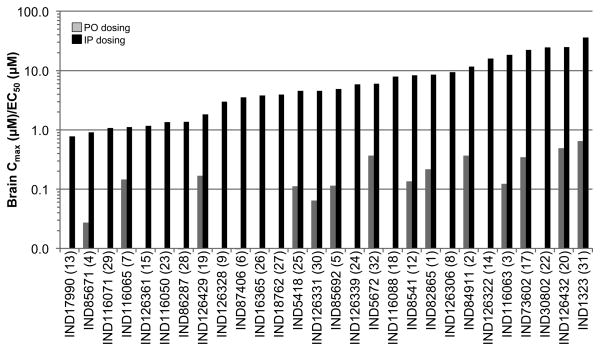
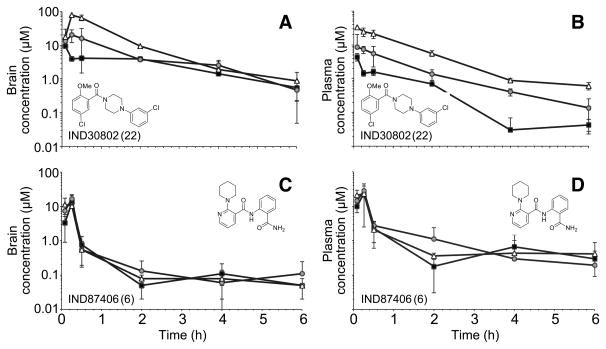
Twenty-eight of the 32 compounds that showed good potency in ELISA (EC50 = 0.03–4.1 μM) and minimal effect on cell viability (LC50 > 10 μM) in T98G cells were available for purchase for pharmacokinetic testing in vivo. All 28 were dosed by oral gavage (PO) and by intraperitoneal (IP) injection at 10 mg/kg in female CD-1 mice, and then brain and plasma concentrations measured at various time points after dosing. Results showed that plasma and brain concentrations were barely or not measurable (Cmax ≪ 0.1 μM) by liquid chromatography-mass spectrometry (LC/MS) after PO dosing, but were high (Cmax up to 16.2 μM) after IP dosing. Brain and plasma concentrations at each timepoint are shown for 6 compounds representing 6 scaffolds (Fig. 6). The ratios of the Cmax values measured in brain to the EC50 values (Cmax:EC50) are shown for all 28 compounds (Fig. 7). Brain and plasma concentrations were also determined for two potent compounds (IND30802 and IND87406) after 20, 50, and 100 mg/kg/day dosed IP once a day (QD) to ensure that exposure could be maintained after repeated dosing. Brain and plasma concentrations were measured different time points (0–6 h) after the last dose on the 3rd day. Both compounds were well tolerated, and IND30802 resulted in high concentrations in the brain (100× the EC50 value determined by ELISA) for at least 6 h (Fig. 8) at the doses studied.
Figure 6.
Concentrations in brain (squares) and plasma (triangles) after a single 10 mg/kg IP dose (filled symbols) or after a single 10 mg/kg PO dose (open symbols) for 6 confirmed hits, as indicated, each representing a unique chemical scaffold.
Figure 7.
Ratios of Cmax to the EC50 value for 28 confirmed SPC hits. Cmax values were measured in the brain after a single dose of 10 mg/kg administered PO (gray) or IP (black). For 14 of 28 hits, ratios could not be calculated because Cmax values after PO dosing were below the lower level of quantification. The number in parentheses following the compound name refers to the corresponding entry number in Table 3.
Figure 8.
Brain (A, C) and plasma (B, D) concentrations of IND30802 (top) and and IND87406 (bottom) measured at the time points shown, after three days of IP dosing at 20 (black squares), 50 (gray circles), and 100 (white triangles) mg/kg QD.
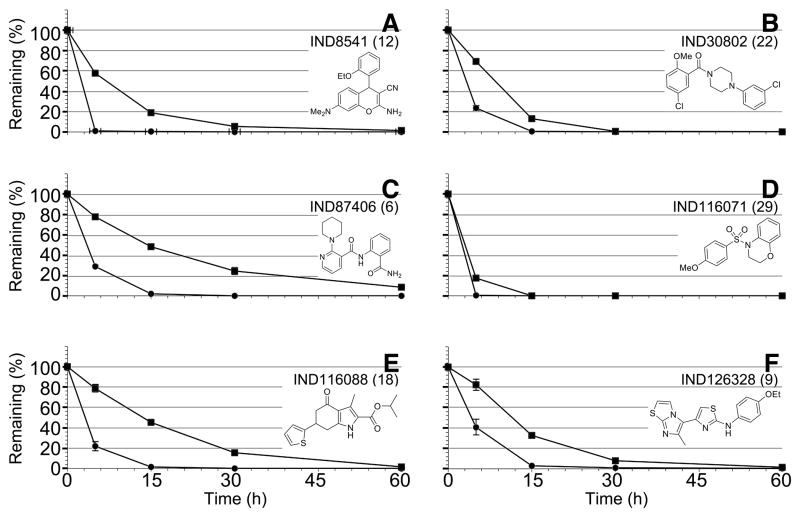
Eight of 28 compounds were also tested for stability in mouse and human hepatic microsomes (Table 5) with decay curves shown for one representative compound from each of the 6 chemical scaffolds (Fig. 9). Results show that most of the compounds were rapidly cleared in mouse and human liver microsomes.
Table 5.
Stability of 8 confirmed SPC hits tested in EC50 assays, representing 6 scaffolds, in mouse and human liver microsomes.
| Compound | # | Structure | t1/2 in min (% remaining after 60-min incubation) | |
|---|---|---|---|---|
| Mouse | Human | |||
| IND8541 | 12 |

|
1.9 (0.1) | 9.7 (1.3) |
| IND30802 | 22 |

|
3.0 (0.1) | 6.0 (0.1) |
| IND87406 | 6 |

|
2.8 (0.0) | 16.7 (8.3) |
| IND116065 | 7 |

|
18.5 (5.8) | 10.3 (4.6) |
| IND116071 | 29 |

|
0.7 (0) | 2.0 (0) |
| IND116088 | 18 |

|
3.2 (0.1) | 9.9 (1.6) |
| IND126328 | 9 |

|
4.5 (0.5) | 9.6 (1.5) |
| IND126339 | 24 |

|
1.6 (0.0) | 4.5 (1.0) |
Figure 9.
Metabolic stability of 6 confirmed hits, representing 6 chemical scaffolds, in mouse (circles) and human (squares) liver microsomes.
4. DISCUSSION
In studies designed to identify small molecules that reduce PrPC in cultured cells, we identified 138 SPC hits in T98G cells and 114 SPC hits in IMR32 cells. Dose-response curves were performed, and 23 hits in T98G cells showed excellent potency, with EC50 values < 1 μM, whereas none of the SPC hits from IMR32 cells were active without also adversely affecting cell viability. It is not clear why some analogs selectively reduced PrPC levels in T98G but not in IMR32 cells. Whether differences in the viability of IMR32 and T98G cells explain the differences in PrPC reduction for the two cell lines in response to some of the chemical compounds remains to be determined.
In pharmacokinetic studies in vivo, all compounds showed barely detectable brain and plasma concentrations with PO dosing. To understand the poor oral bioavailability, these compounds were dosed IP and subjected to in vitro, hepatic microsomal stability studies. Data from these experiments (Figures 6 and 9, Table 5), although not direct evidence, suggest that the poor oral exposure may be due to poor gut absorption and/or rapid P450-mediated metabolism.
siRNA treatment of T98G cells reduced PrPC expression by ~80% as measured by confocal microscopy and by ELISA. While higher reductions were not found, this is typical of siRNA knockdowns in cultured cells. The confocal microscopy studies demonstrate (Figure 5B) that essentially all of the cells were transfected with the siRNA and that the remaining PrPC expression is not due to 20% of the cells escaping the effects of the siRNA. Because all the cells showed a substantial reduction in PrPC, this also eliminates the possibility that during cell division, which was not arrested in T98G cells, the siRNA was distributed asymmetrically and some daughter cells expressed PrPC at high levels.
5. CONCLUSION
In the studies reported here, we used ELISAs to measure PrPC levels in cell-based assays for primary HTS and confirmatory assays to identify compounds that reduce PrPC on the cell surface with minimal effect on cell viability. In future studies, we intend to measure PrPC both inside and on the surface of cells using confocal microscopy as shown in Figure 5. Such measurements may enhance our screening capabilities and identify more potent lead compounds. These findings will guide the future research in identifying potent compounds that lower PrPC levels, including which chemical scaffolds are more promising and what kind of structural modifications will make compounds more potent. Currently, amide, fused pyrrole, and piperazine scaffolds are promising leads for follow-up investigations. Furthermore, specific modifications in amides that increased or decreased potency (Table 4) may also be applied or avoided for other lead scaffolds.
Supplementary Material
Acknowledgments
This work was supported by grants from the National Institutes of Health (AG002132, AG10770, and AG021601) as well as by gifts from the Sherman Fairchild, Larry F. Hillblom, Lincy, and Michael Homer Foundations. J.J.I. was supported by National Institutes of Health (AG002132 support to Brian Shoichet: PI, Project 4). The authors thank Ms. Alejandra Acevedo, Ms. Josephine Lau, and Ms. Darlene Groth for their contributions to the HTS assays; Mr. Phillip Benner for animal dosing and sample collection in pharmacokinetic studies; Ms. Ana Serban, Ms. Julia Becker, and Mr. Frederic Letessier for D13 and D18 antibodies; the staff of the Hunter’s Point animal facility for expert animal studies; Mr. Joseph Mulvaney of the SMDC for early discussions involving evaluation and selection of compounds for HTS; Dr. Jeffrey Neitz of the SMDC for performing the property predictions in Vortex; Dr. Christian Laggner for helpful suggestions regarding purchased analogs for SAR; Drs. Sina Ghaemmaghami and Robert Wilhelm for many helpful discussions; and Ms. Hang Nguyen for editorial assistance. We are grateful to Daylight for the use of their fingerprint toolkit (www.daylight.com) and to Molinspiration for a license to use their mib software (www.molinspiration.com). M.J.P. is a consultant to Schrödinger, LLC.
Abbreviations
- IP
intraperitoneal
- PO
per os (oral)
- PrPC
cellular prion protein
- PrPSc
disease-causing prion protein isoform
- SPC
single point confirmation
Footnotes
Publisher's Disclaimer: This is a PDF file of an unedited manuscript that has been accepted for publication. As a service to our customers we are providing this early version of the manuscript. The manuscript will undergo copyediting, typesetting, and review of the resulting proof before it is published in its final citable form. Please note that during the production process errors may be discovered which could affect the content, and all legal disclaimers that apply to the journal pertain.
REFERENCES AND NOTES
- 1.Büeler H, Aguzzi A, Sailer A, Greiner R-A, Autenried P, Aguet M, et al. Mice devoid of PrP are resistant to scrapie. Cell. 1993;73:1339–47. doi: 10.1016/0092-8674(93)90360-3. [DOI] [PubMed] [Google Scholar]
- 2.Prusiner SB, Groth D, Serban A, Koehler R, Foster D, Torchia M, et al. Ablation of the prion protein (PrP) gene in mice prevents scrapie and facilitates production of anti-PrP antibodies. Proc Natl Acad Sci USA. 1993;90:10608–12. doi: 10.1073/pnas.90.22.10608. [DOI] [PMC free article] [PubMed] [Google Scholar]
- 3.Bosque PJ, Prusiner SB. Cultured cell sublines highly susceptible to prion infection. J Virol. 2000;74:4377–86. doi: 10.1128/jvi.74.9.4377-4386.2000. [DOI] [PMC free article] [PubMed] [Google Scholar]
- 4.Mallucci G, Dickinson A, Linehan J, Klohn PC, Brandner S, Collinge J. Depleting neuronal PrP in prion infection prevents disease and reverses spongiosis. Science. 2003;302:871–4. doi: 10.1126/science.1090187. [DOI] [PubMed] [Google Scholar]
- 5.Safar JG, DeArmond SJ, Kociuba K, Deering C, Didorenko S, Bouzamondo-Bernstein E, et al. Prion clearance in bigenic mice. J Gen Virol. 2005;86:2913–23. doi: 10.1099/vir.0.80947-0. [DOI] [PubMed] [Google Scholar]
- 6.Büeler H, Fisher M, Lang Y, Bluethmann H, Lipp H-P, DeArmond SJ, et al. Normal development and behaviour of mice lacking the neuronal cell-surface PrP protein. Nature. 1992;356:577–82. doi: 10.1038/356577a0. [DOI] [PubMed] [Google Scholar]
- 7.Williamson RA, Peretz D, Pinilla C, Ball H, Bastidas RB, Rozenshteyn R, et al. Mapping the prion protein using recombinant antibodies. J Virol. 1998;72:9413–8. doi: 10.1128/jvi.72.11.9413-9418.1998. [DOI] [PMC free article] [PubMed] [Google Scholar]
- 8.Keiser MJ, Roth BL, Armbruster BN, Ernsberger P, Irwin JJ, Shoichet BK. Relating protein pharmacology by ligand chemistry. Nat Biotechnol. 2007;25:197–206. doi: 10.1038/nbt1284. [DOI] [PubMed] [Google Scholar]
- 9.Gaulton A, Bellis LJ, Bento AP, Chambers J, Davies M, Hersey A, et al. ChEMBL: a large-scale bioactivity database for drug discovery. Nucleic Acids Res. 2012;40:D1100–D7. doi: 10.1093/nar/gkr777. [DOI] [PMC free article] [PubMed] [Google Scholar]
- 10.Obach RS. Prediction of human clearance of twenty-nine drugs from hepatic microsomal intrinsic clearance data: An examination of in vitro half-life approach and nonspecific binding to microsomes. Drug Metab Dispos. 1999;27:1350–9. [PubMed] [Google Scholar]
- 11.Marquardt DW. An algorithm for least-squares estimation of nonlinear parameters. J Soc Indust Appl Math. 1963;11:431–41. [Google Scholar]
- 12.Zhang JH, Chung TD, Oldenburg KR. A simple statistical parameter for use in evaluation and validation of high throughput screening assays. J Biomol Screen. 1999;4:67–73. doi: 10.1177/108705719900400206. [DOI] [PubMed] [Google Scholar]
- 13.Li Z, Rao S, Gever JR, Widjaja K, Prusiner SB, Silber BM. Towards optimization of arylamides as novel, potent, and brain-penetrant antiprion lead compounds. ACS Med Chem Lett. 2013;4:647–50. doi: 10.1021/ml300454k. [DOI] [PMC free article] [PubMed] [Google Scholar]
- 14.Kim Y, Han B, Titlow W, Mays CE, Kwon M, Ryou C. Utility of RNAi-mediated prnp gene silencing in neuroblastoma cells permanently infected by prions: potentials and limitations. Antiviral Res. 2009;84:185–93. doi: 10.1016/j.antiviral.2009.09.002. [DOI] [PubMed] [Google Scholar]
- 15.Kang SG, Roh YM, Lau A, Westaway D, McKenzie D, Aiken J, et al. Establishment and characterization of Prnp knockdown neuroblastoma cells using dual microRNA-mediated RNA interference. Prion. 2011;5:93–102. doi: 10.4161/pri.5.2.15621. [DOI] [PMC free article] [PubMed] [Google Scholar]
Associated Data
This section collects any data citations, data availability statements, or supplementary materials included in this article.


