

Abstract
During prion diseases, a normally benign, host protein, denoted PrPC, undergoes alternative folding into the aberrant isoform, PrPSc. We used ELISA assays to identify and confirm hits in order to develop leads that reduce PrPSc in prion-infected dividing and stationary-phase mouse neuroblastoma (ScN2a-cl3) cells. We tested 52,830 diverse small molecules in dividing cells and 49,430 in stationary-phase cells. This led to 3,100 HTS and 970 single point confirmed (SPC) hits in dividing cells, 331 HTS and 55 confirmed SPC hits in stationary-phase cells as well as 36 confirmed SPC hits active in both. Fourteen chemical leads were identified from confirmed SPC hits in dividing cells and three in stationary-phase cells. From more than 682 compounds tested in concentration-effect relationships in dividing cells to determine potency (EC50), 102 had EC50 values between 1–10 µM and 50 had EC50 values of <1 µM; none affected cell viability. We observed an excellent correlation between EC50 values determined by ELISA and Western immunoblotting for 28 representative compounds in dividing cells (R2 = 0.75; p < 0.0001). Of the 55 confirmed SPC hits in stationary-phase cells, 23 were piperazine, indole, or urea leads. The potency (EC50) of one indole in stationary-phase and dividing ScN2a-cl3 cells was 7.5 and 1.6 µM, respectively. Unexpectedly, the number of hits in stationary-phase cells was ~10% of that in dividing cells. The explanation for this difference remains to be determined.
Keywords: Antiprion compounds, PrPSc, dividing and stationary-phase brain cells
1. INTRODUCTION
A growing body of evidence argues that different proteins can assemble into prions and cause distinct neurodegenerative disorders1–3. In the uniformly fatal diseases caused by the prion protein (PrP), prions are formed when the cellular prion protein (PrPC) is refolded into an alternative isoform designated PrPSc 4, 5. The accumulation of PrPSc, which is β-sheet–rich, causes CNS dysfunction.
The PrP prion diseases can present as sporadic, inherited and infectious disorders. Epidemiological studies argue that the majority of Creutzfeldt-Jakob disease (CJD) cases are sporadic, which seem to occur spontaneously through a stochastic process6. The dominantly inherited PrP diseases are caused by mutations in the PrP gene, resulting in amino acid substitutions or expansion of the octarepeat region7–9. Mutations in PrP appear to lower the energy barrier for spontaneous PrPSc formation, and if mutation carriers live long enough, they will all die of familial CJD10, 11. Alternatively, prions can be transmitted from one person to another, as in the case of kuru in New Guinea natives or iatrogenic CJD due cadaveric human growth hormone12, 13. Transmission of BSE, CWD and scrapie prions among animals and BSE to humans is well described14–19.
Prion diseases are rapidly progressive and invariably fatal in humans and animals, and no effective treatments are available. Discovery of new small molecule–based therapies has relied on testing in dividing cultured cell lines that propagate prions as well as in animal models infected with prions. Because the brain is composed of post-mitotic cells, we decided to undertake high-throughput screening (HTS) using stationary-phase and dividing cells. Only several cell lines support prion replication, the most well-studied of which are from mice; these include the N2a, GT1, PK1, CAD5 and LD9 mouse cell lines20–22. PK1 cells are a subclone of N2a cells; the LD9 line is a subclone of L929 cells. The most permissive mouse-passaged prion strain seems to be RML that was derived from sheep prions23.
One therapeutic target for prion disease is to lower levels of PrPSc, which can be accomplished by decreasing its formation, increasing its clearance, or some combination of both. Many antiprion compounds have been discovered using lowthroughput screening of small sets of known drugs approved for other indications, or small chemical sets, most frequently using RML- or ME7-infected N2a or GT1 cells that are dividing24–27. The drugs and compounds discovered to date include many chemical leads, including acridines (e.g., quinacrine and structurally related tricyclic antidepressants)28–30; analogues of quinacrine31, 32; statins33; pyrazolones34; indole-3-glyoxylamides35, 36 and pyridyl hydrazones37, 38, including “Compound B”. In addition, larger polyanionic or polycationic molecules (e.g., dendritic polyamines of PAMAM) have been reported to exhibit antiprion activity in cells39, 40. It is unlikely that such species could be used therapeutically because they are likely to suffer from poor oral absorption, low blood-brain-barrier (BBB) penetration, and high toxicity.
Except for PAMAM, none of the approved drugs or experimental compounds has been reported to lower levels of PrPSc in stationary-phase cells. PAMAM is active in both dividing and stationary-phase cells41. Whereas Compound B is active in dividing cells, its effects in stationary-phase cells have not been reported, yet it significantly extended survival in RML prion-infected mice, in a strain-dependent manner37. The hypothesis positing that an effective drug needs to be active in stationary-phase cells for it to extend survival in vivo has not been tested. It has, however, been proposed that quinacrine failed in vivo, not only because of its lack of activity in stationary-phase cells, but also because of the rapid development or selection of drug-resistant prion strains upon chronic dosing41.
To identify new hits and confirm chemical leads, we developed ELISA-based assays for both in dividing and stationary-phase cells, and screened ~53,000 compounds by HTS in each. We identified HTS hits and retested them in single point confirmation (SPC), which includes an assessment of cell viability. In dividing cells, confirmed SPC hits represented 14 chemical leads. Concentration-effect relationships (EC50) performed on these confirmed SPC hits and related analogs in dividing cells yielded 50 with EC50 values < 1 µM and 102 between 1–10 µM. Sixteen of 28 confirmed SPC hits in both ELISA and Western immunoblots were dosed orally at 10 mg/kg, and four showed good oral absorption and exposure in the brain. In comparison to the hits and leads identified in dividing cells, we identified and confirmed only 10% as many HTS hits in the stationary-phase cells. Of the 55 confirmed SPC hits in stationary-phase cells, 23 were piperazine, indole, or urea leads. Of the confirmed SPC hits, 36 were identified in both dividing and stationary-phase cells. Only one indole (IND 23308) had low micromolar potency in both stationary-phase and dividing cells (EC50 = 7.5 and 1.6 µM, respectively) with no effect on cell viability.
We also tested 1,420 FDA-approved drugs in the dividing and stationary-phase assays. In dividing cells, we identified 130 HTS hits, 15 of which were confirmed SPC hits. In stationary-phase cells, we identified 6 HTS hits, none of which were confirmed by SPC. When the 15 confirmed SPC hits in dividing cells were tested for concentration-effect relationships, two (dextran and Congo red) had good potency and no effects on cell viability; however, neither crosses the BBB and therefore unsuitable as a therapy. Of the remaining 15 tested, four had weak antiprion potency and no effects on cell viability, three had weak antiprion potency and little effect on cell viability, two had moderate antiprion potency but affected cell viability, and four were completely inactive.
The confirmed hits and leads identified in dividing cells and stationary-phase cells will drive structure-activity relationship (SAR) studies, which may increase the chances of discovering molecules that can lower levels of PrPSc in prion-infected cell and animal models.
2. MATERIALS AND METHODS
2.1 Materials
Minimum essential medium (MEM), Geneticin, Dulbecco’s phosphate-buffered saline (PBS), Tris HCl, proteinase K, glycerol, SDS sample buffer and calcein-AM were purchased from Invitrogen (Carlsbad, CA); fetal bovine serum (FBS) from Thermo Scientific Hyclone (Rockford, IL); penicillin and streptomycin from Cellgro (Manassas, VA); Cell Dissociation Buffer from Millipore (Billerica, MA); NaCl, ABTS peroxidase substrate and ABTS stop solution from Fisher Chemical (Houston, TX); ethyl alcohol from Gold Shield Chemical Co. (Hayward, CA); benzonase from EMD chemicals (Gibbstown, NJ); phenylmethylsulfonyl fluoride (PMSF) from MP Biomedicals (Solon, OH); and guanidine isothiocyanate from RPI (Mt. Prospect, IL). D18 and D13 antibodies were obtained as previously described42. All other compounds and reagents were purchased from Sigma (St. Louis, MI) unless otherwise specified below.
Dose formulations for in vivo pharmacokinetic studies contained propylene glycol (Sigma-Aldrich, St. Louis, MO), absolute ethanol (Fisher Scientific, Pittsburg, PA), labrosol (Gattefosse, France), and polyethylene glycol 400 (PEG400, Hampton Research, Aliso Viejo, CA). Brain tissue was homogenized using a Precellys 24 (Bertin Technologies, France) tissue homogenizer. LC/MS/MS analysis was performed using an API 4000 triple quadruple mass spectrometer (Applied Biosystems) with Analyst 1.4.2 software, coupled to a Shimadzu CBM-20A controller, LC20AD pumps, and SIL-5000 auto sampler (Shimadzu Scientific, Columbia, MD). Compounds were separated on a Gemini C18, 3 µm, 50 × 2 mm column (Phenomenex, Torrance, CA) using a gradient between 0.1% formic acid in water and 0.1% formic acid in acetonitrile.
2.2 Chemical library
Of the 52,830 compounds tested in dividing cells, 22,703 were obtained from ChemBridge and 30,127 from SPECS. Of 49,430 compounds tested in stationary-phase cells, 19,327 were obtained from ChemBridge and 30,103 from SPECS. Both ChemBridge and SPECS libraries were available at the Small Molecule Discovery Center (SMDC) at the University of California, San Francisco. These libraries represent a diversity set from among a larger set curated by the SMDC, where we had access to a total of ~180,000 compounds. Primary HTS hits from all libraries were first confirmed by SPC, using the original screening stocks. Further evaluation of confirmed hits using dose-titration curves (EC50) was accomplished using fresh powders purchased from the corresponding vendor. For SAR expansion, analogs of validated lead compounds were acquired from various vendors, including Albany Molecular Research, ASDI, ASINEX, Chemical Block, ChemBridge, ChemDiv, Enamine, IBScreen, InterBioScreen, Intermed Ltd., Key Organics, Life Chemicals, Maybridge, NanoSyn, Otava, Peakdale Molecular (Ryan Scientific), Princeton BioMolecular Research, Scientific Exchange, Sigma-Aldrich, SPECS, TCI North America, TimTec, and Vitas M Labs. In addition, 1,420 FDA-approved human drugs were available as plated compounds and purchased directly from the Johns Hopkins University, through a material transfer agreement.
2.3 Compound selection
To decide which compounds available at the SMDC would be most useful to screen in the PrPSc assays, we sought to develop a metric that prioritized compounds that were more likely to hit and not narrowly focused in a congeneric series. We assessed the compounds using two metrics: predicted bioactivity and mutual dissimilarity. One point was assigned for each compound that had at least one prediction of bioactivity using SEA based on ChEMBL release 01 and using an E-value cutoff of 10−10 (http://www.ncbi.nlm.nih.gov/pubmed/21948594). To calculate dissimilarity, we used a modified version of the method of Voigt, Bienfait, Wang and Nicklaus43 (http://cactus.nci.nih.gov/subset/). For each plate, we sorted the molecules by ascending molecular weight and scored one point for any molecule that differed from all previously accepted compounds by a Tanimoto coefficient (Tc) of ≥0.7, based on default Daylight fingerprints. The combined score (bioactivity + dissimilarity) was used to compute a combined figure of merit for each plate, which was used to rank them, and from which we selected ~53,000 compounds for HTS analysis.
2.4 Antiprion activity and cellular toxicity assays
Mouse N2a neuroblastoma cells (ATCC) were transfected with full-length mouse PrP and infected with the Rocky Mountain Laboratory (RML) strain of mouse-adapted scrapie prions, yielding ScN2a-cl3 cells44. ScN2a-cl3 cells were maintained in tissue culture flasks (175 cm2) containing 32 mL of filter-sterilized (0.2 µm) MEM with Earle’s salts and L-glutamine, supplemented with 10% FBS, 250 µg/mL Geneticin, 50 I.U./mL penicillin, and 50 µg/mL streptomycin (supplemented MEM) in a humidified and CO2-enriched (5%) environment at 37 °C. On day 1, the growth medium (supplemented MEM) was aspirated from the flasks, the cells were washed twice with 10 mL of calcium- and magnesium-free Dulbecco’s PBS, and then detached by addition of 3 mL of cell dissociation buffer (Millipore #S-014-B) after incubation at room temperature (RT) for 5 min. The dissociation buffer was aspirated and the cells suspended in 10 mL of growth medium before counting using a Cellometer Auto T4 (Nexcelom Biosciences; Lawrence, MA). ScN2a-cl3 cells were seeded either into new, 175-cm2 tissue culture flasks for continued cell culture (9 × 10⁶ cells into 32 mL growth medium) or onto 96-well, tissue culture–treated, white polystyrene plates (Greiner Bio-One; Monroe, NC) for treatment with test compounds (40,000 cells/well in 100 µL of growth medium for dividing ScN2a cells; 150,000 cells/well in 80 µL of growth medium for stationary-phase ScN2a cells). Stationary-phase ScN2a-cl3 cells were allowed to adhere for 1 h at 37 °C before cell division arrest was induced by addition of 20 µL of 35 mM sodium butyrate in growth medium (7 mM final concentration) and the plates incubated for 24 h prior to compound addition. Dividing ScN2a-cl3 cells were allowed to adhere for 4 h at 37 °C before compound addition. Test compounds (100 µL) were added to each well to attain a final concentration of 10 µM. Three positive controls were used: simvastatin, quinacrine, and PAMAM-G4. Simvastatin and quinacrine (10 mM in 100% DMSO) were added, then diluted to a final concentration of 10 µM in growth medium (0.1% DMSO, final concentration). PAMAM-G4 was diluted from a 1% stock solution (in MeOH) to achieve a final concentration of 10 µg/mL. As a negative control, 0.1% DMSO in growth medium was used. Media was aspirated on day 5, and cells were washed with PBS (250 µL/well) and aspirated dry. The cells were lysed by addition of 20 µL of lysis buffer (10 mM Tris HCl, 150 mM NaCl, 0.5% sodium deoxycholate, 0.5% NP-40) containing 7.5 U/mL benzonase; plates were placed on a shaker at 37 °C for 1 h. Proteinase K [PK; 5 µL of 125 µg/mL in a Tris buffer (10 mM Tris HCl, 20 mM calcium chloride, 50% glycerol)] was added and incubated at 37 °C for 1 h, with shaking. PK digestion was stopped by addition of 5 µL of cold (4 °C) 20 mM PMSF in ethanol. After 10 min at RT, 10 µL of 5 M guanidine isothiocyanate was added at 37 °C for 1 h (with shaking) to denature the protein. The lysate in each well was diluted with 120 µL of PBS, and 150 µL from each well transferred to 96-well polystyrene ELISA plates previously coated with D18 antibody (5 µg/mL/well in 300 µL of acidified PBS overnight at RT in a humidified chamber45), the plates sealed, and incubated overnight at 5 °C. The next day, the plates were washed 3 times with TBST buffer (20 mM Tris HCl, 137 mM NaCl, 0.05% Tween-20, pH 7.5), the contents of each well aspirated completely. Then 100 µL of a 1:1000 dilution of HRP-conjugated D13 antibody was added and incubated at 37 °C for 1 h. The plates were washed 4 times with TBST buffer, the contents aspirated completely, and 100 µL of ABTS peroxidase substrate added to each well. After 15 min of development at RT, the enzymatic reaction was stopped by addition of 100 µL of ABTS stop solution and the plates immediately loaded onto a SpectraMax M5 plate reader (Molecular Devices; Sunnyvale, CA) for measurement of absorbance at 405 nm.
For cell viability assays, mouse N2a-cl3 cells were seeded into 96-well, black polystyrene plates (Greiner) and treated with compound as described above for the ELISA plates. After 5 days, the growth media was aspirated, the plates washed once with PBS (250 µL/well), and the plates aspirated dry. Calcein-AM (100 µL/well, 5 µg/mL solution in calcium- and magnesium-free PBS) was added, and the plates were incubated at 37 °C for 45 min. Fluorescent emission intensity was quantified using a Spectramax M5 plate reader, excitation/emission spectra of 485 nm/530 nm.
2.5 Western blot analysis of ScN2a-cl3 cells
ScN2a-cl3 cells, cultured as described above, were seeded onto 6-well, tissue culture–treated dishes at a density of 1.54 × 10⁶ cells/well in 6.2 mL of supplemented MEM and allowed to adhere for 4 h at 37 °C. Test compounds diluted in supplemented MEM (described above) were added to the plate (0.8 mL/well) to attain final concentrations ranging from 1 nM to 32 µM. After 5 days, the media was aspirated from each well and the plates washed one time with PBS (7 mL/well). The cells were lysed by addition of 0.35 mL of lysis buffer (20 mM Tris HCl, pH 8.0; 100 mM NaCl; 0.5% NP-40; 0.5% sodium deoxycholate; and 7.5 U/mL benzonase). The total protein in the lysate was measured using a bicinchoninic protein assay (Pierce). A total of 0.06 mg protein was treated with PK (total protein:enzyme ratio = 50:1) in 0.1 mL PBS and the sample incubated at 37 °C for 1 h. The proteolytic digestion was terminated by the addition of PMSF to a final concentration of 3 mM. The samples were centrifuged at 16,000 × g for 1 h, the supernatant discarded, and the pellets resuspended in 15 µL of reducing SDS sample buffer. The PrPSc-containing samples were denatured by heating at 80 °C for 5 min and run in a 4–12% Tris glycine SDS gel (Invitrogen). The gels were transferred to nitrocellulose membrane using a Nupage apparatus (Invitrogen) and the membranes blocked with 5% (w/v) nonfat milk/TBST overnight. The membranes were immersed for 1 h at RT in a 1:10,000 dilution of D13 antibody (1 mg/mL) conjugated to horseradish peroxidase (HRP), washed 3 times with TBST buffer before development (1 min) with Enhanced Chemiluminescent Western Blot reagent (GE Healthcare). Imaging and quantification of the blots were done using a GeneGnome (Syngene) equipped with Gene Tools software.
To quantify actin, 200 µg of total protein from lysate was diluted 1:5 with cold ethanol and incubated overnight at −20 °C. The next day, the sample was centrifuged for 60 min at 16,000 × g, the protein pellet dried and dissolved in Nupage loading buffer. The sample was loaded onto a 4–12% BisTris gel system (Invitrogen), transferred to a nitrocellulose membrane, and blocked with 5% (w/v) nonfat milk/TBST for 30 min at RT. The membranes were immersed in a 1:10,000 dilution of rabbit anti-actin polyclonal antibody (Sigma) in 5% (w/v) nonfat milk/TBST for 1 h, and then washed three times with TBST buffer. The membranes were then incubated with a 1:10,000 dilution of goat anti-rabbit HRP-conjugated secondary antibody (Biorad) in 5% (w/v) nonfat milk/TBST for 1 h, washed three times with TBST buffer, and developed with Enhanced Chemiluminescent Western Blot reagent. Imaging and quantification were performed as described above.
2.6 Data analysis
Absorbance (PrPSc ELISA) and fluorescence (calcein cell viability) data were exported from the plate readers as text files and normalized either to positive controls (PAMAM-G4 for PrPSc, quinacrine for calcein). Data were processed and stored in a Collaborative Drug Discovery (CDD) web-based database (www.collaborativedrug.com). Inhibition curves were generated using nonlinear regression employing the Levenberg Marquardt algorithm programmed into the CDD database46. Search results were exported to Excel as structure data files (SDF) or comma-separated values (CSV) files for further data manipulation and SAR analysis.
2.7 Analyzing assay performance
Z′ (dividing cell assay) and Z score (stationary-phase cell assay) to assess the precision, accuracy, and robustness were calculated using the following equation47:
Z′ = 1 − [3(s.d.pos. control + s.d.neg. control)]/|meanpos. control – meanneg. control|
Z = 1 − [3(s.d.background + s.d.neg. control)]/|meanbackground– meanneg. control|,
where the positive control is 10 µg/mL PAMAM-G4 and the negative control is 0.1% DMSO in growth medium. In the case of the stationary-phase ScN2a-cl3 ELISA, since no purified protein was available, the background level was set to the same level as the positive control in the dividing ScN2a-cl3 ELISA.
2.8 Structure-activity relationships
SAR analyses were performed using SARvision (Altoris Inc.), permitting the visualization, mining, and organization of chemical data. Chemical structure and biological assay data were combined in SDF files. SARvision was used to generate a list of lead(s) and organize them into hierarchical tree structures using the IDENTIFY LEADS feature. Leads were also drawn manually by selecting DRAW LEAD under the TREE dropdown menu. Additions or deletions by column/row were accomplished by selecting the appropriate function item under the TABLE dropdown menu, specifically to filter data by lead type or any associated data, such as HTS results, SPC data, EC50 values and physicochemical information. SARvision was also used to generate R-group tables to better visualize SAR for each chemical lead. The sorted data and table were then exported to MS Word, MS Excel, plain text, HTML, and SDF formats.
2.9 Physicochemical parameters
Qikprop (Schrödinger, New York, NY)48, 49 was used to estimate a variety of pharmaceutically relevant physiochemical properties, including calculated log of octanol:water partition coefficient (clogP), polar surface area (PSA), log blood-brain-barrier (logBBB) permeability, Caco-2 and MDCK cell permeability, and the number of hydrogen bond acceptors (HBA) and donors (HBD).
2.10 In vivo pharmacokinetic studies
Sixteen of 28 compounds were available to purchase at the 20-mg level. For in vivo pharmacokinetic studies, compounds were dissolved in a formulation containing 20% propylene glycol, 5% ethanol, 5% labrosol, and 70% PEG400 and administered by oral gavage to female FVB mice weighing ~25 g. At specified time points after dosing (0.25, 0.5, 1, 2, 4, 6, and 24 h), 2 animals were euthanized by CO2, and ~1 mL blood (by cardiac puncture) and brain samples were collected. The heparinized blood samples were centrifuged to obtain plasma, which was stored at −80 °C until analysis. Brain samples were weighed, diluted 4-fold with water, and then homogenized using a Precellys 24 tissue homogenizer. Brain homogenates (20% wt/vol) were stored at −80 °C until analysis. Pharmacokinetic protocols involving animals were all reviewed and approved by the UCSF institutional animal care and use committee (IACUC).
Plasma and brain homogenate samples were extracted using a protein-precipitation method and analyzed by specific LC/MS/MS methods developed for each compound dosed in vivo. The analytical method accuracy and precision were monitored by analyzing quality control (QC) samples that were prepared and treated using the same methods as calibration standards for the plasma or brain homogenate samples.
The data were used to calculate the area under the concentration-time curve (AUClast) by noncompartmental analysis with sparse sampling performed using Phoenix WinNonlin 6.1 software (Pharsight, Mountain View, CA).
3. RESULTS
3.1 Chemical libraries screened
The source and number of diverse chemical compounds screened in each assay are summarized (Table 1). In dividing ScN2a-cl3 cells, 54,250 compounds were tested (~22,700 from ChemBridge, ~30,100 from SPECS, and 1,420 FDA-approved drugs). Using stationary-phase ScN2a-cl3 cells, 50,850 total compounds were screened: ~19,300 from ChemBridge, ~30,100 from SPECS, and 1,420 FDA drugs.
Table 1.
Source and number of compounds tested in each HTS assay.
| Assay | Chembridgea | SPECSb | FDA-approved | Total |
|---|---|---|---|---|
| Dividing ScN2a-cl3 cells | 22,703 | 30,127 | 1,420 | 54,250 |
| Stationary ScN2a-cl3 cells | 19,327 | 30,103 | 1,420 | 50,850 |
Chembridge library = 23,861 compounds
SPECS library = 30,256 compounds
3.2 PrPSc HTS
When we ranked the 180,000 compounds available for screening by their combined figure of merit, including predicted bioactivity and mutual dissimilarity, we found the highest scoring compounds derived primarily from the ChemBridge and SPECS chemical libraries; from these two libraries, we selected and screened ~53,000 compounds in the PrPSc assays.
To establish the antiprion activity and the effects of the compounds on cell viability, we used dose-response curves to calculate EC50 in ELISA and LC50 in calcein-AM assays, respectively, in both dividing and stationary-phase ScN2a-cl3 cells. When cells (~35,000/well) were grown in the presence of 7 mM sodium butyrate (NaB), total fluorescence from calcein dye incorporation (a measure of the total number of viable cells) remained unchanged over the course of 5 days, suggesting that the cells were not dividing. In contrast, cell numbers at 5 days were significantly higher (~100,000; p < 0.05) when no NaB was added. Z′ and Z scores over 200 runs were excellent for both dividing and stationary-phase assays, ranging from 0.5–0.9 (Fig. 1).
Figure 1.

Z′ (dividing cells, open circles) and or Z (stationary-phase, filled circles) scores for 200 assay runs in ScN2a-cl3 cells.
From the HTS of 52,908 compounds in the dividing PrPSc assays, we identified 3,100 hits that lowered levels of PrPSc by ≥30% at 10 µM (5.9% hit rate). Of these, over 2,100 HTS hits were retested at the same concentration to confirm the hits, and tested for cell viability by calcein assays to determine single-point confirmation (SPC) hits. From HTS of 49,430 compounds in stationary-phase ScN2a-cl3 cells, we identified 331 hits (0.65% hit rate), of which 321 compounds were retested to determine SPC hits; 10 could not be retested because of inadequate supplies.
A confirmed SPC hit decreased PrPSc levels by ≥30% in HTS and retest, and caused ≤30% reduction of cell viability at 10 µM. In dividing cells, 970 compounds were confirmed SPC hits from 2,100 HTS hits; ~700 were eliminated for low antiprion potency and 426 removed for unacceptable effects on cell viability. In stationary-phase cells, 55 compounds were confirmed SPC hits. Of all confirmed SPC hits, 36 were identified in both dividing and stationary-phase ScN2a-cl3 cells.
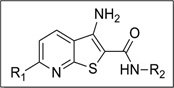
The 970 confirmed hits in dividing cells represented 20 chemical leads, from which 14 were chosen for follow up (Fig. 2, Table 2). Six leads were excluded because of unacceptable chemical properties (e.g., Michael-acceptor) or close similarity to other leads (e.g., furoylamide to benzamide). Two compounds representative of each of the 14 leads (n = 28 compounds) were tested for potency by both ELISA and Western immunoblotting. In Fig. 3A, there was an excellent correlation between EC50 values measured by ELISA and those determined by Western immunoblotting (R2 = 0.75; p < 0.001). Comparison of EC50 (Western blot and ELISA data) and LC50 (calcein AM results) curves are illustrated for three potent leads tested (Fig. 3B–D). Structures and potency for all 28 compounds are shown in Table 3. Most of the 28 compounds have favorable polarity (i.e., clogP values between 2–5) and polar surface area (PSA, < 70 Å; data not shown), and are potentially suitable for CNS application50. However, analogs from pyrazole, thienopyridine and benzyl ether leads have two or more HBD, which may limit their BBB permeability. Potency by lead from Table 2 is graphed in relation to co-planarity and as a percentage of the total number of compounds (Fig. 4). A co-planar aromatic ring system consisting 2 or more aromatic rings is the minimum prerequisite for good antiprion potency (i.e., EC50 < 1 µM; see examples from aminothiazole, thiazole, benzoxazole, pyrazole, thienopyridine, and benzamide leads in Table 2).
Figure 2.

Distribution of inhibition of PrPSc for confirmed SPC hits (n = 970) in dividing ScN2a-cl3 cells, by chemical lead (top). Inhibition of PrPSc is expressed as a relative percentage compared to PrPSc in ScN2a-cl3 cells treated with DMSO (negative control, not shown). The number of compounds tested for each chemical lead is indicated (bottom). Data for positive controls (simvastatin, quinacrine, PAMAM) not shown.
Table 2.
Distribution of EC50 values for the 14 chemical leads identified in dividing ScN2a-cl3 cells in the PrPSc assay.
| Lead Name | Murcko Fragment | Compounds tested (n) |
Compounds with EC50 < 1 µM (n) |
Compounds with EC50 = 1–10 µM (n) |
|---|---|---|---|---|
| Aminothiazole |  |
11 | 2 | 4 |
| Thiazole | 16 | 5 | 3 | |
| Benzoxazole | 17 | 3 | 6 | |
| Pyrazole |  |
6 | 4 | 1 |
| Thienopyridine |  |
54 | 18 | 16 |
| Piperazine | 11 | 0 | 3 | |
| Imidazopyridine | 4 | 0 | 2 | |
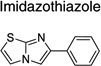
| Imidazothiazole | 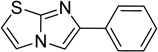 |
15 | 4 | 7 |
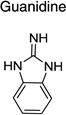
| Guanidine |  |
15 | 0 | 5 |
| Quinoline |  |
24 | 0 | 14 |
| Quinazoline |  |
8 | 0 | 4 |
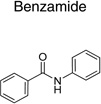
| Benzamide | 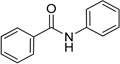 |
95 | 12 | 31 |
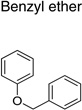
| Benzyl ether |  |
9 | 0 | 4 |
| Stilbene | 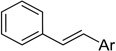 |
7 | 2 | 2 |
| Totals: | 50 | 102 | ||
Figure 3.

Comparison of EC50 values from ELISAs and Western immunoblots in dividing ScN2a-cl3 cells (n = 3). (A) EC50 data (in µM) from ELISAs (abscissa) and Western immunoblots (ordinate) show strong correlation for 28 compounds (R2 = 0.75; p < 0.001; n = 3). Dashed line represents the line of identity, solid line represents the least-squares regression fit, and open symbol represents compound IND30410. Concentrations are plotted in logarithmic values. (B–D) (left) Curves showing EC50 by Western blot (filled circles, right) and ELISA (open squares) as well as LC50 by calcein (filled triangles) for three IND compounds from the aminothiazole (B), benzamide (C), and benzoxazole (D) lead series. Values were calculated from dose-response experiments and expressed as the percent maximal inhibition normalized to the maximal absorbance measured at the highest concentration tested. In the Western blots, actin levels are shown as a control. Molecular masses are based on the migration of protein standards, shown in kilodaltons (kDa).
Table 3.
The specific structures for the 14 leads identified in dividing ScN2a-cl3 cells, with corresponding EC50 results from ELISA and Western immunoblots (n≥3 for all compounds).
| Lead (Murcko Fragment) |
Compound | Structure | EC50 ± SEM (µM) | |
|---|---|---|---|---|
| ELISA | Western | |||
 |
IND30410 | 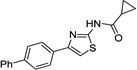 |
0.25 ± 0.07 | 0.19 ± 0.06 |
| IND30883 | 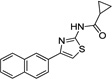 |
0.99 ± 0.02 | 0.57 ± 0.18 | |
 |
IND24350 | 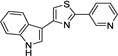 |
0.27 ± 0.04 | 0.83 ± 0.35 |
| IND24352 | 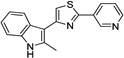 |
3.13 ± 0.64 | 1.70 ± 0.43 | |
 |
IND114202 | 0.07 ± 0.01 | 2.57 ± 1.51 | |
| IND114138 | 0.06 ± 0.01 | 0.13 ± 0.08 | ||
 |
IND25807 | 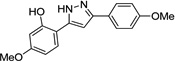 |
0.07 ± 0.03 | 0.10 ± 0.07 |
| IND28801 | 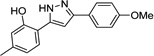 |
0.26 ± 0.02 | 0.12 ± 0.02 | |
 |
IND52025 | 0.08 ± 0.03 | 0.06 ± 0.01 | |
| IND52851 | 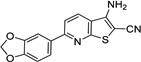 |
0.98 ± 0.08 | 0.52 ± 0.11 | |
 |
IND18629 | 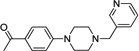 |
2.94 ± 0.55 | 0.89 ± 0.30 |
| IND19136 | 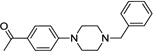 |
0.71 ± 0.11 | 0.62 ± 0.21 | |
 |
IND9419 | 0.71 ± 0.22 | 0.29 ± 0.11 | |
| IND9417 | 9.16 ± 0.89 | 4.72 ± 1.62 | ||
 |
IND9416 | 1.78 ± 0.39 | 0.52 ± 0.16 | |
| IND9413 | 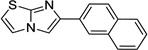 |
6.02 ± 1.10 | 2.49 ± 0.24 | |
 |
IND26326 | 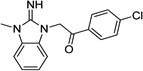 |
7.32 ± 0.47 | 4.97 ± 2.43 |
| IND44723 |  |
2.58 ± 0.63 | 1.45 ± 0.13 | |
 |
IND45193 |  |
1.36 ± 0.10 | 2.07 ± 1.17 |
| IND44355 |  |
2.56 ± 0.25 | 1.83 ± 0.07 | |
 |
IND34921 |  |
2.65 ± 0.34 | 2.01 ± 0.50 |
| IND35916 | 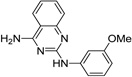 |
4.02 ± 0.35 | 5.99 ± 1.06 | |
 |
IND33145 | 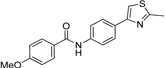 |
0.40 ± 0.05 | 0.16 ± 0.04 |
| IND31751 | 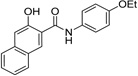 |
0.13 ± 0.04 | 0.04 ± 0.01 | |
 |
IND46380 | 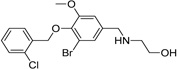 |
4.83 ± 0.57 | 2.74 ± 0.88 |
| IND34452 | 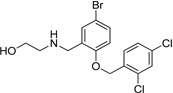 |
4.30 ± 0.81 | 1.99 ± 0.29 | |
 |
IND47979 | 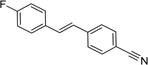 |
1.52 ± 0.27 | 0.53 ± 0.03 |
| IND47971 | 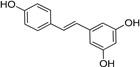 |
3.06 ± 0.19 | 0.58 ± 0.16 | |
Figure 4.

Distribution of antiprion potency in dividing ScN2a-cl3 cells by lead, expressed as a percentage of total compounds tested for each chemical lead (Y-axis). For each lead, potency is grouped by EC50 values <1 µM (filled bars) and 1–10 µM (open bars). On the X-axis, the first nine leads (from aminothiazole to stilbene) have a coplanar conformation, while the last five leads (from piperazine to benzyl ether) have non-coplanar conformation.
From testing the 1,420 FDA-approved drugs in dividing cells, we identified 130 compounds by HTS, 15 of which were confirmed SPC hits (Table 5). When the 15 were tested for concentration-effect relationships, two (dextran and Congo Red) had good potency (EC50 = ~0.4 µM) and no effects (LC50 > 10 µM) on cell viability. Unfortunately, neither is suitable as a therapy because they do not traverse the BBB. Four drugs (ethoxazine, dihydroergotamine, acepromazine and amlodipine) had weak antiprion potency (EC50 = 6.4–8.2 µM) and no untoward effects on cell viability (LC50 > 10 µM). Two drugs (carvedilol and tetrandine) showed moderate antiprion potency in ELISA (EC50 = ~2.2 µM) but also affected viability (LC50 = 5.0–6.1 µM). Three others (fendiline, tamoxifen and desloratidine) had weak antipotency in ELISA (EC50 = 4.3–6.7 µM) and a negative effect on cell viability (EC50 = 4.3–9.6 µM). The remaining four SPC hits tested were completely inactive (EC50 > 10 µM). Together, these data suggest that none of the FDA-approved drugs identified by our HTS efforts are likely to be useful as therapies.
Table 5.
Antiprion activity by ELISA (EC50) and cell viability by calcein (LC50) for 15 confirmed SPC hits in dividing ScN2a-cl3 cells from screening of 1420 FDA-approved drugs (n=3 for all compounds).
| FDA-approved drug | EC50 ± SEM (µM) |
LC50 ± SEM (µM) |
LC50/EC50 ratio |
|---|---|---|---|
| Dextran | 0.40 ± 0.08 (mg/L) | >10 (mg/L) | >24.9 |
| Congo Red | 0.45 ± 0.06 | >10 | >22 |
| Carvedilol | 2.28 ± 0.27 | 6.10 ± 1.55 | 2.67 |
| Tetrandine | 2.15 ± 0.72 | 5.01 ± 0.42 | 2.33 |
| Ethoxazine | 4.76c | >10 | >2.1 |
| Dihydroergotamine | 6.44c | >10 | >1.55 |
| Acepromazine | 6.93 ± 1.45 | >10 | >1.44 |
| Amlodipine | 8.22 ± 0.75 | >10 | >1.22 |
| Fendiline | 4.35 ± 0.66 | 4.33 ± 0.68 | 0.99 |
| Tamoxifen | 4.39 ± 0.33 | 4.89 ± 0.17 | 1.11 |
| Desloratidine | 6.66 ± 0.56 | 9.56c | 1.44 |
| Apomorphine | >10 | >10 | ndb |
| Amiodarone | >10 | >10 | nd |
| Hexadimethrine | >10 | >10 | nd |
| Enoxaparin | >10 (mg/L) | >10 (mg/L) | nd |
Units are all µM, except those indicated by mg/L, since drugs are a mixture of molecular weights.
nd, not determined.
Mean of two measurements; third replicate produced values > 10 µM.
From HTS of 49,430 compounds from the ChemBridge and SPECS libraries using stationary-phase cells, we initially identified 331 HTS hits (0.65% hit rate) representing 13 chemical leads. Fifty-five of 321 were confirmed as SPC hits, representing three chemical leads, including 11 piperazines, six indoles and six ureas, with the remaining 32 being singletons or duplicates (Table 4). Ten of 331 could not be retested because of inadequate supplies. Six of 55 confirmed SPC hits in stationary-phase cells were tested for potency (dose-titrations between 3.2 nM–10 µM), including one indole (IND23308) because it produced the largest percent reduction in PrPSc in the HTS (70%) and SPC assays (94%). We did not test any of the other 49 confirmed SPC hits because their effects were too weak to expect them to show good potency. IND23308 had low micromolar potency in both stationary-phase and dividing cells (EC50 = 7.5 and 1.58 µM, respectively) with no effect on cell viability (Table 4). The other five confirmed SPC hits tested for potency were found to be inactive (EC50 > 10 µM). From testing the 1,420 FDA-approved drugs in stationary-phase assays, we identified six HTS hits, none of which were confirmed by SPC.
Table 4.
Reduction of PrPSc, cell viability, and calculated physicochemical parameters of 23 confirmed SPC hits in stationary-phase cells. The 23 hits represent three leads, shown with their respective Murcko fragments. Results in dividing cells also shown.
| Compound | Structure | MW | Reduction (%)a | Calculated physicochemical parametersb | |||||||
|---|---|---|---|---|---|---|---|---|---|---|---|
| Dividing | Stationary | ClogP | PSA | HDB/HBA | QPCaco-2 | QPlogBBB | |||||
| PrPSc | V | PrPSc | V | ||||||||
| IND7190 | 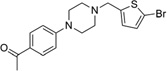 |
379.3 | 97 | 8 | 34 | 12 | 3.64 | 37.1 | 0/5 | 768.1 | 0.542 |
| IND7486 | 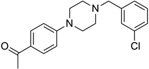 |
328.8 | 84 | 6 | 31 | 12 | 3.67 | 36.8 | 0/5 | 785.8 | 0.435 |
| IND17848 | 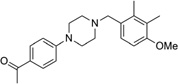 |
352.5 | 95 | 1 | 41 | 24 | 3.81 | 42.3 | 0/5.8 | 767.9 | 0.167 |
| IND18785 | 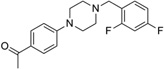 |
330.4 | 85 | 30 | 30 | 20 | 3.56 | 36.8 | 0/5 | 785.8 | 0.475 |
| IND19130 | 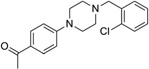 |
328.8 | 86 | 5 | 41 | 2 | 3.54 | 37.0 | 0/5 | 776.9 | 0.393 |
| IND18721 | 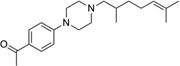 |
328.5 | 78 | −6 | 55 | 10 | 4.24 | 36.2 | 0/5 | 765.6 | 0.033 |
| IND19672 | 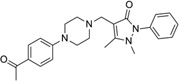 |
405 | 64 | −7 | 35 | −0.1 | 2.91 | 69.3 | 0/9 | 396.7 | −0.106 |
| IND2118 |  |
382.5 | 76 | 25 | 51 | 24 | 5.19 | 29.6 | 1/4.5 | 1300.5 | 0.468 |
| IND15461 |  |
405.3 | 22 | −4 | 48 | 3 | 4.46 | 34.1 | 1/4.5 | 1214.7 | 0.579 |
| IND19847 |  |
282.8 | 42 | −6 | 51 | 3 | 3.64 | 7.9 | 0/3.5 | 2396.0 | 1.253 |
| IND7046 |  |
373.3 | 67 | 14 | 39 | 2 | 3.74 | 36.8 | 0/5 | 785.8 | 0.447 |
 | |||||||||||
| IND5942 |  |
315.6 | 91 | 3 | 51 | 8 | 3.90 | 46.7 | 2/2 | 1717.3 | 0.327 |
| IND8255 | 333.6 | 92 | 2 | 61 | 11 | 4.04 | 46.8 | 2/2 | 1720.5 | 0.388 | |
| IND8314 | 264.7 | 87 | 7 | 56 | 17 | 3.11 | 46.7 | 2/2 | 1717.7 | 0.094 | |
| IND10851 |  |
499.6 | 83 | 15 | 61 | 19 | 5.19 | 114.4 | 1/4 | 155.5 | −1.048 |
| IND19237 | 299.1 | 25 | 2 | 66 | 26 | 3.60 | 46.7 | 2/2 | 1717.6 | 0.256 | |
| IND19238 |  |
349.1 | 17 | −3 | 63 | 9 | 4.35 | 46.0 | 2/2 | 2005.2 | 0.485 |
 | |||||||||||
| IND5381 |  |
282.4 | 27 | 12 | 48 | 16 | 4.32 | 24.5 | 2/1.5 | 1527.6 | 0.630 |
| IND15474 |  |
273.3 | 14 | 11 | 39 | 9 | 2.01 | 70.6 | 2/5.4 | 776.4 | −0.795 |
| IND10094 |  |
326.4 | 81 | 19 | 46 | 21 | 5.60 | 16.9 | 1/1.5 | 1471.9 | 0.551 |
| IND4176 | 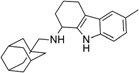 |
348.5 | 98 | 9 | 53 | −2 | 5.43 | 23.0 | 2/1.5 | 1696.6 | 0.610 |
| IND23308c | 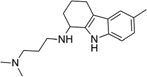 |
285.4 | 88c | 30c | 94c | 12c | 3.45 | 31.7 | 2/3.5 | 289.4 | 0.684 |
| IND22103 | 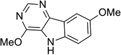 |
229.2 | 81 | −3 | 37 | −21 | 2.53 | 53.4 | 1/2.8 | 2945.9 | −0.017 |
Percentage reductions of PrPSc and cell viability (V) measured by ELISA from SPC assays. Compounds reducing PrPSc levels by ≥30% are considered to have good antiprion potency; compounds reducing cell viability ≤30% are considered to have a safe effect.
EC50 values were 1.58 µM and 7.5 µM in dividing and stationary-phase cells, respectively, and LC50 was >10 µM in both.
3.3 SAR studies for PrPSc
From 14 leads identified in dividing ScN2a-cl3 cells and chosen for follow up (Tables 2 and 3), an SAR-by-catalog strategy was initiated. The first set of 467 compounds was obtained and their EC50 values were measured to confirm potency and establish preliminary SAR. We identified two leads (thienopyridine and benzamide) with 6 compounds having EC50 values of <1 µM (data not shown). Several leads, including piperazine, imidazolopyridine, guanidine, quinoline, quinazoline, and benzyl ether, demonstrated low antiprion potencies. For these less active leads, it is possible that the analogs selected were suboptimal and do not represent the true potential of these leads.
Upon closer examination of the hits across different chemical leads, several trends became evident. A conjugated aromatic or heteroaromatic ring system was prominent in all lead structures. This ring system is comprised of more than two aryl or heteroaryl groups joined in a fused or linear fashion. In the case of linear aromatic systems, two aromatic rings can be linked directly via a carbon-carbon bond or a linker such as an amide or double bond. Further analysis revealed that compounds with better potency (<1 µM) were from leads having core structures possessing a flat coplanar or near coplanar conformation, such as the AMT, thiazole (i.e., IND24350), benzoxazole (IND114202 and IND1141138), pyrazole (IND25807), thienopyridine (IND52025), imidazothiazole, benzamide (IND33145 and IND31751), and stilbene leads. In contrast, leads with rings connected via flexible groups that disrupt coplanarity of the aryl ring system had diminished antiprion activity (>1 µM). These compounds include guanidines (IND26326 and IND44723), quinolines (IND45193 and IND44355), quinazolines (IND34921 and IND35916), and benzyl ethers (IND46380 and IND34452). When the coplanar structure is broken, as seen in thiazole IND24350 by a methyl group (IND24352), activity dropped 10-fold from 0.27 uM for IND24350 to 3.13 uM for IND24352.
From initial SAR observations, we selected the thienopyridine lead for further analysis. We purchased 80 commercially available thienopyridines and determined their antiprion potency and cell viability in dividing ScN2a-cl3 cells (selected analogs shown in Table 6). For the amide R2 group, a phenyl ring with one substituent seemed to be optimal for antiprion activity (IND35860 and IND37769) (Table 6). In the unknown target, the space around the phenyl group of the amide may be restricted based on the diminished antiprion activity of a larger congener IND35833 containing a dioxane ring. A similar trend was also observed with the thiophene series, for which the antiprion potency tended to decrease as the size of the substituent on the amide phenyl ring increased (compare IND24576, IND24573, IND24581, and IND42103; Table 6). In support of this trend, the congener IND42103 bearing the largest R2 group was inactive in dividing ScN2a-cl3 cells. Also, aliphatic amides with flexible methylene linkers were less favorable (IND40541 and IND37771) compared to aryl amides from anilines.
Table 6.
Antiprion activity by ELISA (EC50) and cell viability by calcein (LC50) for selected thienopyridine analogs in dividing ScN2a-cl3 cells (n = 3 for all compounds).
 | |||||||
| Compound | R2 |
EC50 ± SEM (µM) |
LC50 (µM) |
Compound | R2 |
EC50 ± SEM (µM) |
LC50 (µM) |
| IND35860 | 0.14 ± 0.04 | >10 | |||||
| IND37769 | 0.29 ± 0.13 | >10 | IND24576 |  |
0.10 ± 0.02 | >10 | |
| IND35833 |  |
>10 | >10 | IND24573 |  |
0.42 ± 0.06 | >10 |
| IND40541 | >10 | >10 | IND24581 |  |
1.83 ± 0.58 | >10 | |
| IND37771 |  |
0.42 ± 0.02 | >10 | IND42103 | >10 | >10 | |
 | |||||||
| Compound | R1 |
EC50 ± SEM (µM) |
LC50 (µM) |
Compound | R1 |
EC50 ± SEM (µM) |
LC50 (µM) |
| IND35860 | 0.14 ± 0.04 | >10 | IND24575 | 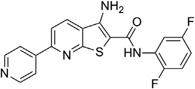 |
2.22 ± 0.72 | >10 | |
| IND44746 |  |
0.24 ± 0.02 | >10 | IND52025 | 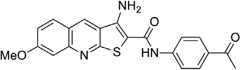 |
0.06 ± 0.01 | >10 |
| IND42063 |  |
0.75 ± 0.07 | >10 | IND24609 | 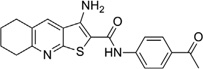 |
>10 | >10 |
With respect to the R1 substitution at the C-6 position of the thienopyridine lead, a thiophene or phenyl ring may be preferable. It is also clear that the congener with one methoxy group on the phenyl ring (IND35860) was more potent than the corresponding congeners with two substituents (IND44746 and IND42063) (Table 6). IND35860 was also equipotent to the thiophene analog IND24576 (Table 6). However, the electron-deficient pyridyl ring at R1 position was less tolerated (compare IND24575 with IND24581) (Table 6).
It is noteworthy that IND52025 with a phenyl ring fused to the thienopyridine lead was more potent than the unfused analog IND37769; however, the cyclohexyl-fused ring system (IND24609) was inactive, suggesting a flat structure is preferred at this position (Table 6).
3.4 Pharmacokinetics and brain distribution
We wanted to determine if any of the 28 compounds (representing 14 leads; Table 3) identified had good enough drug-like properties to consider them for further testing in animal models. We tested 16 of 28 commercially available compounds in single-dose (10 mg/kg) pharmacokinetic studies in female FVB mice. Of the 16 tested, four showed good oral absorption and brain concentrations. Results are shown for two of the four compounds with good antiprion potency (EC50 < 1 µM) and predicted to have good BBB penetration (Table 7 and Fig. 5).
Table 7.
Maximum brain and plasma concentrations (Cmax) and area under the curve [area under the curve values from first to last measureable time points (AUClast)] for IND45193 and IND52851 after a single dose (10 mg/kg) administered orally to two FVB mice. Chemical structures shown in Table 3.
| Compound | Matrix | Cmax ± SD (µM) | AUClast ± SD (µM*h) | Brain/Plasma AUClast Ratio |
|---|---|---|---|---|
| IND45193 | Brain | 1.61 ± 0.23 | 7.36 ± 0.78 | 4.72 |
| Plasma | 0.13 ± 0.01 | 1.56 ± 0.31 | ||
| IND52851 | Brain | 1.02 ± 0.71 | 2.12 ± 0.93 | 2.59 |
| Plasma | 0.41 ± 0.25 | 0.82 ± 0.31 | ||
Figure 5.

Brain (squares) and plasma (circles) concentrations in mice after oral administration of 10 mg/kg of IND52851 (a) and IND45193 (b). Chemical structures for these compounds are shown in Table 3. Data points and bars signify the mean ± SD representing two mice at each time point. Each drug was given in a separate experiment.
4. DISCUSSION
Our results indicate that far fewer compounds are capable of reducing PrPSc levels in stationary-phase cells in comparison to dividing cells. Several possible reasons might explain the fewer HTS and confirmed SPC hits in stationary-phase cells. First, drug-resistant PrPSc may have formed due to division arrest or an effect of sodium butyrate independent of cell division. Second, our assay may have selected only for compounds that increase the clearance but do not decrease the formation of PrPSc, which might result in different hits for dividing and stationary-phase cells. Finally, the cell line used may present variations that are responsible for these differences.
Our previous study on the effect of cell division on prion accumulation provides a possible explanation for at least part of what we observed51. In prion-infected cells, three competing processes influence prion accumulation: PrPC-to-PrPSc conversion, PrPSc degradation, and cell division. We had previously shown that for infected N2a cells, the process of cell division plays an important role in establishing the steady-state level of intracellular PrPSc. As infected cells divide, the accumulated PrPSc is distributed among the daughter cells resulting in reduced PrPSc levels. Thus, cell division contributes to an elevated apparent rate of prion clearance in a continuously dividing cell cultures. A compound that inhibits prion formation without affecting its clearance will also appear more efficacious in dividing cell lines, as both nascent PrPSc will be reduced and existing PrPSc decrease during cell division. Conversely, in stationary-phase cells, PrPSc catabolism is the sole route of prion clearance since PrPSc will not be reduced cell division under these conditions.
The different ability of antiprion drugs to clear prions in dividing28, 31 and stationary-phase cells has been demonstrated for quinacrine41. Whereas quinacrine rapidly cleared dividing cells of PrPSc, it was relatively ineffective in stationary-phase prion-infected cells. Our results suggested that the reduced rate of clearance in stationary-phase cells provides an opportunity for the formation of drug-resistant strains upon continuous exposure to quinacrine. Whether the formation of drug-resistant strains in stationary-phase cells is a general phenomenon remains to be established.
One interpretation of the failure of quinacrine to extend survival of prion-infected mice is that antiprion compounds need to be potent in both dividing and stationary-phase prion-infected cells in order to be effective in vivo in mice and patients with prion disease. Despite its lack of potency in stationary-phase cells (data not shown), Compound B was potent in dividing cells and significantly extended survival in prion-infected mice if drug treatment was started either immediately or soon after infection with RML prions37. However, Compound B is unlikely to be acceptable for use in humans because it contains a phenylhydrazone moiety that is metabolically unstable and could lead to reactive intermediates causing potentially serious adverse effects, drug-drug interactions, or both52–54.
One confirmed lead (AMT) was previously reported from a screen of 10,000 compounds55 and this series continues to be pursued56, 57. Most of the initial AMT analogs described here (e.g., IND30410 and IND30883) are commercially available. More advanced leads from this series were synthesized using Hantzsch-type condensation between bromomethyl ketones and thioureas as previously reported56, 57.
In the present work, we performed HTS assays of ~53,000 diverse chemical compounds in dividing ScN2a-cl3 cells, and discovered 3,100 hits and 970 confirmed SPC hits (1.85% confirmed hit rate). The confirmed SPC hits generally derived from 14 distinct chemical leads and produced 50 compounds (either from the original screen or related analogs) with submicromolar potency (PrPSc ELISA with EC50 < 1 µM) and little or no effect on cell viability (EC50 >10 µM) (Table 2). In our search for these hits, we used predictions of bioactivity and a metric of dissimilarity58 to prioritize our libraries by screening the top ~53,000 of 180,000 compounds available. This strategy successfully identified and confirmed many leads in dividing ScN2a-cl3 cells, but fewer confirmed leads in stationary-phase cells. Furthermore, SAR-by-catalog successfully identified many analogs that led to the identification of promising new leads: two of four compounds have shown to be absorbed orally and reach the brain at high concentrations.
In contrast to the 3,100 HTS and 970 confirmed SPC hits in dividing cells, we discovered only 331 HTS and 55 confirmed SPC hits in stationary-phase cells (0.11% SPC hit rate). The 55 confirmed SPC hits included 23 analogs from the three chemical leads. Of these, only one indole analog (IND22308) had a large effect in HTS (70% inhibition) and SPC assays (94% inhibition; Table 4), and had antiprion potency in both stationary-phase and dividing cells (EC50 = 7.5 and 1.6 µM, respectively) with no effect on cell viability. In contrast, when we tested five of 55 confirmed SPC hits, which are part of the 32 not representing any confirmed leads in concentration-effect assays, they were inactive in the PrPSc ELISA (EC50 > 10 µM). The reason for the lack of potency is unknown.
Whether the identification of lead compounds that inhibit PrPSc formation or enhance its clearance in stationary-phase cells will more predictive of drugs that are efficacious in mice and humans remains to be established. To probe why quinacrine was effective in ScN2a cells in suppressing PrPSc levels but ineffective in mice, we examined stationary phase cultures. In those non-dividing cells, quinacrine was found to be ineffective in lowering PrPSc levels. In contrast, compound B was effective in doubling the incubation time in RML-infected mice but not in stationary-phase cultured cells argues that stationary-phase cell cultures may not have superior predictive value over that of dividing cells. Clearly more studies are needed to determine the utility of stationary-phase cultured cell lines in identifying hits and leads in the quest to develop therapeutics for CJD and human prion diseases.
Research highlights.
For the first time, pymetrozine was determined in red pepper using GC-NPD.
Samples were extracted using modified QuEChERs acetate-buffered version.
The method proved to be simple and sensitive, with a good performance.
The dissipation pattern followed the first order kinetics model with short half-life.
ACKNOWLEDGMENTS
This work was supported by grants from the National Institutes of Health (AG002132, AG10770, and AG021601) as well as by gifts from the Sherman Fairchild, Larry L. Hillblom, Lincy, Michael Homer, and William McCabe Foundations. The authors thank Ms. Alejandra Acevedo, Ms. Josephine Lau, and Ms. Darlene Groth for their contributions to the HTS assays; Mr. Manuel Elepano and Mr. Phillip Benner for dose preparation, animal dosing, and sample collection in pharmacokinetic studies; Ms. Ana Serban, Ms. Julia Becker, and Mr. Frederic Letessier for D13 and D18 antibodies; Dr. Kurt Giles, Dr. Pierre Lessard, and the staff of the Hunter’s Point animal facility for expert animal studies; Mr. Joseph Mulvaney of the SMDC for early discussions involving evaluation and selection of compounds for HTS; Dr. Christian Laggner for helpful suggestions regarding purchased analogs for SAR; Dr. Elena Dolghih for calculation of physicochemical properties using Qikprop (Tables 3 and 4); and Ms. Hang Nguyen for editorial assistance. We are grateful to Daylight for the use of their fingerprint toolkit (www.daylight.com) and to Molinspiration for a license to use their mib software (www.molinspiration.com). M.P.J. is a consultant to Schrödinger LLC.
Footnotes
Publisher's Disclaimer: This is a PDF file of an unedited manuscript that has been accepted for publication. As a service to our customers we are providing this early version of the manuscript. The manuscript will undergo copyediting, typesetting, and review of the resulting proof before it is published in its final citable form. Please note that during the production process errors may be discovered which could affect the content, and all legal disclaimers that apply to the journal pertain.
REFERENCES
- 1.Aguzzi A, Sigurdson C, Heikenwaelder M. Annu. Rev. Pathol. 2008;3:11. doi: 10.1146/annurev.pathmechdis.3.121806.154326. [DOI] [PubMed] [Google Scholar]
- 2.Jucker M, Walker LC. Ann. Neurol. 2011;70:532. doi: 10.1002/ana.22615. [DOI] [PMC free article] [PubMed] [Google Scholar]
- 3.Prusiner SB. Science. 2012;336:1511. doi: 10.1126/science.1222951. [DOI] [PMC free article] [PubMed] [Google Scholar]
- 4.Pan K-M, Baldwin M, Nguyen J, Gasset M, Serban A, Groth D, Mehlhorn I, Huang Z, Fletterick RJ, Cohen FE, Prusiner SB. Proc. Natl. Acad. Sci. U.S.A. 1993;90:10962. doi: 10.1073/pnas.90.23.10962. [DOI] [PMC free article] [PubMed] [Google Scholar]
- 5.Prusiner SB. N. Engl. J. Med. 2001;344:1516. doi: 10.1056/NEJM200105173442006. [DOI] [PubMed] [Google Scholar]
- 6.Prusiner SB. Annu. Rev. Med. 1987;38:381. doi: 10.1146/annurev.me.38.020187.002121. [DOI] [PubMed] [Google Scholar]
- 7.Hsiao K, Baker HF, Crow TJ, Poulter M, Owen F, Terwilliger JD, Westaway D, Ott J, Prusiner SB. Nature. 1989;338:342. doi: 10.1038/338342a0. [DOI] [PubMed] [Google Scholar]
- 8.Poulter M, Baker HF, Frith CD, Leach M, Lofthouse R, Ridley RM, Shah T, Owen F, Collinge J, Brown G, Hardy J, Mullan MJ, Harding AE, Bennett C, Doshi R, Crow TJ. Brain. 1992;115:675. doi: 10.1093/brain/115.3.675. [DOI] [PubMed] [Google Scholar]
- 9.Stevens DJ, Walter ED, Rodriguez A, Draper D, Davies P, Brown DR, Millhauser GL. PLoS Pathog. 2009;5:e1000390. doi: 10.1371/journal.ppat.1000390. [DOI] [PMC free article] [PubMed] [Google Scholar]
- 10.Chapman J, Ben-Israel J, Goldhammer Y, Korczyn AD. Neurology. 1994;44:1683. doi: 10.1212/wnl.44.9.1683. [DOI] [PubMed] [Google Scholar]
- 11.Spudich S, Mastrianni JA, Wrensch M, Gabizon R, Meiner Z, Kahana I, Rosenmann H, Kahana E, Prusiner SB. Mol. Med. 1995;1:607. [PMC free article] [PubMed] [Google Scholar]
- 12.Gajdusek DC, Gibbs CJ, Jr, Alpers M. Nature. 1966;209:794. doi: 10.1038/209794a0. [DOI] [PubMed] [Google Scholar]
- 13.Koch TK, Berg BO, DeArmond SJ, Gravina RF. N. Engl. J. Med. 1985;313:731. doi: 10.1056/NEJM198509193131206. [DOI] [PubMed] [Google Scholar]
- 14.Parry HB. Nature. 1960;185:441. doi: 10.1038/185441a0. [DOI] [PubMed] [Google Scholar]
- 15.Wilesmith JW, Wells GAH, Cranwell MP, Ryan JBM. Vet. Rec. 1988;123:638. [PubMed] [Google Scholar]
- 16.Will RG, Ironside JW, Zeidler M, Cousens SN, Estibeiro K, Alperovitch A, Poser S, Pocchiari M, Hofman A, Smith PG. Lancet. 1996;347:921. doi: 10.1016/s0140-6736(96)91412-9. [DOI] [PubMed] [Google Scholar]
- 17.O'Rourke KI, Holyoak GR, Clark WW, Mickelson JR, Wang S, Melco RP, Besser TE, Foote WC. J. Gen. Virol. 1997;78:975. doi: 10.1099/0022-1317-78-4-975. [DOI] [PubMed] [Google Scholar]
- 18.Mathiason CK, Powers JG, Dahmes SJ, Osborn DA, Miller KV, Warren RJ, Mason GL, Hays SA, Hayes-Klug J, Seelig DM, Wild MA, Wolfe LL, Spraker TR, Miller MW, Sigurdson CJ, Telling GC, Hoover EA. Science. 2006;314:133. doi: 10.1126/science.1132661. [DOI] [PubMed] [Google Scholar]
- 19.Tamgüney G, Miller MW, Wolfe LL, Sirochman TM, Glidden DV, Palmer C, Lemus A, DeArmond SJ, Prusiner SB. Nature. 2009;461:529. doi: 10.1038/nature08289. [DOI] [PMC free article] [PubMed] [Google Scholar]
- 20.Race RE, Fadness LH, Chesebro B. J. Gen. Virol. 1987;68:1391. doi: 10.1099/0022-1317-68-5-1391. [DOI] [PubMed] [Google Scholar]
- 21.Solassol J, Crozet C, Lehmann S. Br. Med. Bull. 2003;66:87. doi: 10.1093/bmb/66.1.87. [DOI] [PubMed] [Google Scholar]
- 22.Mahal SP, Baker CA, Demczyk CA, Smith EW, Julius C, Weissmann C. Proc. Natl. Acad. Sci. USA. 2007;104:20908. doi: 10.1073/pnas.0710054104. [DOI] [PMC free article] [PubMed] [Google Scholar]
- 23.Chandler RL. Lancet. 1961;277:1378. doi: 10.1016/s0140-6736(61)92008-6. [DOI] [PubMed] [Google Scholar]
- 24.Kocisko DA, Baron GS, Rubenstein R, Chen J, Kuizon S, Caughey B. J. Virol. 2003;77:10288. doi: 10.1128/JVI.77.19.10288-10294.2003. [DOI] [PMC free article] [PubMed] [Google Scholar]
- 25.Kocisko DA, Caughey B, Morrey JD, Race RE. Antimicrob. Agents Chemother. 2006;50:3447. doi: 10.1128/AAC.00715-06. [DOI] [PMC free article] [PubMed] [Google Scholar]
- 26.Trevitt CR, Collinge J. Brain. 2006;129:2241. doi: 10.1093/brain/awl150. [DOI] [PubMed] [Google Scholar]
- 27.Sim VL, Caughey B. Infect. Disord. Drug Targets. 2009;9:81. doi: 10.2174/1871526510909010081. [DOI] [PMC free article] [PubMed] [Google Scholar]
- 28.Korth C, May BCH, Cohen FE, Prusiner SB. Proc. Natl. Acad. Sci. U.S.A. 2001;98:9836. doi: 10.1073/pnas.161274798. [DOI] [PMC free article] [PubMed] [Google Scholar]
- 29.Barret A, Tagliavini F, Forloni G, Bate C, Salmona M, Colombo L, De Luigi A, Limido L, Suardi S, Rossi G, Auvre F, Adjou KT, Sales N, Williams A, Lasmezas C, Deslys JP. J. Virol. 2003;77:8462. doi: 10.1128/JVI.77.15.8462-8469.2003. [DOI] [PMC free article] [PubMed] [Google Scholar]
- 30.May BCH, Witkop J, Sherrill J, Anderson MO, Madrid PB, Zorn JA, Prusiner SB, Cohen FE, Guy RK. Bioorg. Med. Chem. Lett. 2006;16:4913. doi: 10.1016/j.bmcl.2006.06.050. [DOI] [PubMed] [Google Scholar]
- 31.May BCH, Fafarman AT, Hong SB, Rogers M, Deady LW, Prusiner SB, Cohen FE. Proc. Natl. Acad. Sci. U.S.A. 2003;100:3416. doi: 10.1073/pnas.2627988100. [DOI] [PMC free article] [PubMed] [Google Scholar]
- 32.Dollinger S, Lober S, Klingenstein R, Korth C, Gmeiner P. J. Med. Chem. 2006;49:6591. doi: 10.1021/jm060773j. [DOI] [PubMed] [Google Scholar]
- 33.Kempster S, Bate C, Williams A. Neuroreport. 2007;18:479. doi: 10.1097/WNR.0b013e328058678d. [DOI] [PubMed] [Google Scholar]
- 34.Kimata A, Nakagawa H, Ohyama R, Fukuuchi T, Ohta S, Doh-ura K, Suzuki T, Miyata N. J. Med. Chem. 2007;50:5053. doi: 10.1021/jm070688r. [DOI] [PubMed] [Google Scholar]
- 35.Thompson MJ, Borsenberger V, Louth JC, Judd KE, Chen B. J. Med. Chem. 2009;52:7503. doi: 10.1021/jm900920x. [DOI] [PubMed] [Google Scholar]
- 36.Thompson MJ, Louth JC, Ferrara S, Jackson MP, Sorrell FJ, Cochrane EJ, Gever J, Baxendale S, Silber BM, Roehl HH, Chen B. Eur. J. Med. Chem. 2011;46:4125. doi: 10.1016/j.ejmech.2011.06.013. [DOI] [PubMed] [Google Scholar]
- 37.Kawasaki Y, Kawagoe K, Chen CJ, Teruya K, Sakasegawa Y, Doh-ura K. J. Virol. 2007;81:12889. doi: 10.1128/JVI.01563-07. [DOI] [PMC free article] [PubMed] [Google Scholar]
- 38.Teruya K, Kawagoe K, Kimura T, Chen CJ, Sakasegawa Y, Doh-ura K. Infect. Disord. Drug Targets. 2009;9:15. doi: 10.2174/1871526510909010015. [DOI] [PubMed] [Google Scholar]
- 39.Supattapone S, Wille H, Uyechi L, Safar J, Tremblay P, Szoka FC, Cohen FE, Prusiner SB, Scott MR. J. Virol. 2001;75:3453. doi: 10.1128/JVI.75.7.3453-3461.2001. [DOI] [PMC free article] [PubMed] [Google Scholar]
- 40.Yudovin-Farber I, Azzam T, Metzer E, Taraboulos A, Domb AJ. J. Med. Chem. 2005;48:1414. doi: 10.1021/jm049378o. [DOI] [PubMed] [Google Scholar]
- 41.Ghaemmaghami S, Ahn M, Lessard P, Giles K, Legname G, DeArmond SJ, Prusiner SB. PLoS Pathog. 2009;5:e1000673. doi: 10.1371/journal.ppat.1000673. [DOI] [PMC free article] [PubMed] [Google Scholar]
- 42.Williamson RA, Peretz D, Pinilla C, Ball H, Bastidas RB, Rozenshteyn R, Houghten RA, Prusiner SB, Burton DR. J. Virol. 1998;72:9413. doi: 10.1128/jvi.72.11.9413-9418.1998. [DOI] [PMC free article] [PubMed] [Google Scholar]
- 43.Voigt JH, Bienfait B, Wang S, Nicklaus MC. J. Chem. Inf. Comput. Sci. 2001;41:702. doi: 10.1021/ci000150t. [DOI] [PubMed] [Google Scholar]
- 44.Ghaemmaghami S, Ullman J, Ahn M, St. Martin S, Prusiner SB. J. Biol. Chem. 2010;285:10415. doi: 10.1074/jbc.M109.045112. [DOI] [PMC free article] [PubMed] [Google Scholar]
- 45.Safar JG, Scott M, Monaghan J, Deering C, Didorenko S, Vergara J, Ball H, Legname G, Leclerc E, Solforosi L, Serban H, Groth D, Burton DR, Prusiner SB, Williamson RA. Nat. Biotechnol. 2002;20:1147. doi: 10.1038/nbt748. [DOI] [PubMed] [Google Scholar]
- 46.Marquardt DW. J. Soc. Indust. Appl. Math. 1963;11:431. [Google Scholar]
- 47.Zhang JH, Chung TD, Oldenburg KR. J. Biomol. Screen. 1999;4:67. doi: 10.1177/108705719900400206. [DOI] [PubMed] [Google Scholar]
- 48.Barreiro G, Guimaraes CR, Tubert-Brohman I, Lyons TM, Tirado-Rives J, Jorgensen WL. J. Chem. Inf. Model. 2007;47:2416. doi: 10.1021/ci700271z. [DOI] [PMC free article] [PubMed] [Google Scholar]
- 49.Dzierba CD, Tebben AJ, Wilde RG, Takvorian AG, Rafalski M, Kasireddy-Polam P, Klaczkiewicz JD, Pechulis AD, Davis AL, Sweet MP, Woo AM, Yang Z, Ebeltoft SM, Molski TF, Zhang G, Zaczek RC, Trainor GL, Combs AP, Gilligan PJ. J. Med. Chem. 2007;50:2269. doi: 10.1021/jm0611410. [DOI] [PubMed] [Google Scholar]
- 50.Hitchcock SA, Pennington LD. J. Med. Chem. 2006;49:7559. doi: 10.1021/jm060642i. [DOI] [PubMed] [Google Scholar]
- 51.Ghaemmaghami S, Phuan PW, Perkins B, Ullman J, May BC, Cohen FE, Prusiner SB. Proc. Natl. Acad. Sci. USA. 2007;104:17971. doi: 10.1073/pnas.0708372104. [DOI] [PMC free article] [PubMed] [Google Scholar]
- 52.Jonen HG, Werringloer J, Prough RA, Estabrook RW. J. Biol. Chem. 1982;257:4404. [PubMed] [Google Scholar]
- 53.Malca-Mor L, Stark AA. Appl. Environ. Microbiol. 1982;44:801. doi: 10.1128/aem.44.4.801-808.1982. [DOI] [PMC free article] [PubMed] [Google Scholar]
- 54.Walton K, Coombs MM, Catterall FS, Walker R, Ioannides C. Carcinogenesis. 1997;18:1603. doi: 10.1093/carcin/18.8.1603. [DOI] [PubMed] [Google Scholar]
- 55.Ghaemmaghami S, May BCH, Renslo AR, Prusiner SB. J. Virol. 2010;84:3408. doi: 10.1128/JVI.02145-09. [DOI] [PMC free article] [PubMed] [Google Scholar]
- 56.Gallardo-Godoy A, Gever J, Fife KL, Silber BM, Prusiner SB, Renslo AR. J. Med. Chem. 2011;54:1010. doi: 10.1021/jm101250y. [DOI] [PMC free article] [PubMed] [Google Scholar]
- 57.Silber BM, Rao S, Fife KL, Gallardo-Godoy A, Renslo AR, Dalvie DK, Giles K, Freyman Y, Elepano M, Gever JR, Lam B, Jacobson MP, Huang Y, Benet LZ, Prusiner SB. Pharm. Res. doi: 10.1007/s11095-012-0912-4. In press. [DOI] [PMC free article] [PubMed] [Google Scholar]
- 58.Keiser MJ, Roth BL, Armbruster BN, Ernsberger P, Irwin JJ, Shoichet BK. Nat. Biotechnol. 2007;25:197. doi: 10.1038/nbt1284. [DOI] [PubMed] [Google Scholar]