

There is a paucity of information in the literature pertaining to the validity of using twins to make inferences about the general population. The authors examined twin data representativeness for a range of birth, anthropometric, and ophthalmic traits in a large twin/sibling cohort.
Abstract
Purpose.
To compare the distributional parameters for a series of ocular biometric traits between twins and their singleton siblings, to evaluate the generalizability of twin data, as used in heritability analyses to the general population.
Methods.
A series of birth, anthropometric, and 13 ocular biometric traits were selected for analysis: interpupillary distance (IPD), visual acuity (logMAR), spherical equivalent refractive error, corneal curvature, axial length, anterior chamber depth (ACD), central corneal thickness (CCT), intraocular pressure (IOP), optic disc, cup and rim areas, and measures of retinal vessel caliber; central retinal arteriolar equivalent (CRAE), and central retinal venular equivalent (CRVE). Structural equation modeling was used to test the assumption that the means and variances for each trait did not differ between twins and their siblings.
Results.
Significant differences in log-likelihood for birth weight and gestational age were observed between twins and siblings, with the latter being both heavier and closer to full-term at birth. Siblings were also found to have larger IPD and axial length, and better visual acuity compared with their twin counterparts. Refractive error, corneal curvature, ACD, CCT, optic disc parameters, and retinal vascular calibers did not differ significantly between the two groups.
Conclusions.
Twins are representative of the general population for some but not all measures of ocular biometry. Consequently, care should be taken when extrapolating twin data for these traits in heritability and other genetic studies. Birth weight differences between twins and siblings do not appear to account for the differences in ocular biometry observed in this study.
The classic twin study represents one of several investigative methodologies in genetic epidemiology designed to quantify the relative contribution of genes and environment to biological traits and disease. The interpretation of estimates of heritability from twin data are based on implicit assumptions of twin-singleton trait comparability, which influences the extent to which such results may be considered applicable to the general non-twin population. In addition to nonrandom sampling, this reflects a frequent criticism of the twin method in its purported nongeneralizability to singletons due to differences in developmental (e.g., intrauterine, family) environment between the two groups. Certainly, it is well accepted that on average, twins are more likely to be born premature and have lower birth weights than singleton pregnancies.1,2 The representativeness of twins for the general population for a trait found to be associated with such neonatal outcomes therefore requires cautious interpretation. Further to this, the “Developmental Origins of Health and Disease (DOHaD),” or “Barker hypothesis” is illustrative in postulating the epidemiologic evidence supporting an inverse association between birth weight and adult cardiovascular disease is more a causal effect governed by adverse prenatal exposures.3 In a recent twin study, however, de Geus et al. found no evidence in favor of this theory, with no difference in blood pressure observed between twins and their siblings.4 In fact it is likely that common genetic factors may play a mediating role in this relationship.5
Differences in placentation between monozygotic (MZ) and dizygotic (DZ) twins also have the potential to impact the validity of extrapolation from twin findings. While all DZ twins have separate placentas (dichorionic), approximately 60% of MZ pregnancies are monochorionic, which carries an increased risk of vascular abnormalities during gestation. Asymmetric fetal sharing of the common placenta often results in birth weight differences between twins and may subsequently affect postnatal growth.6 Given that placentation data are infrequently collected, another concern relates to potential disparities between monochorionic and dichorionic MZ trait correlations, which may challenge the most fundamental assumptions of the classic twin method. Of all twin types, dichorionic MZ or DZ twins carry the lowest risk of perinatal mortality at approximately 9%; however, this still remains greater than that observed with singleton pregnancies.7
There is a paucity of information in the literature considering the generalizability of twin data. Silventoinen et al. examined the heritability of body size and muscle strength in a prodigious cohort of Swedish males and found that differences between singletons and twins can persist into adult life with twins being shorter, lighter, and demonstrating lower muscle strength than singletons.8 In addition, singletons showed more variation in weight and strength measures compared with twins with known zygosity, probably resulting from selection bias due to nonparticipation. Subsequently, previous heritability estimates for these anthropometric parameters may have been spuriously inflated. The use of unrelated singletons can complicate the statistical modeling given the lack of matching for genetic and family environment. Using siblings of twins (“extended twin design”) largely overcomes this difficulty while increasing the statistical power of the study, however, differences in trait values between these groups would obviously negate this advantage.
We conducted a large twin study to evaluate genetic and environmental determinants of ocular biometry and eye disease with a particular interest in glaucoma and myopia endophenotypes.9 In addition to determining heritability estimates, we performed microsatellite linkage10,11 and a genome-wide association study (GWAS)12,13 on this cohort. Where available, siblings have been examined as part of the Brisbane Adolescent Twin Study under an extended family study design. Little information is available regarding the generalizability of twin data for ocular biometric traits. To date there has been only one study specifically investigating the representativeness of twins to the general population and this was for refractive error.14 We had previously shown no difference in retinal blood vessel diameter measurements between the two groups but wished to extend this to all the major biometric measures.
Materials and Methods
Participants
Twin pairs were identified from two cohorts, the Twins Eye Study in Tasmania (TEST),9 and the Australian Twins Eye Study (ATES).15 The relevant ethics committees of the Royal Victorian Eye and Ear Hospital, University of Tasmania, and Queensland Institute of Medical Research approved the study. The study adhered to the tenets of the Declaration of Helsinki. Data were available for 2053 individuals, including 929 twin pairs (381 MZ, 548 DZ) and 195 nontwin siblings (102 siblings of MZ pairs and 93 siblings of DZ pairs). The vast majority of participants (>95%) were Caucasian in origin. Subjects who had ocular or systemic disease preventing a complete ophthalmic examination were subsequently excluded from the analysis.
Traits Examined
All twins and siblings participating in the study underwent a comprehensive clinical examination that included anterior segment examination, corneal pachymetry, intraocular pressure (IOP) measurement, autorefraction, and a mydriatic optic disc assessment. The same measurement methods and instruments were used in both groups. Simultaneous stereoscopic optic disc photographs were taken with a fundus camera (3-Dx/F; Nidek, Gamagori, Japan) on 35-mm slide film (Ektachrome; Eastman Kodak, Melbourne, Australia). For all twin pairs, zygosity was confirmed by DNA analysis of short tandem-repeat (STR) and subsequent GWAS.
A series of 13 ocular biometric traits were selected for analysis: interpupillary distance (IPD), visual acuity (logMAR), spherical equivalent refractive error, corneal curvature, axial length, anterior chamber depth (ACD), central corneal thickness (CCT), IOP, optic disc, cup and rim areas, and measures of retinal vascular caliber, central retinal arteriolar equivalent (CRAE) and central retinal venular equivalent (CRVE). The mean values of right and left eyes were used in the analysis. Full details of trait examination protocols have been described previously.9
Statistical Analysis
Data management and statistical tests were performed in the R statistical environment.16 Descriptive statistics were calculated for each trait in addition to measures of spread, including kurtosis and skewness. Distributions were tested for normality with the Shapiro-Wilks test and were considered significantly different from normal for P < 0.05. Boxplots were constructed for each trait for twin (stratified by zygosity) and sibling data. Unless otherwise indicated data are presented as mean ± SD.
A fundamental assumption of genetic modeling in the classic twin design is that the means and variances of the traits are not significantly different by birth order and zygosity. The discovery of such differences may be indicative of ascertainment bias, measurement error, or natural variation. On the other hand, if siblings can be shown to have the same mean-variance structure as their twin counterparts, there is sound reasoning in asserting the generalizability of twin data for that trait (in the context of a heritability study, the equal environment assumption should also be satisfied).17 An elegant method for assessing these distributional moments is to use structural equation modeling based on maximum likelihood, the primary advantage being that the technique allows parameter estimation rather than simple parameter calculation.18
Data for each trait were z-transformed and winsorized such that the extreme 0.3% of values in this study (i.e., those exceeding ±3 SDs from the mean) were replaced with ±3. Winsorization is a common statistical technique for dealing with data outliers, such that distributional tail values are constrained to some prespecified percentile. Data were then subset into eight groups based on zygosity and sex: monozygotic females (MZF), monozygotic males (MZM), dizygotic females (DZF), dizygotic males (DZM), dizygotic opposite sex pairs with females first-born (DZFM) and males first-born (DZMF), female siblings (Sib F) and male siblings (Sib M). Software (OpenMx)19 was used to test the assumption that the means and variances for each trait did not differ between individuals within and across groups. In the first instance a saturated (control) model was fitted to the raw data and all parameters freely estimated. Twelve univariate, nested models were subsequently fitted in a stepwise fashion, with each applying additional parameter constraints compared with the previous model (Table 1). In the first nested model, the intrapair twin (t) means were constrained to be equal within same sex groups (i.e., MZFt1 = MZFt2, MZMt1 = MZMt2, DZFt1 = DZFt2, and DZMt1 = DZMt2) to examine birth order effects. In the second model, equality constraints were also placed on the means across same sex groups (i.e., MZF = DZF and MZM = DZM) to test zygosity effects. Model 3a and 3b examine differences between members of opposite and same sex twin pairs; 3a equates means within females and males across opposite sex pairs (i.e., DZFMt1 = DZMFt2 and DZFMt2 = DZMFt1) and 3b additionally across same sex pairs (i.e., MZF = DZF = DZFMt1 = DZMFt2 and MZM = DZM = DZFMt2 = DZMFt1). The fourth model (to test twin-sibling differences) further constrains the means of twins to be the same as their siblings within females and males (i.e., MZF = DZF = DZFMt1 = DZMFt2 = Sib F and MZM = DZM = DZFMt2 = DZMFt1 = Sib M). The final means model contains only a mean for males and a mean for females and are subsequently equated to produce one mean for the cohort. The same series of models are then retested whereby variances are constrained instead of means.
Table 1.
Hypotheses of Means (M) and Variances (V) Tested for All Traits
| H0M,V |
H1M,V |
H2M,V |
H3aM,V |
H3bM,V |
H4M,V |
H5M,V |
||||||||
|---|---|---|---|---|---|---|---|---|---|---|---|---|---|---|
| Tw1 | Tw2 | Tw1 | Tw2 | Tw1 | Tw2 | Tw1 | Tw2 | Tw1 | Tw2 | Tw1 | Tw2 | Tw1 | Tw2 | |
| MZF | 1 | 2 | 1 | 1 | 1 | 1 | 1 | 1 | 1 | 1 | 1 | 1 | 1 | 1 |
| MZM | 3 | 4 | 2 | 2 | 2 | 2 | 2 | 2 | 2 | 2 | 2 | 2 | 1 | 1 |
| DZF | 5 | 6 | 3 | 3 | 1 | 1 | 1 | 1 | 1 | 1 | 1 | 1 | 1 | 1 |
| DZM | 7 | 8 | 4 | 4 | 2 | 2 | 2 | 2 | 2 | 2 | 2 | 2 | 1 | 1 |
| DZFM | 9 | 10 | 5 | 6 | 3 | 4 | 3 | 4 | 1 | 2 | 1 | 2 | 1 | 1 |
| DZMF | 11 | 12 | 7 | 8 | 5 | 6 | 4 | 3 | 2 | 1 | 2 | 1 | 1 | 1 |
| Sib F | 13 | 9 | 7 | 5 | 3 | 1 | 1 | |||||||
| Sib M | 14 | 10 | 8 | 6 | 4 | 2 | 1 | |||||||
Hypotheses tested: H0M,V, saturated model with all parameters freely estimated; H1M, equal means across twin order (only same sex twin groups); H2M, equal means across same sex twin groups; H3aM, equal means within twin females and twin males across opposite sex pairs; H3bM, equal means within twin females and twin males across same sex and opposite sex pairs; H4M, equal means across twins and siblings (same sex only); H5M, equal means across females and males; H1V, equal variances across twin order (only same sex twin groups); H2V, equal variances across same sex twin groups; H3aV, equal variances within twin females and twin males across opposite sex pairs; H3bV, equal variances within twin females and twin males across same sex and opposite sex pairs; H4V, equal variances across twins and siblings (same sex only); H5V, equal variances across females and males; Tw1, twin 1; Tw2, twin 2.
Each of the nested submodels was then compared to the saturated model by hierachical χ2 tests. Twice the difference between log-likelihood values of the nested and saturated models is asymptotically distributed as χ2 with degrees of freedom (df) equal to the difference in parameters being estimated. The submodel with the lowest difference in log-likelihood is considered to fit best and reflects model parsimony (fewest number of freely estimated parameters) indicated by a nonsignificant difference between the nested and saturated fits.20
All anthropometric and ocular traits were adjusted for covariate effects in this study. The effect of birth weight on each trait was investigated by comparing the saturated model to an equivalent model with this parameter removed. The difference in log-likelihood between the two models therefore provides an indication of whether birth weight may be associated with the phenotype under examination. If the statistical fit deteriorated (i.e., significant difference in log-likelihood), birth weight was retained as a covariate in subsequent hypothesis testing, otherwise it was eliminated. Additionally, age, age2, sex*age, and sex* age2 were modeled as fixed effects (regressed from the mean) for each phenotype. The inclusion of age as a quadratic covariate was to allow for nonlinear age effects, and was considered important as our cohort displayed large age variation. The addition of sex interactions are necessary as there are no a priori reasons to expect the influence of age to be the same across sex.
The software (OpenMx) does not permit missing covariate data, thus incomplete data (birth weight and gestation data only) for a subject were replaced with the mean of the entire cohort. To minimize type I error resulting from the large number of tests performed (219), a Bonferroni correction was applied (0.05/219) with statistical significance defined as P ≤ 0.00023. Significant twin-sibling differences were described by Cohen's d, an effect size invariant to scaling that is measured in SD units.21 Cohen's d is calculated as: d = (μSib − μTwin)/σ, where μSib is the mean of sibling group, μTwin is the mean of the twin group and σ is the pooled SD. Cohen proposed that d values of 0.2, 0.5, and 0.8 represent small, medium, and large effect sizes respectively.
Results
Descriptive statistics for all participants for age, birth weight, gestation, anthropometric, and ocular biometric traits investigated are shown in Table 2. The mean ± SD age across all participants was 20.6 ± 11.8 years (range, 5 to 90 years). Figure 1a shows a box plot of differences in age between twins and siblings. The distribution of age was positively skewed with MZ twins on average two years older than their DZ counterparts. Birth weight and gestation data were available for 82% and 89% of all participants, respectively. The average birth weight was 2.56 kg and gestation 37 weeks; however, as discussed this depends significantly on the type of pregnancy. The box plot for birth weight (Fig. 1b) shows the expected pattern of lighter MZ twins (2.4 ± 0.63 kg) compared with DZ twins (2.54 ± 0.56 kg) and siblings (3.43 ± 0.59 kg). Gestation period (Fig. 1c) follows a similar trend with MZ twins (36.5 ± 3.22 weeks) being born earlier than DZ twins (37 ± 2.83 weeks) and siblings (39.7 ± 1.54 weeks). The box plots for adult height (Fig. 1d) and weight (Fig. 1e) are similar between subgroups.
Table 2.
Descriptive Statistics of Traits Examined
| Trait | n (Grand MZ/DZ/Sib) | Mean (Grand MZ/DZ/Sib) | SD (Grand MZ/DZ/Sib) | Min | Max | Skew | Kurtos | Shapiro-Wilks P |
|---|---|---|---|---|---|---|---|---|
| Age, y | 2053 (762/1096/195) | 20.64 (20.67/18.90/22.48) | 11.78 (14.17/10.46/5.03) | 5 | 90 | 2.02 | 5.61 | <0.0001 |
| Birth weight, kg | 1693 (644/911/138) | 2.56 (2.40/2.54/3.43) | 0.65 (0.63/0.56/0.59) | 0.67 | 4.76 | −0.01 | 0.21 | <0.001 |
| Gestation, weeks | 1819 (671/1013/135) | 37.04 (36.51/37.03/39.72) | 3.02 (3.22/2.83/1.54) | 24 | 42 | −1.17 | 1.35 | <0.0001 |
| Adult height, cm | 1464 (540/747/177) | 170.67 (169.22/171.43/171.91) | 10.04 (10.12/10.05/9.25) | 140 | 200 | 0.11 | −0.44 | <0.0001 |
| Adult weight, cm | 1481 (546/761/174) | 67.95 (67.14/67.75/71.39) | 15.30 (14.74/15.08/17.44) | 34 | 172 | 1.14 | 2.78 | <0.0001 |
| IPD, mm | 1735 (636/912/187) | 60.95 (60.66/60.73/63.03) | 3.79 (3.97/3.62/3.34) | 44 | 74 | −0.25 | 0.84 | <0.0001 |
| VA, logMAR | 2019 (750/1077/192) | −0.03 (−0.03/−0.03/−0.09) | 0.14 (0.14/0.15/0.09) | −0.42 | 1.1 | 2.14 | 10.52 | <0.0001 |
| SE, D | 2041 (754/1092/195) | −0.17 (−0.26/−0.04/−0.52) | 1.47 (1.42/1.48/1.48) | −17.75 | 6.44 | −2.1 | 16.63 | <0.0001 |
| CC, D | 1900 (698/1007/195) | 43.97 (44.11/43.9/43.8) | 1.49 (1.52/1.46/1.47) | 39.44 | 51.75 | 0.19 | 0.52 | <0.001 |
| AL, mm | 1839 (664/981/194) | 23.20 (23.22/23.14/23.48) | 0.87 (0.89/0.83/0.94) | 20.02 | 28.29 | 0.45 | 2.48 | <0.0001 |
| ACD, mm | 1000 (404/456/140) | 3.61 (3.62/3.62/3.69) | 0.34 (0.35/0.94/0.28) | 1.79 | 4.5 | −1.44 | 4.59 | <0.0001 |
| CCT, μm | 1852 (664/994/194) | 544.02 (542.68/544.22/547.57) | 34.73 (35.12/34.27/35.58) | 381.5 | 679.5 | 0.21 | 0.75 | <0.0001 |
| IOP, mmHg | 2012 (745/1072/195) | 15.90 (16.17/15.52/16.62) | 3.00 (2.82/3.1/2.77) | 6 | 26 | 0.01 | −0.07 | <0.001 |
| Disc area, mm2 | 1584 (605/857/122) | 2.08 (2.07/2.09/2.11) | 0.40 (0.41/0.39/0.39) | 1.15 | 4.04 | 0.29 | 0.05 | <0.0001 |
| Cup area, mm2 | 1584 (605/857/122) | 0.45 (0.48/0.43/0.48) | 0.29 (0.30/0.30/0.25) | 0.01 | 2.1 | 0.14 | −0.19 | 0.003 |
| Rim area, mm2 | 1584 (605/857/122) | 1.63 (1.59/1.65/1.63) | 0.32 (0.33/0.31/0.3) | 0.54 | 3.11 | 0.25 | 0.29 | <0.0001 |
| CRAE | 2016 (753/1069/194) | 165.08 (164/165.91/164.47) | 13.63 (14.05/13.32/13.45) | 113.69 | 236.94 | 0.25 | 0.45 | 0.004 |
| CRVE | 2016 (753/1069/194) | 248.64 (247.39/249.63/248.06) | 18.85 (18.8/18.61/20.08) | 140.26 | 325.7 | 0 | 0.9 | <0.0001 |
AL, axial length; CC, corneal curvature; D, diopter; Min, minimum; Max, maximum; SE, spherical equivalent refractive error; Sib, sibling; VA, visual acuity.
Figure 1.
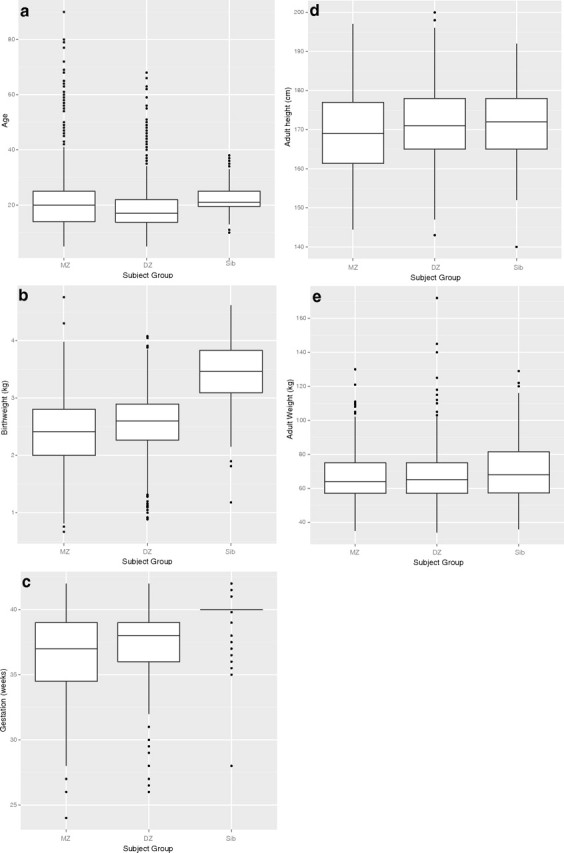
Box plots for age, birth, and anthropometric traits for twins (stratified by zygosity) and siblings: (a) age, (b) birth weight, (c) gestation, (d) adult height, and (e) adult weight.
Distribution of Ocular Biometry
The mean IPD of all participants was approximately 61 mm. On average, siblings were noted to have IPDs 2.3 mm larger (63 mm) than twins of either zygosity (Fig. 2a). The distributions for visual acuity and spherical equivalent refractive error were the most kurtotic of all examined. Siblings had lower average measures on both visual acuity (i.e., better vision) (Fig. 2b) and refractive error (Fig. 2c) (−0.52 D) compared with MZ (−0.26 D) or DZ twins (−0.04). Axial length (Fig. 2e) displayed a complementary trend to refractive error, with siblings having longer eyes (23.48 mm) than MZ (23.22 mm) and DZ (23.14 mm) twins. Similarly, siblings were observed to have deeper ACDs (Fig. 2f) (3.69 mm) and higher IOPs (Fig. 2h) (16.6 mm Hg) than either MZ (3.62 mm, 16.2 mm Hg) or DZ (3.62 mm, 15.5 mm Hg) twins. For the remaining traits, twins and siblings appeared similar in their distributions for corneal curvature (Fig. 2d), CCT (Fig. 2g), optic disc (Fig. 2i), cup (Fig. 2j) and rim (Fig. 2k) areas and for both measures of retinal vascular caliber, CRAE (Fig. 2l) and CRVE (Fig. 2m). For all traits, the Shapiro-Wilks test was significant for distributional departure from normality.
Figure 2.
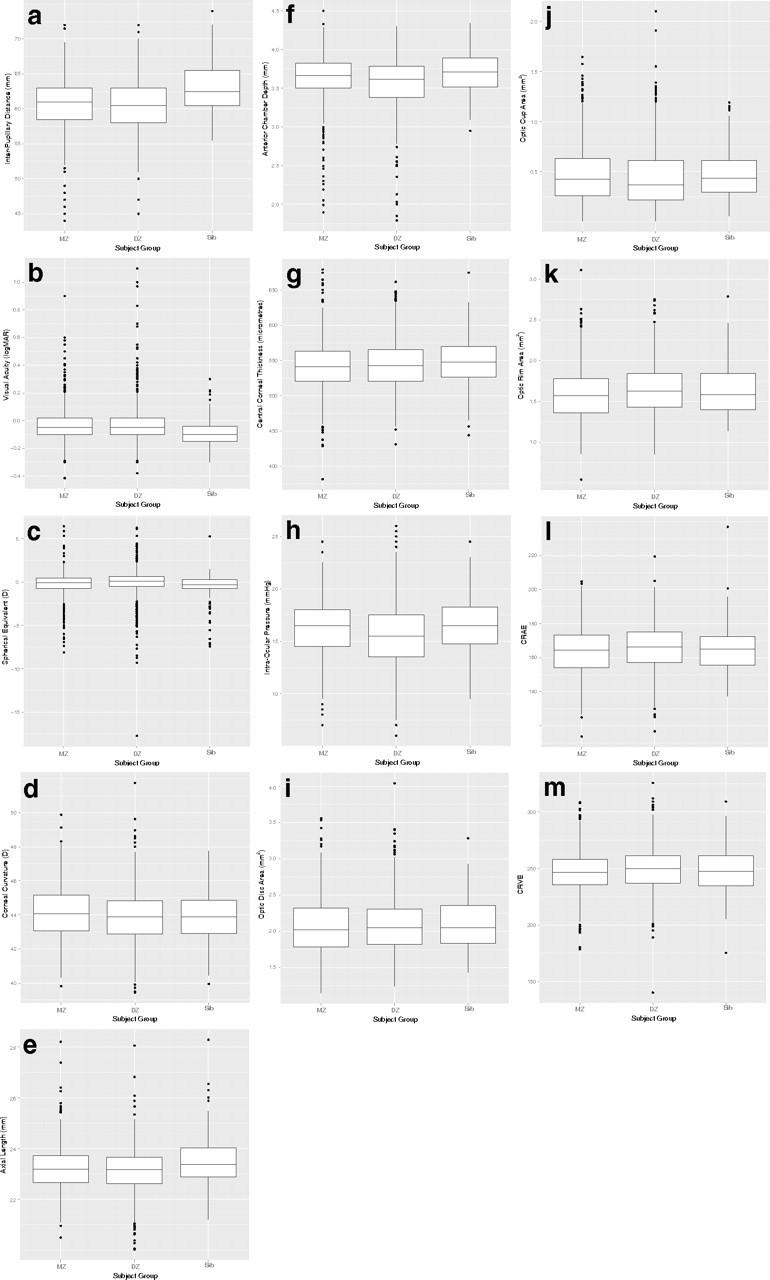
Box plots for ocular biometric traits for twins (stratified by zygosity) and siblings: (a) interpupillary distance, (b) visual acuity, (c) spherical equivalent, (d) corneal curvature, (e) axial length, (f) anterior chamber depth, (g) central corneal thickness, (h) intraocular pressure, (i) optic disc area, (j) optic cup area, (k) optic rim area, (l) CRAE, and (m) CRVE.
Equability of Means and Variances
The influence of twin order, zygosity, sex, and twin-sibling differences for each of the traits examined is shown in Table 3. When we equated the means and variances for birth weight across twins and siblings (H4M,V), significant differences in log likelihood were observed compared with the saturated model allowing freely estimated parameters. Thus, as expected, differences exist in birth weight between the two groups. Poor model fits were similarly noted for gestation period when attempting to constrain twin-sibling group means. Adult height and weight was equivocal between subgroups; however, significant sex differences were observed (H5M) with males both taller and heavier than females.
Table 3.
Likelihood Ratio χ2 Values for Hypotheses Regarding Means and Variances of Birth, Anthropometric, and Ophthalmic Traits in 929 Twin Pairs and 195 Siblings
| Hypotheses | df | Birth Weight* | Gestation* | Adult Height | Adult Weight | Difference Log Likelihood (LL) Values |
IOP | Disc Area | Cup Area | Rim Area | ||||||
|---|---|---|---|---|---|---|---|---|---|---|---|---|---|---|---|---|
| IPD† | VA | SE | CC† | AL† | ACD | CCT | ||||||||||
| Remove BW | 48.72‡ | 0.74 | 17.31‡ | 1.22 | 0.14 | 67.8‡ | 30.67‡ | 0.04 | 1.52 | 0.87 | 0.34 | 1.00 | 1.40 | |||
| H1M | 4 | 9.98 | 1.89 | 5.21 | 4.16 | 9.80 | 10.92 | 11.85 | 18.36 | 5.24 | 11.36 | 2.05 | 1.20 | 2.86 | 2.59 | 2.02 |
| H2M | 2 | 11.95 | 9.68 | 13.07 | 6.00 | 24.72‡ | 118.21‡ | 62.32‡ | 17.62‡ | 1.95 | 36.61‡ | 2.90 | 17.10 | 1.73 | 1.82 | 1.55 |
| H3aM | 2 | 0.16 | 0.43 | 0.76 | 3.04 | 4.67 | 1.54 | 0.89 | 0.65 | 1.90 | 1.30 | 1.94 | 0.18 | 0.18 | 0.21 | 0.30 |
| H3bM | 2 | 2.19 | 2.47 | 5.51 | 1.59 | 2.28 | 13.21 | 2.97 | 6.55 | 1.09 | 4.82 | 13.44 | 4.32 | 3.41 | 2.13 | 1.28 |
| H4M | 2 | 147.58‡ | 229.32‡ | 11.23 | 4.10 | 21.15‡ | 54.50‡ | 5.47 | 12.52 | 20.10‡ | 11.37 | 0.59 | 35.84‡ | 2.70 | 7.78 | 5.77 |
| H5M | 1 | 20.01‡ | 4.99 | 153.09‡ | 45.54‡ | 56.30‡ | 3.17 | 1.19 | 2.82 | 1.75 | 0.02 | 0.35 | 0.45 | 2.31 | 0.24 | 3.54 |
| H1V | 4 | 1.84 | 3.16 | 4.45 | 9.10 | 3.03 | 24.18‡ | 12.84 | 4.26 | 3.54 | 25.18‡ | 2.39 | 0.18 | 1.08 | 0.75 | 5.71 |
| H2V | 2 | 10.75 | 20.55‡ | 1.31 | 3.14 | 2.12 | 2.94 | 5.89 | 1.71 | 6.70 | 3.70 | 0.81 | 5.41 | 0.52 | 1.57 | 2.10 |
| H3aV | 2 | 2.67 | 0.38 | 2.51 | 1.64 | 0.04 | 3.28 | 0.47 | 2.05 | 3.47 | 1.21 | 1.01 | 0.11 | 3.92 | 1.00 | 1.39 |
| H3bV | 2 | 0.73 | 0.76 | 1.65 | 0.51 | 4.01 | 4.71 | 2.45 | 0.03 | 3.17 | 0.18 | 3.37 | 0.57 | 2.56 | 0.38 | 4.37 |
| H4V | 2 | 87.19‡ | 0.30 | 1.07 | 3.53 | 7.27 | 16.43 | 0.38 | 2.21 | 2.26 | 13.21 | 2.75 | 1.45 | 1.88 | 6.98 | 1.57 |
| H5V | 1 | 0.92 | 0.91 | 5.96 | 30.14‡ | 4.90 | 4.02 | 46.38‡ | 1.21 | 1.69 | 3.49 | 1.79 | 3.96 | 0.04 | 3.90 | 0.84 |
The effect of birth weight (BW) was examined by comparing the fit of the saturated model to a model with the parameter removed. If the difference in LL was significant, BW was retained as a covariate in hypothesis testing, otherwise it was eliminated. All anthropometric and opthalmic traits have been adjusted for age, age2, sex*age, and sex*age2.
Unadjusted for covariate effects.
Additionally adjusted for birth weight.
P < 0.00023.
Birth weight was found to be associated with adult height, IPD, corneal curvature, axial length, and CRAE, and was subsequently retained as a covariate in hypothesis testing for these traits. Of the ocular biometric traits, poor model fits were predominantly confined to hypotheses concerning means across zygosity (H2M) and twin-sibling groups (H4M). Significant differences between twins and siblings were found for IPD (Cohen's d, 0.63), visual acuity (Cohen's d, 0.42), axial length (Cohen's d, 0.29), and IOP (Cohen's d, 0.24). When body height was included as an additional covariate for the analysis of axial length, twin-sibling differences in the parameter were no longer significant. The distributional differences described above for refractive error and ACD were not significant in model testing. Corneal curvature, CCT, optic disc, and retinal vascular calibers did not differ significantly between the two groups. Additionally, a highly significant sex difference (H5aM) was noted for IPD, with larger mean values for males compared with females. Differences between members of opposite and same sex pairs (H3aM,V and H3bM,V) were generally negligible.
Discussion
The search for genetic variants directly associated with or causing disease has taken on renewed vigor with the recent advent of high-throughput molecular genotyping technologies. Justification for such studies usually begins with validation that the trait under investigation has a heritable component. Heritability, a commonly misunderstood concept, refers to the proportion of phenotypic variation of a trait in the population studied that is due to genetic factors (the interested reader is referred to a recent review article for a more detailed treatment of heritability and related studies in the field of ophthalmology).22 Given that the majority of ophthalmic heritability studies are based on twin data,22 a reasonable inquiry relates to the generalizability of the results to the population at large. In this study we characterized the distributions of a series of birth, anthropometric, and 13 ocular biometric traits in a large cohort of twins and their siblings. Importantly, the assumption of twin representativeness for the general population was tested by comparing distributional parameters between the two groups.
Considering birth parameters, we confirm the previously reported differences in gestation and birth weight, with siblings more likely to be born full-term and to be heavier than twin neonates. A confounding issue regarding differences of gestation duration relates to high prevalence rates of induced or planned cesarean sections in multiple births. Given that twins also have a greater risk of perinatal mortality (labor and delivery complications) than singletons,23 increased intervention to deliver twins earlier in the third trimester has become common.24 Our results for adult height and weight twin-sibling trends are similarly in accordance with other published data. In a comparison of female twins from the UK Twin Registry and unrelated singletons, Andrew et al. found DZ twins were on average 600 g lighter than the singleton cohort, and MZ twins were consistently lighter than their DZ counterparts across all age strata.25 With regards to height, anthropometric data for participants in the Netherlands Twin Registry found twins and siblings attained similar height in adulthood, but siblings were heavier than twins and interestingly also had increased weight and body mass index compared with population-based data from national reference growth charts.26 Although our data failed to show such an association, it is tenable that this disparity is related to differences in birth weight, given the documented positive correlation between neonatal and adult weights.27
In relation to ocular biometry, siblings seem to have better visual acuity, longer eyes, and greater IPDs than twins. Comparative twin-sibling data for the ocular parameters investigated in this study are scant; however, several published reports have examined associations with birth weight and gestational age largely in the context of retinopathy of prematurity (ROP). In one cohort of low birth weight (<1700 g) participants born with or without ROP and subsequently examined in adolescence, O'Connor et al. observed higher prevalence of visual impairment compared with full-term infants,28 with similar findings reported in other studies.29,30 The pathophysiology underlying maldevelopment of visual function in preterm infants is poorly understood. Fielder and Moseley postulated that exposure of immature tissues to environmental illumination may be associated with subtle ocular morbidities including mild vision reduction and arrested eye growth.31 The birth weights of newborns in many of these studies were very low and are unlikely to be directly comparable with that of our participants, but they may be indicative of potential trends.
Our finding of larger eyes and IPDs in full-term siblings is in accordance with previously published data. In one series of children who developed ROP, axial lengths were shorter and corneal curvatures larger than in preterm controls delivered without the condition.32 Cook et al. observed similar results for axial length and corneal curvature, in addition to shallower anterior chambers in low birth weight infants compared with full-term controls.33 Low birth weight has also been associated with smaller IPDs.34 Taken together, these are not unexpected findings, given that birth size naturally moderates head size and associated oculometric parameters.35 There also appears to be a pleiotropic genetic effect for axial length and ACD with twin data suggesting that shared genes are responsible for the phenotypic correlations noted in one study.36 Additionally, recent work by Zhang et al., has shown that axial length is associated with height and that covariation of these parameters is also driven by shared genes.37 On this basis we reanalyzed axial length including height as an additional covariate; the difference in log likelihood (H4M) was 15.31 and no longer significant. Thus, twin-sibling differences in axial length may be explained in part by differences in body height. It may be prudent to adjust for this anthropometric trait in further research investigating the genetic characteristics of axial length that employ twin and nontwin subjects.
The difference in refractive error between twins and siblings in our study was not significant in model testing. However, the longer axial length observed in siblings concurs with them being more myopic, although interestingly we did not observe compensatory disparities in corneal curvature as others have noted.32,33 Our finding of equivocal refractive error is consistent with that reported in the literature. O'Connor et al. noted that preterm children were at higher risk for the development of all forms of refractive error.38 In another cohort of twins, triplets, and singletons, no significant differences in the prevalence of refractive error between multiples and singletons was detected.39 A previous study investigating the representative of twins for the ocular parameter, refractive error, did not show any significant difference between twins and singletons for myopia, although small differences were observed for hyperopia and astigmatism.14
The distributions of IOP among twins and siblings in this study are hard to explain and may reflect the difficulty in obtaining accurate IOP measurements based on a single reading.40 While the effect size describing the difference between the two groups was small (Cohen's d, 0.24), there are no physiological grounds for the observed variation.
Our results showed no differences between twins and siblings for a number of ocular traits including: corneal curvature; CCT; optic disc; cup and rim area; and retinal vessel vascular calibers. A recent study investigating the association between birth weight and optic nerve head parameters did find low birth weight was associated with smaller disc areas, larger cup areas, and larger cup/disc ratios in children aged 12 years.41 While our data did not reflect this trend, the possibility that fetal growth restriction may affect optic disc parameters and subsequent long-term glaucoma risk bears consideration. Indeed, using the same cohort described in this article, Sun et al. found that narrower retinal arteriole caliber in young twins were associated with smaller birth size, thus adding further support for the DOHaD hypothesis.42
This work involves multiple comparisons and P values were adjusted accordingly. A more conservative α level was selected as approximately 110 significant results were initially found at α = 0.05 when approximately 19 would be expected to be due to type I errors. A limitation of this study therefore relates to decreased power to detect differences, particularly for trait differences of small magnitude. For example, power to detect an effect size difference of 0.5 is 99% compared with 15% for an effect size of 0.2, given α = 0.00023. However, a statistically significant finding may not translate to a clinically relevant difference; our goal was to ensure moderate to larger effect sizes were detectable in the traits examined and we are confident this is the case in the present study.
In conclusion, twins are representative of the general population for many, but not all measures of ocular biometry. Thus, in pooling data for genetic studies, consideration needs to be given to traits that may differ and the generalizability of twin-related findings should be reviewed. One potential method may be to account for twin data by incorporating twin status as a covariate in population-based analyses such as GWAS. Furthermore, birth weight differences between siblings and twins do not appear to account for the differences in ocular biometry measures observed in this study.
Footnotes
Supported by the Ophthalmic Research Institute of Australia and the Australian National Health and Medical Research Council. PGS is the recipient of an NHMRC postgraduate scholarship. SEM is supported by an NHMRC Sidney Sax Fellowship. CS is supported by an Australian NHMRC Public Health Postdoctoral Research Fellowship. CJH is funded by the UK National Institute for Health Research. DAM is a Pfizer Australia research fellow. CERA receives Operational Infrastructure Support from the Victorian Government.
Disclosure: P.G. Sanfilippo, None; S.E. Medland, None; A.W. Hewitt, None; L.S. Kearns, None; J.B. Ruddle, None; C. Sun, None; C.J. Hammond, None; T.L. Young, None; N.G. Martin, None; D.A. Mackey, None
References
- 1. Min SJ, Luke B, Gillespie B, et al. Birth weight references for twins. Am J Obstet Gynecol. 2000;182:1250–1257 [DOI] [PubMed] [Google Scholar]
- 2. Kiely JL. The epidemiology of perinatal mortality in multiple births. Bull N Y Acad Med. 1990;66:618–637 [PMC free article] [PubMed] [Google Scholar]
- 3. Barker DJ. In utero programming of chronic disease. Clin Sci. 1998;95:115–128 [PubMed] [Google Scholar]
- 4. de Geus EJ, Posthuma D, Ijzerman RG, Boomsma DI. Comparing blood pressure of twins and their singleton siblings: being a twin does not affect adult blood pressure. Twin Res. 2001;4:385–391 [DOI] [PubMed] [Google Scholar]
- 5. IJzerman RG, Stehouwer CD, Boomsma DI. Evidence for genetic factors explaining the birth weight-blood pressure relation. Analysis in twins. Hypertension. 2000;36:1008–1012 [DOI] [PubMed] [Google Scholar]
- 6. Pietilainen KH, Kaprio J, Rasanen M, Rissanen A, Rose RJ. Genetic and environmental influences on the tracking of body size from birth to early adulthood. Obes Res. 2002;10:875–884 [DOI] [PubMed] [Google Scholar]
- 7. Benirschke K. Multiple gestation. In: Resnik R, Creasy R, Iams J. eds. Maternal-Fetal Medicine: Principles and Practice. Philadelphia: W. B. Saunders Company; 2004:55–62 [Google Scholar]
- 8. Silventoinen K, Magnusson PK, Tynelius P, Kaprio J, Rasmussen F. Heritability of body size and muscle strength in young adulthood: a study of one million Swedish men. Genet Epidemiol. 2008;32:341–349 [DOI] [PubMed] [Google Scholar]
- 9. Mackey DA, MacKinnon JR, Brown SA, et al. Twins Eye Study in Tasmania (TEST): rationale and methodology to recruit and examine twins. Twin Res Hum Genet. 2009;12:441–454 [DOI] [PMC free article] [PubMed] [Google Scholar]
- 10. Sun C, Zhu G, Wong TY, et al. Quantitative genetic analysis of the retinal vascular caliber: the Australian Twins Eye Study. Hypertension. 2009;54:788–795 [DOI] [PMC free article] [PubMed] [Google Scholar]
- 11. Zhu G, Hewitt AW, Ruddle JB, et al. Genetic dissection of myopia: evidence for linkage of ocular axial length to chromosome 5q. Ophthalmology. 2008;115:1053–1057 [DOI] [PubMed] [Google Scholar]
- 12. Macgregor S, Hewitt AW, Hysi PG, et al. Genome-wide association identifies ATOH7 as a major gene determining human optic disc size. Hum Mol Genet. 2010;19:2716–2734 [DOI] [PMC free article] [PubMed] [Google Scholar]
- 13. Lu Y, Dimasi DP, Hysi PG, et al. Common genetic variants near the Brittle Cornea Syndrome locus ZNF469 influence the blinding disease risk factor central corneal thickness. PLoS Genet. 2010;6:e1000947. [DOI] [PMC free article] [PubMed] [Google Scholar]
- 14. Hur YM, Zheng Y, Huang W, Ding X, He M. Comparisons of refractive errors between twins and singletons in Chinese school-age samples. Twin Res Hum Genet. 2009;12:86–92 [DOI] [PubMed] [Google Scholar]
- 15. Wright MJ, Martin NG. Brisbane adolescent twin study-outline of study methods and research projects. Australian Journal of Pyschology. 2004;56:65–78 [Google Scholar]
- 16. The R project for statistical computing. Available at: http://www.R-project.org Accessed July 6, 2011
- 17. Kyvic KO. Generalisability and assumptions of twin studies. In: Spector TD, Sneider H, MacGregor AJ. eds. Advances in Twin and Sib-Pair Analysis. London: Greenwich Medical Media; 2000:67–77 [Google Scholar]
- 18. Posthuma D, Boomsma DI. Mx scripts library: structural equation modeling scripts for twin and family data. Behav Genet. 2005;35:499–505 [DOI] [PubMed] [Google Scholar]
- 19. OpenMx – Advanced Structural Equation Modeling. Available at: http://openmx.psyc.virginia.edu Accessed July 6, 2011
- 20. Neale MC, Cardon LR. Methodology for Genetic Studies of Twins and Families. Dordrecht: Kluwer Academic Publishers; 1992 [Google Scholar]
- 21. Cohen J. A power primer. Psychol Bull. 1992;112:155–159 [DOI] [PubMed] [Google Scholar]
- 22. Sanfilippo PG, Hewitt AW, Hammond CJ, Mackey DA. The heritability of ocular traits. Surv Ophthalmol. 2010;55:561–583 [DOI] [PubMed] [Google Scholar]
- 23. Barrett JF. Delivery of the term twin. Best Pract Res Clin Obstet Gynaecol. 2004;18:625–630 [DOI] [PubMed] [Google Scholar]
- 24. Joseph KS, Allen AC, Dodds L, Vincer MJ, Armson BA. Causes and consequences of recent increases in preterm birth among twins. Obstet Gynecol. 2001;98:57–64 [DOI] [PubMed] [Google Scholar]
- 25. Andrew T, Hart DJ, Snieder H, de Lange M, Spector TD, MacGregor AJ. Are twins and singletons comparable? A study of disease-related and lifestyle characteristics in adult women. Twin Res. 2001;4:464–477 [DOI] [PubMed] [Google Scholar]
- 26. Estourgie-van Burk GF, Bartels M, Boomsma DI, Delemarre-van de Waal HA. Body size of twins compared with siblings and the general population: from birth to late adolescence. J Pediatr. 2010;156:586–591 [DOI] [PubMed] [Google Scholar]
- 27. Whitaker RC, Dietz WH. Role of the prenatal environment in the development of obesity. J Pediatr. 1998;132:768–776 [DOI] [PubMed] [Google Scholar]
- 28. O'Connor AR, Stephenson T, Johnson A, et al. Long-term ophthalmic outcome of low birth weight children with and without retinopathy of prematurity. Pediatrics. 2002;109:12–18 [DOI] [PubMed] [Google Scholar]
- 29. Fledelius HC. Ophthalmic changes from age of 10 to 18 years. A longitudinal study of sequels to low birth weight. II Visual acuity. Acta Ophthalmologica. 1981;59:64–70 [DOI] [PubMed] [Google Scholar]
- 30. Sebris SL, Dobson V, Hartmann EE. Assessment and prediction of visual acuity in 3- to 4-year-old children born prior to term. Hum Neurobiol. 1984;3:87–92 [PubMed] [Google Scholar]
- 31. Fielder AR, Moseley MJ. Environmental light and the preterm infant. Semin Perinatol. 2000;24:291–298 [DOI] [PubMed] [Google Scholar]
- 32. Fledelius HC. Pre-term delivery and subsequent ocular development. A 7–10 year follow-up of children screened 1982–84 for ROP. 4) Oculometric - and other metric considerations. Acta Ophthalmol Scand. 1996;74:301–305 [DOI] [PubMed] [Google Scholar]
- 33. Cook A, White S, Batterbury M, Clark D. Ocular growth and refractive error development in premature infants without retinopathy of prematurity. Invest Ophthalmol Vis Sci. 2003;44:953–960 [DOI] [PubMed] [Google Scholar]
- 34. Fledelius HC. Inhibited growth and development as permanent features of low birth weight. A longitudinal study of eye size, height, head circumference, interpupillary distance and exophthalmometry, as measured at age of 10 and 18 years. Acta Paediatr Scand. 1982;71:645–650 [DOI] [PubMed] [Google Scholar]
- 35. Saw SM, Tong L, Chia KS, et al. The relation between birth size and the results of refractive error and biometry measurements in children. Br J Ophthalmol. 2004;88:538–542 [DOI] [PMC free article] [PubMed] [Google Scholar]
- 36. He M, Hur YM, Zhang J, Ding X, Huang W, Wang D. Shared genetic determinant of axial length, anterior chamber depth, and angle opening distance: the Guangzhou Twin Eye Study. Invest Ophthalmol Vis Sci. 2008;49:4790–4794 [DOI] [PubMed] [Google Scholar]
- 37. Zhang J, Hur YM, Huang W, Ding X, Feng K, He M. Shared genetic determinants of axial length and height in children: the Guangzhou twin eye study. Arch Ophthalmol. 2011;129:63–68 [DOI] [PubMed] [Google Scholar]
- 38. O'Connor AR, Stephenson TJ, Johnson A, Tobin MJ, Ratib S, Fielder AR. Change of refractive state and eye size in children of birth weight less than 1701 g. Br J Ophthalmol. 2006;90:456–460 [DOI] [PMC free article] [PubMed] [Google Scholar]
- 39. Tomazzoli L, Renzi G, Mansoldo C. Ophthalmologic follow-up of premature twins and triplets. Eur J Ophthalmol. 2003;13:439–444 [DOI] [PubMed] [Google Scholar]
- 40. Carbonaro F, Andrew T, Mackey DA, Young TL, Spector TD, Hammond CJ. Repeated measures of intraocular pressure result in higher heritability and greater power in genetic linkage studies. Invest Ophthalmol Vis Sci. 2009;50:5115–5119 [DOI] [PMC free article] [PubMed] [Google Scholar]
- 41. Samarawickrama C, Huynh SC, Liew G, Burlutsky G, Mitchell P. Birth weight and optic nerve head parameters. Ophthalmology. 2009;116:1112–1118 [DOI] [PubMed] [Google Scholar]
- 42. Sun C, Ponsonby AL, Wong TY, et al. Effect of birth parameters on retinal vascular caliber: the Twins Eye Study in Tasmania. Hypertension. 2009;53:487–493 [DOI] [PubMed] [Google Scholar]