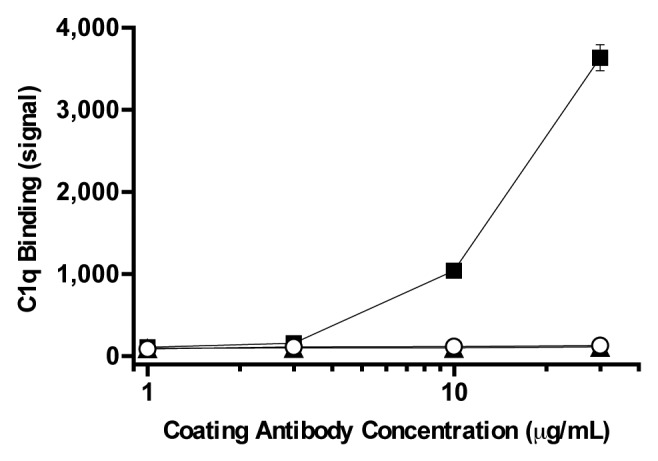
Figure 1. C1q binding as a function of ch-mAb7F9 (open circles) and control antibody concentration. The positive control was purified IgG1 (squares) and the negative control was IgG2 (triangles). Results shown are the average of four replicates ± standard deviation. Error bars not visible are smaller than the symbol.
