

Abstract
Purpose
To prospectively describe magnitude-based multi-echo gradient-echo hepatic proton density fat fraction (PDFF) inter-examination precision at 3T.
Materials and Methods
In this prospective, IRB approved, HIPAA compliant study, written informed consent was obtained from 29 subjects (body mass indexes > 30kg/m2). Three 3T magnetic resonance imaging (MRI) examinations were obtained over 75-90 minutes. Segmental, lobar, and whole liver PDFF were estimated (using three, four, five, or six echoes) by magnitude-based multi-echo MRI in co-localized regions of interest (ROIs). For estimate (using three, four, five, or six echoes), at each anatomic level (segmental, lobar, whole liver), three inter-examination precision metrics were computed: intra-class correlation coefficient (ICC), standard deviation (SD), and range.
Results
Magnitude-based PDFF estimates using each reconstruction method showed excellent inter-examination precision for each segment (ICC ≥ 0.992; SD ≤ 0.66%; range ≤ 1.24%), lobe (ICC ≥ 0.998; SD ≤ 0.34%; range ≤ 0.64%), and the whole liver (ICC = 0.999; SD ≤ 0.24%; range ≤ 0.45%). Inter-examination precision was unaffected by whether PDFF was estimated using three, four, five, or six echoes.
Conclusion
Magnitude-based PDFF estimation shows high inter-examination precision at segmental, lobar, and whole liver anatomic levels, supporting its use in clinical care or clinical trials. The results of this study suggest that longitudinal hepatic PDFF change greater than 1.6% is likely to represent signal rather than noise.
Keywords: proton density fat fraction, PDFF, steatosis, inter-examination precision, magnitude-based MRI
Introduction
Proton density fat fraction (PDFF) is emerging as a leading magnetic resonance (MR)-based biomarker for noninvasive quantification of hepatic steatosis (1 - 3). A magnitude-based multi-echo gradient-echo method has been developed that estimates PDFF across the entire liver (4 - 7). This magnitude-based PDFF estimation method uses low flip angle to minimize T1 bias, acquires multiple gradient echoes at different echo times (TEs) to measure and correct for T2* signal decay, and applies a multi-peak spectral fat model to address the multi-frequency signal interference pattern from different proton moieties in fat. Using co-localized single-voxel multi-echo T2-corrected MR spectroscopy as the reference standard, multiple human studies have shown that this method accurately estimates PDFF in the liver at 1.5T (4, 7) and at 3T (5 - 7), as well as on scanners from different manufacturers (7). Based on these results, this magnitude-based PDFF estimation method now is being used to quantify liver fat in clinical practice in several institutions in the United States and abroad and is being used as a biomarker of drug efficacy and drug toxicity by the NIH and industry in clinical trials (8).
While demonstration of accuracy is important, it does not by itself validate a quantitative analytical method. According to the Food and Drug Administration (FDA), method validation also requires demonstration of precision (8). An imaging biomarker can be evaluated for precision when repeated measurements express the closeness of agreement (degree of scatter) between a series of estimates obtained from the same ‘sample’ under the prescribed conditions; for evaluation of an in vivo MR imaging method, the repeated estimates (e.g., PDFF estimates) are made in a given location within a given organ (e.g., liver) in the same subject. The closer the agreement between repeated estimates, the more likely the estimates will be similar in the future, assuming no true change in the underlying property. For this reason, knowledge of the precision is critical for interpreting changes over time when the method is applied longitudinally in clinical care or clinical trials.
As proposed by the FDA, the terms repeatability, intermediate precision, and reproducibility are used to gauge the precision of quantitative analytical methods. Repeatability refers to precision under the same operating conditions over a short interval of time; for evaluation of an MR imaging method, the repeated measurements are performed within a single imaging examination (intra-examination) without taking the subject off the scan table, keeping constant all controllable variables (e.g., subject and coil position, transmit and receive calibration parameters). Intermediate precision refers to precision under expected variations in laboratory conditions; for evaluation of an MR imaging method, the repeated measurements are performed on different examinations (inter-examinations) with the subject getting off and then back on the scanner table, thereby purposely allowing changes in subject and coil position as well as calibration parameters that occur routinely in examinations performed longitudinally. Reproducibility refers to the precision between laboratories or scanners; for evaluation of an MR imaging method, the repeated measurements are made on different scanners (manufacturers, platforms, field strengths) and/or different imaging centers.
With regard to magnitude-based PDFF estimation, the method's intra-examination repeatability (5, 9) and between-scanner reproducibility (7) have been reported, but no published study to our knowledge has described the method's inter-examination precision. Hence, demonstration of inter-examination repeatability is also needed to further validate and confirm PDFF as a biomarker for use in clinical care and in clinical trials, where subjects are removed from the scanner between MRI examinations.
The purpose of this prospectively designed study was to describe the inter-examination precision of magnitude-based multi-echo gradient-echo PDFF estimation at 3T. Additionally, while most studies using magnitude-based MR imaging to estimate PDFF have implemented the method as a six-echo acquisition, the method can be implemented with as few as three echoes. A preliminary study suggests that fewer echoes may improve estimation accuracy, but the precision of magnitude-based PDFF estimation made with different number of echoes is not known (10). Thus, in our secondary objective, precision was assessed for PDFF estimation based on three-, four-, five-, or six-echoes.
Materials and Methods
Overview and Study Population
This prospectively designed, cross-sectional, single-site observational clinical study was approved by an Institutional Review Board and was compliant with the Health Insurance Portability and Accountability Act (HIPAA). From August 2009 to October 2009, pediatric and adult subjects were recruited by physician referral from our hepatology and obesity clinics, and by self-referral in response to informational flyers posted at our institution. Enrollment eligibility criteria included a body mass index (BMI) greater than 30 kg/m2, age greater than eight years, and willingness to undergo research MRI. Exclusion criteria included contraindications for MRI, known claustrophobia, or pregnancy. Subjects who satisfied eligibility criteria were enrolled after providing written informed consent (adults) or written assent with parental consent (children). Age, gender, and body mass index (BMI) were recorded.
Magnetic Resonance Examinations
Each subject underwent three separate, consecutive MR examinations in a single day over the course of 75 to 90 minutes. For each MR examination, subjects were positioned supine and examined using an eight-channel torso phased-array receive coil at 3T (GE signal EXCITE HD, GE Medical Systems, Milwaukee, WI, USA). After each MR examination, subjects were removed from the scanner for about five to ten minutes. Subjects then were repositioned on the scanner table, the phased-array coil was reattached, and the next MRI examination performed.
Each examination was about 20 minutes long and included a three-plane localization sequence and several additional sequences, one of which was analyzed for this study. The analyzed sequence was a two-dimensional breath-hold six-echo spoiled gradient-recalled-echo magnitude-based sequence acquired in a single TR with bipolar readout in the axial plane using all coil elements without parallel imaging. To help avoid possible artifact, parallel imaging was not used. To minimize T1 effects, a low flip angle of 10 degrees was used with a repetition time (TR) of 125 ms or longer (range 125 to 270 ms). TR was adjusted to permit acquisition of a sufficient number of images to cover the liver from its dome to its inferior tip. Six magnitude images were obtained at successive TEs at which water and the main (1.3 ppm) methylene peak of fat are approximately at sequential alternating nominally out-of-phase and in-phase echo times (1.15, 2.3, 3.45, 4.6, 5.75, and 6.9 ms) in a single 18-30 s breath-hold. Other imaging parameters included 8-mm slice thickness, 0-mm interslice gap, ± 142-kHz receiver bandwidth, 0.8 fractional echo sampling, 192×192 base matrix, one signal average, and rectangular fieldof-view (FOV) adjusted to body habitus and breath-hold capacity. The number of slices varied from 14 to 26 depending on TR and phase FOV. Images at each of the six TEs were transferred offline for further processing as described below. Other sequences performed during each examination were not analyzed for this study.
Image Processing and Analysis
Image Processing
A previously published fitting algorithm (4) using MATLAB (MathWorks, Natick, MA) was applied pixel by pixel to the magnitude source images to reconstruct parametric PDFF maps. This algorithm assumes exponential T2* decay across TEs, while modeling water as a single frequency signal at 4.7 ppm and the composite fat signal as the sum of five individual frequency signals at 5.3, 4.2, 2.75, 2.1, 1.3, and 0.9 ppm with weights of 0.047, 0.039, 0.006, 0.120, 0.700, and 0.088 respectively (the “multi-interference” method described in Ref. 4). These weights were derived from human subjects with fatty liver disease (11).
As illustrated in Figure 1, four parametric PDFF maps were reconstructed from each six-echo sequence: the first three echoes were used to generate a three-echo map, the first four echoes to generate a four-echo map, the first five echoes to generate a five-echo map, and all six echoes to generate a six-echo map. Hence, a total of four reconstruction methods (using the first three, four, five, and all six echoes) were applied to each six-echo sequence. The PDFF maps and the source magnitude images were transferred to a Macintosh workstation running the open sourced Osirix DICOM image processing and viewing software for image analysis.
Figure 1.
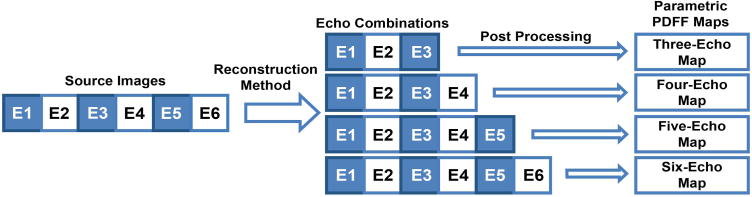
Generation of three-, four-, five-, and six-echo parametric maps from a single six-echo acquisition. Magnitude source images were obtained at echo times of 1.15, 2.3, 3.45, 4.6, 5.75, and 6.9 ms. Four parametric PDFF maps were generated from the source images, by using the first three, four, five, or six echoes, respectively, in the reconstruction. E=echo.
Image Analysis
One author (a second year medical student trained in image analysis) reviewed the magnitude source images and, blinded to the PDFF maps and to the PDFF values in the liver, manually placed on the images 20-mm diameter circular regions of interest (ROIs). Each ROI contained 60 or 72 pixels for 44 × 44 cm and 40 × 40cm FOVs respectively. Care was taken to avoid large hepatic vessels and organ boundaries. A separate ROI was placed in each of the nine Couinaud segments on source images acquired in the first examination at one of the out-of-phase echoes (echo one [TE 1.15 ms], echo three [3.45 ms], or echo five [5.75 ms]). The specific out-of-phase image used for ROI placement (echo one, echo three, or echo five) was selected at random in each subject to prevent possible bias in evaluating the precision of the different reconstruction methods associated with using any particular out-of-phase echo image to guide ROI placement.
After ROI placement in each of the nine Couinaud liver segments for the first MRI examination, ROIs were manually co-localized to the source images for the other two MR examinations at the same out-of-phase TE. Hence a total of 27 ROIs were placed on source images, one ROI in each of nine Couinaud segments co-localized across three examinations. For each examination, the ROIs placed on the source images then were propagated, using the Osirix software, without readjustment to each of the corresponding four parametric PDFF maps, each map representing a different reconstruction method (three, four, five, or six echoes).
For each subject, examination, and reconstruction method, the mean per-pixel PDFF value derived from each segmental ROI was recorded. Additionally, for each subject, examination, and reconstruction method, the PDFF values in the four right lobe ROIs (segments 5,6,7,8) were averaged to obtain a right lobe PDFF estimate, the PDFF values in the five left lobe ROIs (segments 1, 2, 3, 4a, 4b) were averaged to obtain a left lobe PDFF estimate, and the PDFF values in the 9 liver segment ROIs were averaged to obtain a whole liver PDFF estimate. Precision was assessed for the liver as a whole, in each lobe, and in each of the nine Couinaud segments. The rationale for assessing precision at three anatomic levels (whole liver, lobar, segmental) is that PDFF has been reported in clinical studies and clinical trials at different anatomic levels (2, 5, 7, 12, 13), and hence knowledge of precision at each anatomic level is relevant.
Finally, each subject was assigned a composite hepatic PDFF estimate, defined as the average PDFF across the 108 ROIs (nine segments, three examinations, and four reconstruction methods).
Statistical Analysis
Statistical analysis was performed by a statistician (TW, 15+ years experience). Subject demographics, BMIs, and segmental, lobar, whole liver, and composite hepatic PDFF estimates were summarized descriptively.
Three metrics of inter-examination precision were computed: intra-class correlation coefficient (ICC), standard deviation (SD), and range (defined as the difference between the maximum and the minimum value). The inter-examination ICC of the segmental, lobar, and whole liver PDFF estimates was calculated for all subjects for each reconstruction method, and 95% confidence limits of the ICCs were computed. Additionally, for each reconstruction method, the SD and range of the segmental, lobar, and whole liver PDFF estimates across the three examinations were determined for each subject; these inter-examination SDs and ranges then were averaged across all subjects.
The relationship of PDFF estimates across echoes was examined with ICC. The effect of examination order on PDFF estimates was evaluated using paired t-tests. The effect of echo chosen to guide the ROI placement (echo one, echo three, or echo five) on the PDFF precision was examined by computing ICCs, SDs, and ranges separately for the three echo subgroups.
Results
Subject Characteristics
Twenty-nine subjects were enrolled in this study. Subjects' age ranged from 12 to 62 years with a mean of 24 years. There were fifteen children (12 male, 3 female; mean age 15 years: range 12 - 17 years) and fourteen adults (11 male, 3 female; mean age 33 years: range 18 - 59 years). All subjects were obese (BMI >30 kg/m2). BMI ranged from 30.4 to 51.1 kg/m2. Average BMI was 37.05 kg/m2 and average weight was 106 kg. Twelve subjects had a BMI between 30 to 35 kg/m2, ten subjects had a BMI between 35-40 kg/m2, and seven subjects had a BMI greater than 40 kg/m2. The study included pediatric as well as adult subjects as magnitude-based MRI-estimated PDFF is now used in both populations.
The composite hepatic PDFF ranged from 1.4% to 35.4%, with a mean of 11.4% and a SD of 8.2%. Eight subjects had a composite PDFF of 0% - 6%, eight had 6% - 10%, seven had 10% - 15%, four had 15% - 25%, and 2 had >25%.
Table 1 summarizes for each segment, each lobe, and whole liver, the mean PDFF estimates, averaged across all 29 subjects, for each of the four reconstruction methods (three, four, five, and six echoes) and for each of the three examinations (first, second, third). Segmental, lobar, and whole liver PDFF estimates ranged from 9.5% to 12.8% depending on the anatomic level and reconstruction method. Also shown, for each anatomic level, are averages across reconstruction methods and averages across examinations. There was close agreement, at each anatomic level, in PDFF estimation for all four reconstruction methods (all ICCs >0.995). Formal statistical comparisons were not performed, since we were underpowered to detect differences less than 0.005 on ICC, and moreover, such small differences are not of clinical relevance. The order of examinations did not affect the PDFF estimations for any reconstruction method at any anatomic level (p>0.05) for all pairwise comparisons), suggesting there was no systematic drift in PDFF estimation over the 75 to 90 minute time interval in which the three examinations were performed. Precision was unaffected by subject randomization to echo one, echo three, or echo five, which was chosen at random to guide ROI placement; all ICCs remained at the 0.99 or higher level.
Table 1. Segmental, Lobar, and Whole Liver Hepatic PDFF Summaries.
| Three-Echo Method | Four-Echo Method | Five-Echo Method | Six-Echo Method | Inter-method mean | ||||||||||||||||
|---|---|---|---|---|---|---|---|---|---|---|---|---|---|---|---|---|---|---|---|---|
| Exam 1 | Exam 2 | Exam 3 | Inter-exam mean | Exam 1 | Exam 2 | Exam 3 | Inter-exam mean | Exam 1 | Exam 2 | Exam 3 | Inter-exam mean | Exam 1 | Exam 2 | Exam 3 | Inter-exam mean | Exam 1 | Exam 2 | Exam 3 | Inter-exam mean | |
| Segment | ||||||||||||||||||||
| 1 | 11.94 | 11.89 | 11.80 | 11.88 | 11.86 | 11.80 | 11.71 | 11.79 | 11.99 | 11.85 | 11.75 | 11.87 | 11.91 | 11.78 | 11.68 | 11.79 | 11.92 | 11.83 | 11.73 | 11.83 |
| 2 | 9.64 | 9.64 | 9.71 | 9.67 | 9.51 | 9.51 | 9.58 | 9.53 | 9.62 | 9.56 | 9.65 | 9.61 | 9.51 | 9.44 | 9.53 | 9.49 | 9.57 | 9.54 | 9.62 | 9.58 |
| 3 | 10.94 | 10.83 | 10.85 | 10.87 | 10.82 | 10.71 | 10.74 | 10.76 | 10.86 | 10.79 | 10.81 | 10.82 | 10.75 | 10.71 | 10.74 | 10.73 | 10.84 | 10.76 | 10.78 | 10.80 |
| 4a | 10.92 | 11.01 | 10.87 | 10.93 | 10.81 | 10.91 | 10.75 | 10.82 | 10.96 | 11.11 | 10.93 | 11.00 | 10.86 | 10.97 | 10.78 | 10.87 | 10.89 | 11.00 | 10.83 | 10.91 |
| 4b | 11.58 | 11.49 | 11.40 | 11.49 | 11.47 | 11.37 | 11.26 | 11.37 | 11.51 | 11.51 | 11.45 | 11.49 | 11.42 | 11.41 | 11.36 | 11.40 | 11.49 | 11.44 | 11.37 | 11.44 |
| 5 | 11.57 | 11.45 | 11.44 | 11.49 | 11.43 | 11.32 | 11.31 | 11.36 | 11.49 | 11.34 | 11.33 | 11.38 | 11.39 | 11.23 | 11.22 | 11.28 | 11.47 | 11.34 | 11.32 | 11.38 |
| 6 | 12.06 | 12.22 | 12.24 | 12.17 | 11.96 | 12.10 | 12.15 | 12.07 | 12.06 | 12.17 | 12.28 | 12.17 | 11.97 | 12.10 | 12.19 | 12.09 | 12.01 | 12.15 | 12.21 | 12.13 |
| 7 | 12.80 | 12.79 | 12.93 | 12.84 | 12.71 | 12.69 | 12.83 | 12.74 | 12.78 | 12.73 | 12.91 | 12.81 | 12.70 | 12.68 | 12.88 | 12.75 | 12.75 | 12.72 | 12.89 | 12.79 |
| 8 | 12.34 | 12.39 | 12.07 | 12.27 | 12.21 | 12.23 | 11.94 | 12.13 | 12.25 | 12.36 | 12.05 | 12.22 | 12.15 | 12.24 | 11.95 | 12.11 | 12.24 | 12.31 | 12.00 | 12.18 |
| Lobe | ||||||||||||||||||||
| Left | 11.00 | 10.97 | 10.92 | 10.96 | 10.90 | 10.86 | 10.81 | 10.86 | 10.99 | 10.96 | 10.92 | 10.96 | 10.89 | 10.86 | 10.82 | 10.86 | 10.94 | 10.91 | 10.87 | 10.91 |
| Right | 12.19 | 12.21 | 12.17 | 12.19 | 12.08 | 12.08 | 12.06 | 12.07 | 12.15 | 12.15 | 12.14 | 12.15 | 12.06 | 12.06 | 12.06 | 12.06 | 12.12 | 12.13 | 12.11 | 12.12 |
| Whole liver | 11.53 | 11.52 | 11.48 | 11.51 | 11.42 | 11.40 | 11.36 | 11.40 | 11.50 | 11.49 | 11.46 | 11.49 | 11.41 | 11.39 | 11.37 | 11.39 | 11.47 | 11.45 | 11.42 | 11.45 |
Note – Table shows for each segment, lobe, and whole liver the mean PDFF estimates, averaged across the 29 subjects, for each reconstruction method (three, four, five, and six echoes; as well as the inter-method mean, which averages the values across the four methods) and for each examination (1, 2, 3; as well as the inter-exam mean, which averages the values across the three examinations). Units of PDFF estimates are percentage points.
Inter-examination Precision
All four reconstruction methods provided excellent inter-examination precision for hepatic PDFF estimation at the segmental, lobar, and whole liver levels (Table 2).
Table 2. Inter-examination Precision for Hepatic PDFF Estimation.
| Inter-examination ICC [95% CI] | Inter-examination SD | Inter-examination Range (Minimum-Maximum) | ||||||||||
|---|---|---|---|---|---|---|---|---|---|---|---|---|
| 3-Echo | 4-Echo | 5-Echo | 6-Echo | 3-Echo | 4-Echo | 5-Echo | 6-Echo | 3-Echo | 4-Echo | 5-Echo | 6-Echo | |
| Segment | ||||||||||||
| 1 | 0.995 [0.991,0.997] | 0.995 [0.991,0.998] | 0.995 [0.991,0.998] | 0.995 [0.991,0.998] | 0.54 | 0.54 | 0.54 | 0.54 | 1.03 (11.38-12.41) | 1.03 (11.29-12.32) | 1.02 (11.35-12.37) | 1.03 (11.28-12.31) |
| 2 | 0.992 [0.985,0.996] | 0.992 [0.985,0.996] | 0.992 [0.985,0.996] | 0.992 [0.985,0.996] | 0.55 | 0.56 | 0.58 | 0.59 | 1.05 (9.08-10.13) | 1.07 (8.93-10.00) | 1.11 (9.00-10.11) | 1.12 (8.88-10.00) |
| 3 | 0.994 [0.989,0.997] | 0.994 [0.988,0.997] | 0.993 [0.987,0.996] | 0.993 [0.987,0.996] | 0.55 | 0.55 | 0.62 | 0.61 | 1.05 (10.34-11.39) | 1.04 (10.23-11.27) | 1.16 (10.21-11.37) | 1.16 (10.11-11.27) |
| 4a | 0.995 [0.992,0.998] | 0.996 [0.992,0.998] | 0.996 [0.992,0.998] | 0.996 [0.992,0.998] | 0.47 | 0.46 | 0.46 | 0.46 | 0.88 (10.48-11.36) | 0.87 (10.36-11.23) | 0.85 (10.55-11.40) | 0.87 (10.41-11.28) |
| 4b | 0.995 [0.992,0.998] | 0.995 [0.992,0.998] | 0.996 [0.992,0.998] | 0.996 [0.993,0.998] | 0.45 | 0.46 | 0.46 | 0.44 | 0.86 (11.08-11.94) | 0.88 (10.95-11.83) | 0.88 (11.07-11.95) | 0.84 (11.00-11.84) |
| 5 | 0.997 [0.994,0.998] | 0.997 [0.994,0.998] | 0.997 [0.994,0.998] | 0.997 [0.994,0.998] | 0.42 | 0.42 | 0.42 | 0.43 | 0.79 (11.12-11.91) | 0.8 (10.98-11.78) | 0.79 (11.00-11.79) | 0.81 (10.88-11.69) |
| 6 | 0.997 [0.995,0.999] | 0.997 [0.995,0.999] | 0.998 [0.996,0.999] | 0.998 [0.996,0.999] | 0.39 | 0.39 | 0.36 | 0.37 | 0.74 (11.82-12.56) | 0.74 (11.72-12.46) | 0.69 (11.85-12.54) | 0.69 (11.77-12.46) |
| 7 | 0.995 [0.991,0.998] | 0.995 [0.991,0.997] | 0.996 [0.993,0.998] | 0.996 [0.992,0.998] | 0.50 | 0.49 | 0.45 | 0.46 | 0.96 (12.36-13.32) | 0.93 (12.28-13.21) | 0.85 (12.39-13.24) | 0.87 (12.32-13.19) |
| 8 | 0.992 [0.985,0.996] | 0.992 [0.986,0.996] | 0.993 [0.986,0.996] | 0.993 [0.987,0.996] | 0.66 | 0.65 | 0.62 | 0.61 | 1.24 (11.60-12.84) | 1.23 (11.47-12.70) | 1.16 (11.60-12.76) | 1.14 (11.49-12.63) |
| Lobe | ||||||||||||
| Left | 0.998 [0.997,0.999] | 0.998 [0.997,0.999] | 0.998 [0.996,0.999] | 0.998 [0.996,0.999] | 0.30 | 0.31 | 0.34 | 0.33 | 0.57 (10.68-11.25) | 0.58 (10.57-11.14) | 0.64 (10.63-11.27) | 0.63 (10.53-11.16) |
| Right | 0.999 [0.998,0.999] | 0.999 [0.998,0.999] | 0.999 [0.998,0.999] | 0.999 [0.998,1.00] | 0.27 | 0.27 | 0.25 | 0.26 | 0.52 (11.93-12.44) | 0.52 (11.81-12.33) | 0.48 (11.91-12.39) | 0.48 (11.81-12.30) |
| Whole liver | 0.999 [0.998,1.00] | 0.999 [0.998,1.00] | 0.999 [0.998,1.00] | 0.999 [0.998,1.00] | 0.23 | 0.23 | 0.24 | 0.24 | 0.44 (11.29-11.73) | 0.44 (11.18-11.62) | 0.45 (11.26-11.71) | 0.45 (11.17-11.62) |
Note – Table shows inter-examination intra-class correlation coefficient (ICC), standard deviation (SD), and range for three-, four-, five-, and six-echo reconstruction methods at the segmental, lobar, and whole liver anatomic levels. For ICC values, the 95% confidence intervals are shown in brackets. For ranges, the corresponding minimum and maximum values that span the range are shown in parentheses. SD and range (and the corresponding minimum and maximum values) are averages of the 29 subjects' individual inter-examinations SDs and ranges (and corresponding minimum and maximum values). Units for SD and range are percentage points. CI = Confidence Interval
Segmental
Depending on the segment and reconstruction method, the inter-examination ICC ranged from 0.992 to 0.998, the inter-examination SD from 0.36 to 0.66%, and the inter-examination range from 0.69 to 1.24%.
Lobar
Depending on the lobe and reconstruction method, the inter-examination ICC ranged from 0.998 to 0.999, the inter-examination SD from 0.25 to 0.34%, and the inter-examination range from 0.48 to 0.64%.
Whole liver
For all four reconstruction methods, the inter-examination ICC was 0.999. Depending on the reconstruction method, the inter-examination SD ranged from 0.23 to 0.24%, and the inter-examination from 0.44 to 0.45%.
As shown in Table 2, there were no clinically relevant differences between reconstruction methods in any of the three precision metrics (inter-examination ICC, SD, range) at any anatomic level (segmental, lobar, whole liver). In particular, all ICCs at every level were greater than 0.99. As meaningful differences were not observed, formal statistical comparisons were not performed.
A representative subject is shown in Figure 2, illustrating the high inter-examination precision of PDFF estimated using six echoes in each of the nine Couinaud liver segments.
Figure 2.

Six-echo parametric PDFF maps through superior (upper panel) and inferior (bottom panel) parts of the liver obtained during three separate examinations in a single day. Upper panel shows PDFF estimates in segments 1, 2, 4a, 7, and 8. Lower panel shows PDFF estimates in liver segments 3, 4b, 5, and 6. Notice close agreement between segmental PDFF estimates across examinations.
Discussion
Our objective was to evaluate the inter-examination precision of magnitude-based PDFF estimation using three-, four-, five-, and six-echo reconstruction methods at the segmental, lobar, and whole liver anatomic levels. We focused on precision, because accuracy of magnitude-based PDFF estimation has already been shown in prior studies (4, 5), including one study that showed high accuracy for PDFF estimation in individual liver segments (5). Four reconstruction methods were evaluated because magnitude-based PDFF estimation can be implemented with any of these methods and it is not yet certain which method is best.
The subjects in the present study spanned a clinically relevant range of hepatic PDFF values from negligible (1.4%) to severely elevated (35.4%). To minimize potential bias in ROI placement, ROIs were placed on source images without knowledge of corresponding PDFF values and then propagated onto the PDFF maps; moreover, the out-of-phase image used for ROI placement was selected at random in each subject. The three-, four- five-, and six-echo PDFF maps were generated from the same source data and hence were identical to one another except for the number of echoes included in the fitting algorithm; this design feature removed potential sources of variability between the different methods except for the variable of interest (number of echoes) and thereby increased the power to identify any differences in PDFF estimation precision between the methods.
We found that magnitude-based PDFF estimation has high inter-examination precision at all three anatomic levels, regardless of whether a three-, four-, five-, or six-echo reconstruction method is utilized. While we found no meaningful differences in precision between reconstruction methods, we found that precision was greatest at the whole-liver level, intermediate at the lobar level, and lowest at the segmental level. This is an expected result, which reflects the increasing number of ROIs used in the PDFF estimation from segmental to the lobar to the whole liver levels.
The data reported in this study are relevant to the planning and interpretation of longitudinal studies relying on magnitude-based PDFF estimation performed with a single scanner at a single site. For example, the highest PDFF estimation variability at the segmental level, as determined by the highest mean SD, was 0.66%. This corresponds to the aggregate SD (the square root of mean variance) of 0.78, which suggests that in longitudinal studies in which magnitude-based PDFF is reported at the segmental level, longitudinal changes greater than 1.6% (just over twice the aggregate SD) are likely to represent real changes rather than imprecision in PDFF estimates. As a corollary, in planning future clinical trials, investigators should be aware that the power to detect longitudinal changes in PDFF may depend on the anatomic level and the number of averaged ROIs. Assuming the same PDFF estimation methodology as in this study, it is likely to be highest for whole-liver PDFF estimates, intermediate for lobar estimates, and lowest for segmental estimates. Depending on the effect size expected by an intervention, however, the precision at any of these anatomic levels is likely to be adequate. Finally, we found no meaningful differences in precision using any of the four reconstruction methods tested in our study, suggesting that all four methods are similarly well suited to detect longitudinal changes in hepatic PDFF.
All three MR examinations for each subject were performed in a 75 to 90 minute period in a single day. While there was no evidence of systematic drift in PDFF estimations during this short time window, our study does not address potential temporal (e.g. diurnal, between day, between week) variability in liver PDFF. Such temporal variability would reduce the observed precision of PDFF estimation in a longitudinal study. Studies that define the diurnal and short-term temporal variability in PDFF estimation still are needed.
While our study focused on magnitude-based hepatic PDFF estimation, complex-based hepatic PDFF estimation methods also have been developed. These have the advantage of estimating PDFF across the entire biological dynamic range of 0-100% and hence offer a more comprehensive approach for tissue PDFF estimation (1, 2). In this study, we investigated a magnitude-based method because it was easier to implement at our facility and is sufficient to estimate hepatic PDFF, which rarely exceeds 50% (1, 2). Based on the high reported accuracy of complex-based methods (1, 2, 14), it is likely that complex-based PDFF estimation may have similarly high inter-examination precision, but this needs to be confirmed with additional studies.
A limitation of our study is that we did not compare the accuracy of the four reconstruction methods for PDFF estimation. Using MR spectroscopy as the reference, a preliminary study suggests that three- and four-echo reconstructions may be more accurate than higher-echo reconstructions (10), but this preliminary study focused on estimation accuracy in the center of the right lobe of the liver and did not examine accuracy in individual segments. A study comparing the accuracy of the four reconstruction methods in individual segments may be necessary but will be difficult technically to perform, as it will require a reliable reference standard for each segment. Single-voxel multi-echo MR spectroscopy, the current gold standard for PDFF estimation, is not well suited for sampling every segment, multi-voxel MR spectroscopy is not as accurate as single-voxel spectroscopy because of the inability to collect multiple echoes and, thus, correct for T2 relaxation effects, and biopsy of every segment separately is not feasible or ethical (15).
Another limitation of our study is that all examinations were performed on a single 3T scanner at a single site. While there is no reason to believe that the high inter-examination precision shown here would not be generalizable to other scanners, other field strengths, and other sites, this needs to be empirically shown. We measured only a single ROI per segment. It is likely that precision at the segmental level could be improved if multiple ROIs were placed within each segment, but this supposition was not evaluated in this study. Our study included only one reader and so does not address inter-reader agreement. Our study population consisted exclusively of obese subjects, because fatty liver is more common in such individuals (16 - 19). The generalizability of our findings to a non-obese population is uncertain; however, non-obese individuals are less likely to require longitudinal monitoring of hepatic PDFF estimation. Understanding the inter-examination precision in obese subjects, a group more likely targeted for drug, diet, or exercise interventions, is at present more clinically relevant.
In conclusion, we have demonstrated that a magnitude-based MR imaging method estimates PDFF with high inter-examination precision in all nine Couinaud liver segments, in both lobes, and in the whole liver. This finding suggests that magnitude-based MR imaging can detect even small longitudinal changes in PDFF and hence may be applied to quantitatively monitor hepatic steatosis and assess treatment response in clinical care or clinical trials, where the effects of pharmacological or behavior modification protocols are examined. The inter-examination precision data reported here may inform the design and target sample size of future clinical trials in which PDFF is monitored at various anatomic levels. The choice of reconstruction method (three, four, five, or six echoes) did not meaningfully affect inter-examination precision; thus, all four methods are probably similarly well suited for quantifying longitudinal changes in PDFF.
Acknowledgments
Contract Grant Sponsor: National Institutes of Health (NIH); Contract grant numbers: NIDDK R01 DK075128, NIDDK R01DK088925, NCMHD EXPORT P60 MD00220, NIH T32 EB005970, UL1TR000100
References
- 1.Reeder SB, Sirlin CB. Quantification of liver fat with magnetic resonance imaging. Magnetic resonance imaging clinics of North America. 2010;18:337–357. doi: 10.1016/j.mric.2010.08.013. [DOI] [PMC free article] [PubMed] [Google Scholar]
- 2.Reeder SB, Cruite I, Sirlin CB, et al. Quantitative assessment of liver fat with magnetic resonance imaging and spectroscopy. Journal of magnetic resonance imaging. 2011;34:729–749. doi: 10.1002/jmri.22580. [DOI] [PMC free article] [PubMed] [Google Scholar]
- 3.Loomba R, Sirlin C, Permutt Z, et al. Correlation between liver histology and novel magnetic resonance imaging in adult patients with non-alcoholic fatty liver disease – MRI accurately quantifies hepatic steatosis in NAFLD. Aliment Pharmacol Ther. 2012;36:22–9. doi: 10.1111/j.1365-2036.2012.05121.x. [DOI] [PMC free article] [PubMed] [Google Scholar]
- 4.Yokoo T, Bydder M, Hamilton G, et al. Nonalcoholic fatty liver disease: diagnostic and fat-grading accuracy of low-flip-angle multiecho gradient-recalled-echo MR imaging at 1.5 T. Radiology. 2009;25:67–76. doi: 10.1148/radiol.2511080666. [DOI] [PMC free article] [PubMed] [Google Scholar]
- 5.Yokoo T, Shiehmorteza M, Hamilton G, et al. Estimation of hepatic proton-density fat fraction by using MR imaging at 3.0 T. Radiology. 2011;258:749–759. doi: 10.1148/radiol.10100659. [DOI] [PMC free article] [PubMed] [Google Scholar]
- 6.Yokoo T, Shiehmorteza M, Bydder M, et al. Spectrally-modeled hepatic fat quantification by multi-echo gradient-recalled-echo magnetic resonance imaging at 3.0T; Proc 17th Annual Meeting ISMRM; Honolulu. 2009. [Google Scholar]
- 7.Kang G, Cruite I, Sirlin C, et al. Reproducibility of MRI-Determined Proton Density Fat Fraction (PDFF) Across Two Different MR Scanner Platforms. Journal of magnetic resonance imaging. 2011;34:928–934. doi: 10.1002/jmri.22701. [DOI] [PMC free article] [PubMed] [Google Scholar]
- 8.Guidance for industry: Validation of analytical procedures methodology. Silver Spring, MD: U.S. Food and Drug Administration; [updated on 2010 Oct 21 ] Available from: http://www.fda.gov/downloads/AnimalVeterinary/Guidance ComplianceEnforcement/GuidanceforIndustry/UCM052379.pdf. [Google Scholar]
- 9.Sirlin C, Shiehmorteza M, Mwangi I, et al. Radiologic Society of North America Annual Scientific Assembly and Annual Meeting Program. Oak Brook, IL: Radiological Society of North America; 2009. Accuracy Repeatability Robustness of MR Hepatic Fat Quantification by Using a Multi-Echo Gradient-Recalled-Echo (GRE) MR Imaging in Human Subjects. Abstract SSQ07-03. [Google Scholar]
- 10.Levin YS, Yokoo T, Wolfson T, et al. The Effect of Echo-sampling Strategy on the Accuracy of Out-of-Phase and In-Phase Multi-Echo Gradient-Echo Magnetic Resonance Imaging Hepatic Fat Fraction Estimation. Scientific Formal Paper, to be presented at the 98th Scientific Assembly and Annual Meeting of the RSNA; Chicago. November 25, 2012; RSNA Abstract ID # 12030611. [Google Scholar]
- 11.Hamilton G, Yokoo T, Bydder M, et al. In vivo characterization of the liver fat (1)H MR spectrum. NMR Biomed. 2011;24:784–90. doi: 10.1002/nbm.1622. [DOI] [PMC free article] [PubMed] [Google Scholar]
- 12.Le TA, Chen J, Changchien C, et al. Effect of colesevelam on liver fat quantified by magnetic resonance in nonalcoholic steatohepatitis: A randomized controlled trial. Hepatology. 2012;56:922–32. doi: 10.1002/hep.25731. [DOI] [PMC free article] [PubMed] [Google Scholar]
- 13.Tang A, D'assignies G, Kauffmann C, et al. Radiologic Society of North America Annual Scientific Assembly and Annual Meeting Program. McCormick Place, Chicago: Radiological Society of North America; 2009. Assessment of Liver Fat Content: Comparison of Single ROI and Volumetric Measurement after Liver Segmentation. Abstract SSQ07-07. [Google Scholar]
- 14.Meisamy S, Hines C, Hamilton G, et al. Quantification of hepatic steatosis using T1 independent, T2* corrected MRI with spectral modeling of fat: a blinded comparison with MR spectroscopy. Radiology. 2011;258:767–775. doi: 10.1148/radiol.10100708. [DOI] [PMC free article] [PubMed] [Google Scholar]
- 15.Ma X, Holalkere NS, Kambadakone RA, et al. Imaging-based quantification of hepatic fat: methods and clinical applications. Radiographics: a review publication of the Radiological Society of North America, Inc. 2009;29:1253–1277. doi: 10.1148/rg.295085186. [DOI] [PubMed] [Google Scholar]
- 16.Loomba R, Sirlin CB, Schwimmer JB, et al. Advances in pediatric nonalcoholic fatty liver disease. Hepatology. 2009;50:1282–1293. doi: 10.1002/hep.23119. [DOI] [PMC free article] [PubMed] [Google Scholar]
- 17.Mirza MS. Obesity Visceral Fat, and NAFLD: Querying the Role of Adipokines in the Progression of Nonalcoholic Fatty Liver Disease. ISRN gastroenterology. 2011:592404. doi: 10.5402/2011/592404. [DOI] [PMC free article] [PubMed] [Google Scholar]
- 18.Zheng RD, Chen ZR, Chen JN, et al. Role of Body Mass Index, Waist-to-Height and Waist-to-Hip Ratio in Prediction of Nonalcoholic Fatty Liver Disease. Gastroenterology research and practice. 2012:362147. doi: 10.1155/2012/362147. [DOI] [PMC free article] [PubMed] [Google Scholar]
- 19.Hines C, Frydrychowicz A, Sirlin CB, et al. T1 Independent, T2* Corrected Chemical Shift Based Fat-Water Separation With Multi-peak Fat Spectral Modeling Is an Accurate and Precise Measure of Hepatic Steatosis. Journal of magnetic resonance imaging. 2011;33:873–881. doi: 10.1002/jmri.22514. [DOI] [PMC free article] [PubMed] [Google Scholar]