Abstract
Purpose
To develop a novel dynamic 3D non-contrast MR angiography technique which combines dynamic Pseudo-continuous Arterial Spin Labeling (dynamic PCASL), accelerated 3D radial sampling (VIPR), and time-of-arrival (TOA) mapping to provide quantitative assessment of arterial flow.
Materials and Methods
Digital simulations were performed to investigate the effects of acquisition scheme and sequence parameters on image quality and TOA mapping fidelity. Five patients with vascular malformations (AVM=3, DAVF=2) were scanned and the images were compared to DSA for the ability to identify the arterial supply, AVM location, nidus size and venous drainage.
Results
Digital simulations demonstrated reduced image artifacts and improved TOA accuracy utilizing radial acquisition over Cartesian. TOA mapping accuracy is more sensitive to sampling window length than time spacing. Dynamic PCASL MRA depicted 7 of 8 arterial pedicles, and accurately measured the AVM nidus size when the nidus was compact. The venous drainage in the AVM patients was not consistently visualized.
Conclusion
Dynamic 3D PCASL-VIPR with TOA mapping is able to acquire both high temporal and spatial resolution inflow dynamics that could improve diagnosis of high flow intracranial vascular diseases.
Keywords: dynamic pseudo-continuous arterial spin labeling (dynamic PCASL); VIPR = accelerated 3D radial acquisition; Time-of-Arrival (TOA) mapping, dynamic inflow; AVM = arteriovenous malformation; DAVF = dural arteriovenous fistula
INTRODUCTION
Digital subtraction angiography (DSA) remains the clinical standard for the assessment of intracranial vascular malformations. However, a non-contrast MR angiography (MRA) method that provides morphologic information and inflow dynamics is appealing due to the reduced cost and increased safety. 3D time-of-flight (TOF) provides good depiction of the anatomic features of AVMs; however, 3D TOF does not assess AVM inflow dynamics or venous drainage. The size, flow conditions and location of AVMs are believed to be risk factors for hemorrhage (1). Changes in the flow characteristics are of clinical significance after endovascular or radiation therapy to evaluate the effects of treatment. Dynamic Contrast enhanced (DCE) MRA with Gadolinium (Gd) based contrast agents provides both spatial and temporal filling dynamics. However in high flow brain lesion cases, substantial spatial resolution and coverage must be sacrificed to achieve sufficient temporal resolution. Moreover, intravenously delivered bolus of Gd leads to considerable bolus dispersion which limits the effective temporal resolution (2).
Non-contrast-enhanced, arterial spin labeling (ASL) MRA techniques have the ability to provide intracranial hemodynamics with high spatial and temporal resolution and limited bolus dispersion. Recent applications of pulsed ASL (PASL) in 4D intracranial MRA (3,4) have shown promising results with temporal resolution as high as 50 ms. However existing PASL techniques are limited by errors arising from RF transmission uniformity and image quality is often compromised due to use of bSSFP acquisitions (5–7). Pseudo continuous ASL (PCASL) tagging (8) strategies have demonstrated significantly higher arterial signal compared to PASL (9) and shown potential in imaging the dynamic filling in intracranial vasculature (10,11). Unfortunately, current studies are limited to 2D dynamic projection imaging or static 3D imaging due to scan time limitations. In this work, we describe a dynamic 3D MRA technique that combines PCASL and a highly undersampled 3D radial acquisition (12). Within clinically acceptable scan time, this technique simultaneously achieves high temporal and spatial resolution with whole-head coverage. Furthermore, this technique enables accurate quantification of temporal arrival times (TOA). To evaluate this technique, both digital simulations and a pilot clinical study were conducted.
MATERIALS AND METHODS
Sequence and Reconstruction
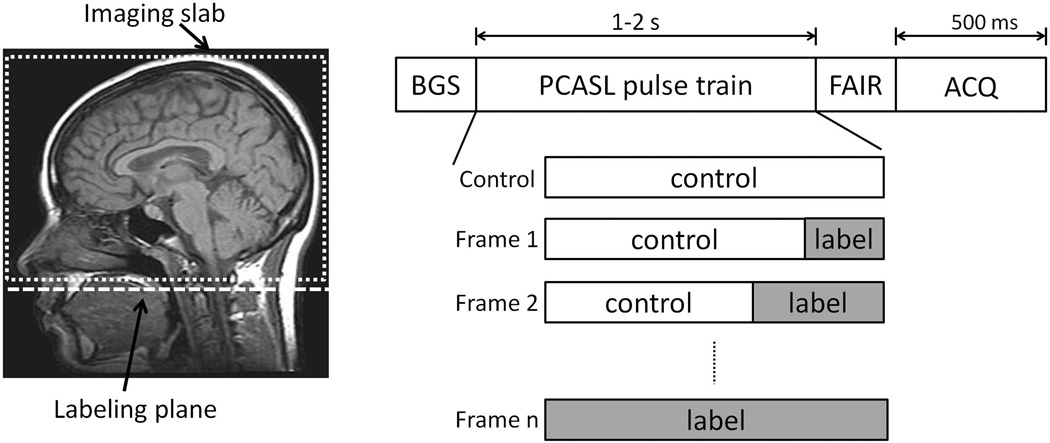
The dynamic PCASL MRA sequence is based on a previously reported static PCASL-VIPR technique (10,13) and consists of interleaved tagging sessions as shown in Figure 1. Each tagging session consists of four modules: 180° inversion for background suppression, PCASL pulse train (14), flow-alternating-inversion-recovery (FAIR) (13), and image acquisition. The PCASL module is composed of control state and label state (Figure 1). The overall length of PCASL module is identical for all the tagging sessions while the duration of label state part is altered for different time frame acquisitions. The acquisition module consists of a series of low flip angle, spoiled gradient echo (SPGR) readouts combined with a VIPR sampling strategy (12).
Figure 1.
Labeling geometry (left, dashed box indicates imaging slab, dashed line indicates the labeling plane); dynamic PCASL-VIPR sequence diagram (right) shows a tagging session consisting of four modules: background suppression, PCASL, FAIR, and acquisition with time assignment. In each tagging session, PCASL pulse train is set up differently (relative length of label state) according to the required acquisition (control, Frame 1-n).
For each time frame, k-space data from the control acquisition is first subtracted from the corresponding label acquisition and reconstructed with an optimized gridding routine (15). Individual coil images are combined using coil sensitivities estimated from the fully sampled central k-space of unsubtracted data (16).
Time-Of-Arrival Mapping
Time of arrival (TOA) mapping provides a method to compress the 4D filling pattern into a quantitative 3D image (17). However, simple thresholding of the signal time course ignores substantial effects from RF saturation, T1 relaxation, and provides coarse temporal resolution. To reduce these effects, we model the expected signal time course utilizing Bloch equations and fit the observed signals to the model. This allows substantially higher resolution in the TOA map than the acquired temporal resolution.
To model the inflowing spins, a single TOA at each spatial location is assumed with the T1 of blood equal to 1664 ms (18). The signal evolution for a given TOA is first established based on Bloch equation simulation of passage through labeling plane, T1 recovery, and RF saturation. TOA mapping is dependent on the acquisition scheme. For Cartesian acquisitions, the signal behavior of the image is expected to follow the time point at which the center of k-space is sampled. For radial acquisitions where center k-space is sampled at every TR, the signal behavior is expected to follow the average signal over the entire sampling window. In this study, a simple search is performed for every voxel of the 3D image volume with sum of squared differences utilized as a goodness of fit. The TOA map can be displayed in color with hue, saturation, and brightness scheme: the TOA map is used to determine the hue; the magnitude of the 3D image volume with the longest labeling duration is to determine the saturation and brightness.
Digital Simulation
Simulation experiments were conducted with two 2D digital phantoms: a highly simplified straight plug flow vessel phantom (Figure 2) with reconstructed resolution of 256 × 256; and a non-overlapping fractal tree phantom (Figure 3) with 8 bifurcations and resolution of 512 × 512.
Figure 2.
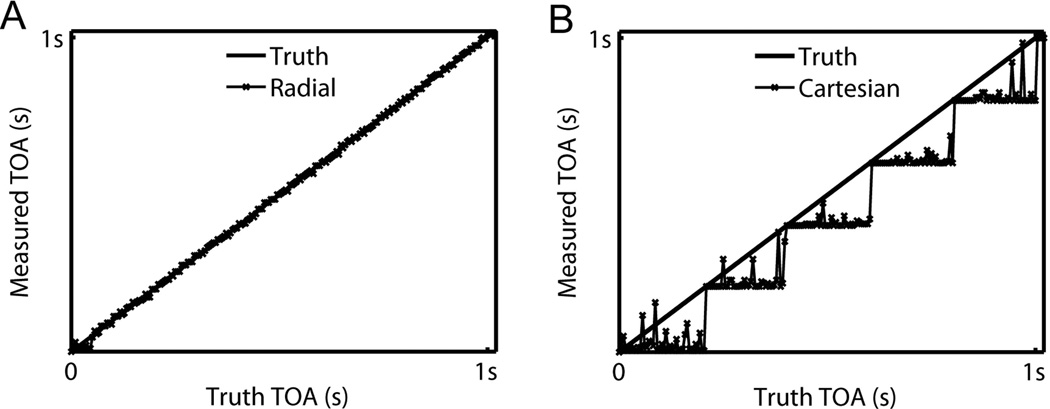
Comparison of the measured TOA profiles with truth along the horizontal center line of the vessel: (A) Radial acquisition vs. truth; (B) Cartesian acquisition vs. truth.
Figure 3.
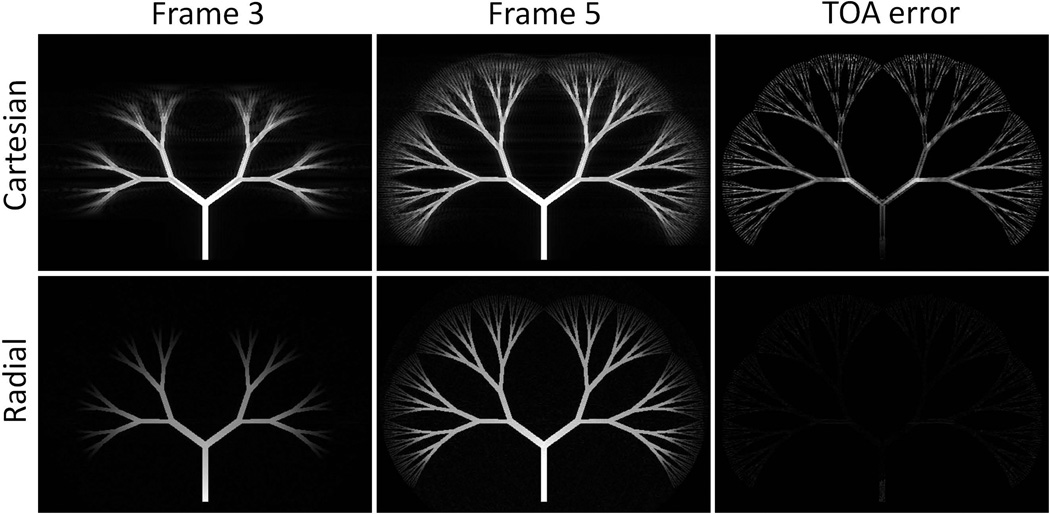
Comparison of Cartesian and radial acquisition on fractal tree phantom: (Column 1–2) Reconstructed time frame images at frame 3 and 5 from Cartesian (upper row) and radial (lower row) acquisitions. Notice the different artifact pattern and blurring effects. (Column 3) TOA error images generated from two acquisitions displayed at same scale window.
First, digital imaging simulations were performed to compare radial and Cartesian acquisition schemes in both phantoms. At each TR during the sampling window of 500 ms, truth images were generated from the input TOA image with Bloch equations, then a readout of 256 (vessel phantom) or 512 (fractal tree) sampling points was simulated utilizing inverse discrete Fourier transform. The readouts were acquired in sequential order for Cartesian and bit-reverse order for radial acquisition with a total amount satisfying Nyquist sampling criterion. 7 frames were simulated with time spacing of 200 ms. The artifacts originated from the inconsistent contrast during sampling were compared from time frame images. TOA mapping fidelity was investigated by comparing TOA profiles of vessel phantom or TOA errors of fractal tree phantom.
A second experiment aimed to investigate the effect of sampling window length and time spacing was conducted on the vessel phantom with radial acquisition. Three values of sampling window length were compared 200, 500, and 800 ms with consistent time spacing of 200 ms. Then, three values of time spacing were compared 200, 300, and 600 ms with consistent sampling window length of 600 ms. For each experiment, truth images and acquisition data were simulated. Then independent complex noise was added to the k-space data and followed by image reconstruction and TOA mapping. The above step was repeated to acquire a series of SNR levels. Finally, RMSE value of TOA map at each SNR level was calculated and an RMSE-SNR curve was created for each parameter value.
In-Vivo Study
This study recruited 3 patients with previously diagnosed AVMs and 2 patients with known DAVFs. All the patients were imaged after obtaining Institutional Review Board (IRB) approval and informed consent. All patients were scanned with dynamic PCASL-VIPR sequence on a clinical 3T MR system (Discovery 750, GE Healthcare, Waukesha, WI, USA) with a 32-channel head coil (32 Ch Head, MR Instruments, Hopkins, MN, USA). Scan parameters are shown in Table 1. Based on simulations, the sampling window length was set to 500 ms for balancing TOA mapping accuracy and scan time. Time spacing was set to 200 ms for the first four patients when PCASL module was short (1.2 s) and scan time was not a limiting factor. Since longer time spacing doesn’t substantially decrease TOA mapping accuracy, it was increased to 500 ms for the 5th patient when PCASL module was extended to 2 s. Time frame image reconstruction and TOA mapping were performed with aforementioned method for every subject.
Table 1.
Scan parameters for patient study
| Labeling plane position | Cervical segment (C1) of internal carotid artery (ICA) |
|---|---|
| FOV | 22×22×16 cm3 |
| Spatial resolution | 0.68 mm isotropic zero-filled to 0.46mm |
| Length of PCASL module | 1.2 s (2a s) |
| Sampling window length | 500 ms |
| Time spacing | 200 ms (500a ms) |
| No. of time frames | 7 (5a) |
| No. of projections per frame | 3000 (acceleration factor ~30×) |
| Scan time | 7:30 min (8:30a min) |
Parameters used for 5th patient (PCASL tagging duration was extended to 2 s to visualize draining veins, and time spacing was increased to 500 ms to reduce the scan time)
DSA images acquired up to 8 weeks prior to the MRI study were available for all the five subjects without surgical intervention performed in between. All DSA exams were obtained using an Artis Zee biplane angiographic system (Siemens, Erlangen, Germany) with resolution 1024 × 1024. A minimum of two views (frontal and lateral) were obtained for each vascular system at a frame rate of 2–4 images per second.
Two experienced neuroradiologists (P. A. T and D. J. R.) evaluated dynamic PCASL MRA and DSA images independently for delineation of the arterial supply using a four point scale (1, no visualization, 2, poor visualization, 3, good visualization, 4 excellent visualization); AVM nidus size (maximum diameter mm); deep or superficial venous drainage and AVM location.
RESULTS
Digital Simulation
Results of the acquisition scheme comparison on the single vessel phantom are shown in Figure 2. The TOA profile of Cartesian acquisition shows a stepping pattern and the deviation from the truth is as large as the time spacing. The TOA profile of radial acquisition shows greater agreement with the truth, with limited dependence on arrival time. Results on the fractal tree phantom are shown in Figure 3. The Cartesian acquisition images sharply depict the leading edge of the bolus, however they also show substantial ghosting artifacts. In the radial acquisition, the leading edge of the bolus is blurred; however, artifacts from inconsistency across the sampling window are diffuse and not visually observed. TOA errors are shown in the same display window for both acquisition schemes. Cartesian acquisition shows large errors, especially at vessel edges.
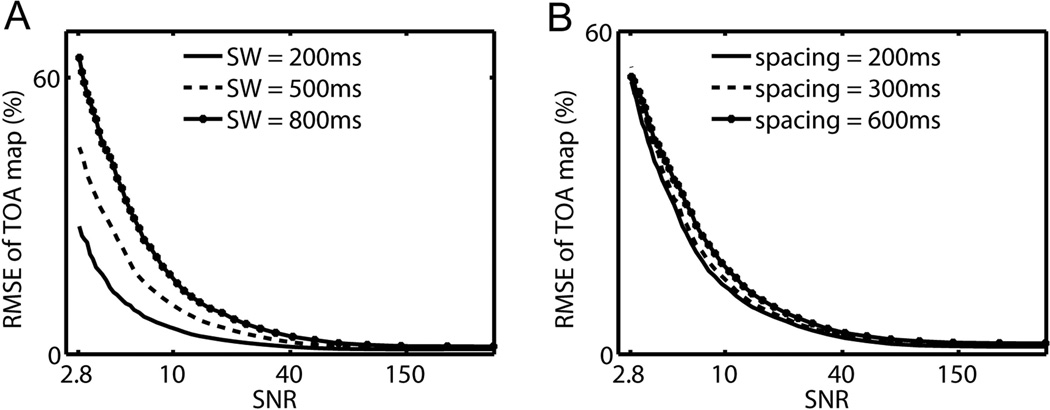
TOA mapping dependence on sequence parameters is shown in Figure 4. For all tested parameters, RMSE value of the TOA map monotonically decreases as SNR increases. In Figure 4(A), substantial differences are seen among different sampling window lengths. Shorter sampling windows provide higher accuracy at the cost of proportionally longer scan times. In Figure 4(B), limited differences in accuracy are observed among different time spacing values. As supported by this result, when scan time is a limiting factor, time spacing can be sacrificed.
Figure 4.
(A) RMSE-SNR curve with sampling window (SW) lengths: 200, 500, and 800 ms. (B) RMSE-SNR curve with time spacings: 200, 300, and 600 ms.
In-Vivo Study
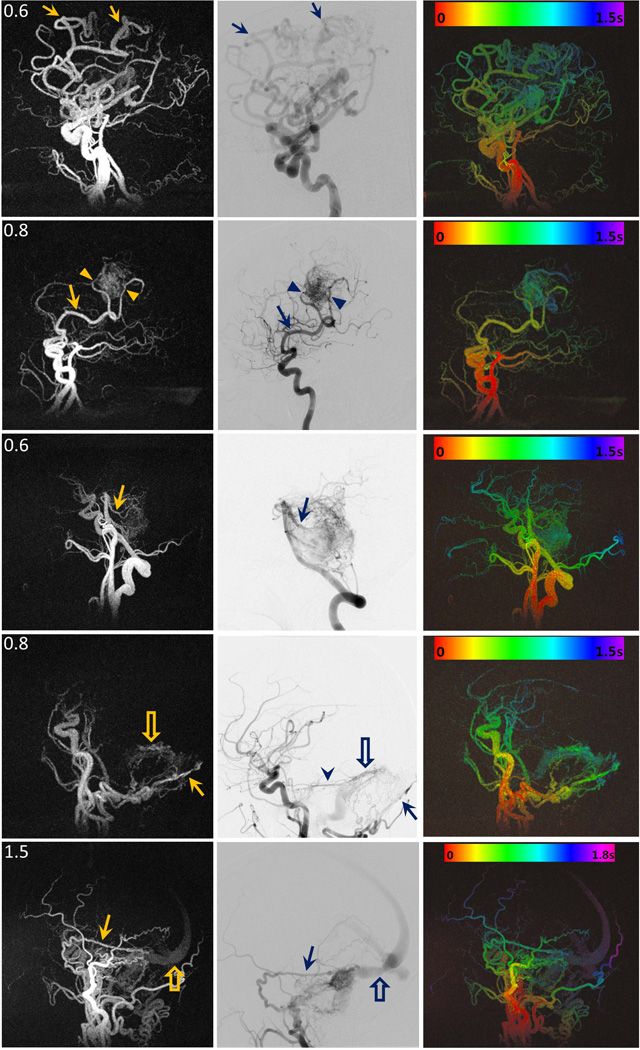
Figure 5 shows the image results of patient study in sagittal view in three columns: time frame MIP images of dynamic PCASL MRA at one time point, the corresponding lateral projection from DSA exam, and colorized MIP TOA maps.
Figure 5.
Image results of each patient: (left column) time frame MIP images of dynamic PCASL MRA at one time point, (middle column) the corresponding lateral projection from DSA exam, (right column) colorized MIP TOA maps with time-color bar. In Patient A (1st row), the arrows point to the branches of the left callosal marginal artery that supplied a large left frontal-parietal AVM. In Patient B (2nd row), the arrows point to right angular artery and parietal branches (arrowheads) that supplied a right parietal AVM. In patient C (3rd row), the arrows point to one of the brainstem AVM supplies: superior cerebellar arteries. In patient D (4th row), the arrows point to the occipital artery as the supply of a left posterior fossa DAVF, and the open arrows point to the early visualization of the antegrade flow in the transverse sinus. The arrowhead in DSA image point to another supply: the left tentorial artery that was not visualized in dynamic PCASL MRA image due to insufficient spatial resolution. In patient E (5th row), the arrows point to the right posterior meningeal artery as one of the supplies of a right posterior fossa DAVF, and the open arrows point to drainage from the transverse sinus. The filling patterns from red (entry of labeled blood) to purple (farthest reach of labeled blood allowed by PCASL tagging duration) are shown in all five colorized TOA maps.
In the first three rows of AVM patients, all arterial pedicles are well visualized in dynamic PCASL MRA: 1st patient had a large left frontal-parietal AVM supplied by the branches (arrows) of the left callosal marginal artery; 2nd patient had a right parietal AVM supplied by the right angular artery (arrows) and parietal branches (arrowheads); 3rd patient had a large brainstem AVM supplied by the basilar artery via small perforating vessels and superior cerebellar arteries (arrows).
In 4th patient who had a left posterior fossa DAVF with AV transit time of about 400 ms, both the arterial supply (the occipital artery (arrows)) and the venous drainage (antegrade outflow into the transverse sinus (open arrows)) are visualized in dynamic PCASL MRA. However, a left tentorial artery that is visualized by DSA (arrowhead) is not delineated on dynamic PCASL MRA due to limited spatial resolution. The 5th patient had a right posterior fossa DAVF supplied by multiple right external carotid artery branches and the right tentorial artery. The right posterior meningeal artery (arrows) feeder is clearly delineated on the sagittal MIPs. The longer tagging duration (2.0 s) used in this case improved visualization of the transverse sinus (open arrows) but was not long enough to demonstrate the cortical venous drainage that can be identified on the DSA exam (not shown).
Compared to DSA, dynamic PCASL MRA depicted 7 of 8 arterial pedicles (scores > 3); AVM location and nidus size measurement were consistent with DSA except in one instance where the nidus was diffuse and did not have discreet margins; there was good delineation of the venous components of the DAVFs but the cortical venous reflux in one case was not well visualized on dynamic PCASL MRA.
DISCUSSION
In this work, we investigated the feasibility of accelerated 4D PCASL MRA with 3D radial sampling. With acceleration factors as high as 30×, this technique is able to simultaneously achieve a high temporal resolution, high isotropic spatial resolution, and whole head coverage with a single scan of 7–8 minutes. This technique shows promise to provide detailed characterization of angio-architecture and hemodynamics of fast flow brain lesions.
This technique relies on radial sampling to provide not only acceleration but also robustness to artifacts. Since the bolus in PCASL exhibits minimal dispersion, dramatic contrast differences arise due to bolus advancement, with smaller changes from T1 recovery and RF saturation. In Cartesian sampling, the resulting k-space inconsistency causes severe ghosting artifacts at the leading edge of the bolus as shown in digital experiments. In radial sampling, data inconsistencies due to bolus advancement lead to blurring of the leading edge and increased angular undersampling artifacts. Radial acquisitions additionally demonstrated improved TOA mapping accuracy over Cartesian also due to the fact that center k-space is collected in every TR. This allowed effective deconvolution of bolus edge blurring.
Previous works have shown the possibility of dynamic PCASL MRA with two schemes: one is to acquire time frames with separate scans resulting a total scan time too long for practical use; the other is to use multi-phase bSSFP acquisition following the tagging. The latter scheme has been applied in 4D PASL MRA and validated in brain AVM patients (4) due to its scan efficiency. However, images suffer from the signal loss due to bSSFP readouts, especially in late time frames. Our method acquires dynamics by extending tagging duration like the former scheme and addresses the efficiency issue by reducing control data redundancy and using high acceleration. With a fixed short length of sampling window, the signal loss from RF saturation is limited and equalized amongst all the time frames. Therefore, dynamic PCASL MRA provides time frame images with not only higher but also more consistent SNR. The visualization of the AVM venous drainage can be improved by extending the tagging duration if higher acceleration factor is provided.
In this work, dynamic PCASL MRA has been validated with a pilot clinical study including 3 AVM patients and 2 DAVF patients. Only one arterial pedicle was not visualized due to insufficient spatial resolution, and one nidus measurement was not accurate due to the diffuse nature of the nidus which did not have a distinct border. The venous drainage was visualized in the DAVF patients but incompletely visualized in the AVM cases due to insufficient tagging duration. Hemodynamics could be observed from the time series of images or/and the TOA map both of which showed good agreement with DSA exams. This study is limited by small number of subjects and short tagging duration. Future validation studies with larger number of patients and standardized parameters are necessary to evaluate performance in a heterogeneous population.
ASL techniques suffer several drawbacks compared to CE-MRA. Primarily, ASL poorly depicts slow flow due to T1 recovery. Therefore, dynamic ASL angiography has preference in applications with high flow. Furthermore, despite the high acceleration factors, dynamic PCASL MRA requires a long 7–8 minute scan which makes this method prone to patient motion. If higher spatial resolution or longer tagging duration is required, the scan time might be even longer making it more difficult for patients to endure. The scan time can be shortened with the usage of novel reconstruction methods to provide higher acceleration factor.
In conclusion, the new non-invasive and non-contrast angiography technique dynamic PCASL MRA has demonstrated its feasibility in high flow brain lesions. Other potentials are under development and validation, including vessel selective imaging and acceleration with compressed sensing.
Acknowledgments
Grant support: NIH Grants -- R01NS066982
REFERENCE
- 1.da Costa L, Wallace M, Ter Brugge K, O'Kelly C, Willinsky R, Tymianski M. The Natural History and Predictive Features of Hemorrhage from Brain Arteriovenous Malformations. Stroke. 2009;40(1):100–105. doi: 10.1161/STROKEAHA.108.524678. [DOI] [PubMed] [Google Scholar]
- 2.Maki JH, Prince MR, Chenevert TC. Optimizing Three-Dimensional Gadolinium-Enhanced Magnetic Resonance Angiography. Investigative Radiology. 1998;33(9):528–537. doi: 10.1097/00004424-199809000-00008. [DOI] [PubMed] [Google Scholar]
- 3.Bi X, Weale P, Schmitt P, Zuehlsdorff S, Jerecic R. Non-Contrast-Enhanced Four-Dimensional (4D) Intracranial MR Angiography: A Feasibility Study. Magn Reson Med. 2010;63:835–841. doi: 10.1002/mrm.22220. [DOI] [PubMed] [Google Scholar]
- 4.Yu S, Yan L, Yao Y, Wang S, Yang M, Wang B, Zhuo Y, Ai L, Miao X, Zhao J, Wang D. Noncontrast dynamic MRA in intracranial arteriovenous malformation (AVM): comparison with time of flight (TOF) and digital subtraction angiography (DSA) Magnetic Resonance Imaging. 2012;30(6):869–877. doi: 10.1016/j.mri.2012.02.027. [DOI] [PMC free article] [PubMed] [Google Scholar]
- 5.Bieri O, Scheffler K. Flow Compensation in Balanced SSFP Sequences. Magn Reson Med. 2005;54(4):901–907. doi: 10.1002/mrm.20619. [DOI] [PubMed] [Google Scholar]
- 6.Markl M, Alley MT, Elkins CJ, Pelc NJ. Flow Effects in Balanced Steady State Free Precession Imaging. Magn Reson Med. 2003;50:892–903. doi: 10.1002/mrm.10631. [DOI] [PubMed] [Google Scholar]
- 7.Storey P, Li W, Chen Q, Edelman RR. Flow Artifacts in Steady-State Free Precession Cine Imaging. Magn Reson Med. 2004;51:115–122. doi: 10.1002/mrm.10665. [DOI] [PubMed] [Google Scholar]
- 8.Dai W, Garcia D, de Bazelaire C, Alsop D. Continuous flow-driven inversion for arterial spin labeling using pulsed radio frequency and gradient fields. Magn Reson Med. 2008;60(6):1488–1497. doi: 10.1002/mrm.21790. [DOI] [PMC free article] [PubMed] [Google Scholar]
- 9.Koktzoglou I, Gupta N, Edelman R. Nonenhanced extracranial carotid MR angiography using arterial spin labeling: improved performance with pseudocontinuous tagging. J Magn Reson Imaging. 2011;34(2):384–394. doi: 10.1002/jmri.22628. [DOI] [PubMed] [Google Scholar]
- 10.Robson P, Dai W, Shankaranarayannan A, Rofsky N, Alsop D. Time-resolved vessel-selective digital subtraction MR angiography of the cerebral vasculature with arterial spin labeling. Radiology. 2010;257(2):507–515. doi: 10.1148/radiol.10092333. [DOI] [PMC free article] [PubMed] [Google Scholar]
- 11.Okell TW, Chappell MA, Schulz UG, Jezzard P. Quantification of Vessel-Encoded Arterial Spin Labeling Dynamic Angiography with Auto-Calibration. Proc Intl Soc Mag Reson Med. 2011;19:3405. [Google Scholar]
- 12.Barger A, Block W, Toropov Y, Grist T, Mistretta C. Time-Resolved Contrast-Enhanced Imaging With Isotropic Resolution and Broad Coverage Using an Undersampled 3D Projection Trajectory. Magn Reson Med. 2002;48:297–305. doi: 10.1002/mrm.10212. [DOI] [PubMed] [Google Scholar]
- 13.Wu H, Block WF, Turski PA, Mistretta CA, Johnson KM. Noncontrast-enhanced three-dimensional (3D) intracranial MR angiography using pseudocontinuous arterial spin labeling and accelerated 3D radial acquisition. Magn Reson Med. 2013;69(3):708–715. doi: 10.1002/mrm.24298. [DOI] [PMC free article] [PubMed] [Google Scholar]
- 14.Wong E. Vessel-encoded arterial spin-labeling using pseudocontinuous tagging. Magn Reson Med. 2007;58(6):1086–1091. doi: 10.1002/mrm.21293. [DOI] [PubMed] [Google Scholar]
- 15.Beatty PJ, Nishimura DG, Pauly JM. Rapid gridding reconstruction with a minimal oversampling ratio. IEEE Trans Med Imaging. 2005;24(6):799–808. doi: 10.1109/TMI.2005.848376. [DOI] [PubMed] [Google Scholar]
- 16.McKenzie CA, Yeh EN, Ohliger MA, Price MD, Sodickson DK. Self-calibrating parallel imaging with automatic coil sensitivity extraction. Magn Reson Med. 2002;47(3):529–538. doi: 10.1002/mrm.10087. [DOI] [PubMed] [Google Scholar]
- 17.Riederer S, Haider C, Borisch E. Time-of-Arrival Mapping at Three-dimensional Time-resolved Contrast-enhanced MR Angiography. Radiology. 2009;253(2):532–542. doi: 10.1148/radiol.2532082322. [DOI] [PMC free article] [PubMed] [Google Scholar]
- 18.Lu H, Clingman C, Golay X, van Zijl PC. Determining the longitudinal relaxation time (T1) of blood at 3.0 Tesla. Magn Reson Med. 2004;52(3):679–682. doi: 10.1002/mrm.20178. [DOI] [PubMed] [Google Scholar]


