Abstract
Meaningful representation and effective retrieval of video shots in a large-scale database has been a profound challenge for the image/video processing and computer vision communities. A great deal of effort has been devoted to the extraction of low-level visual features such as color, shape, texture, and motion for characterizing and retrieving video shots. However, the accuracy of these feature descriptors is still far from satisfaction due to the well-known semantic gap. In order to alleviate the problem, this paper investigates a novel methodology of representing and retrieving video shots using human-centric high-level features derived in brain imaging space (BIS) where brain responses to natural stimulus of video watching can be explored and interpreted. At first, our recently developed Dense Individualized and Common Connectivity-based Cortical Landmarks (DICCCOL) system is employed to locate large-scale functional brain networks and their ROIs (regions of interests) that are involved in the comprehension of video stimulus. Then, functional connectivities between various functional ROI pairs are utilized as BIS features to characterize the brain’s comprehension of video semantics. Then an effective feature selection procedure is applied to learn the most relevant features while removing redundancy, which results in the formation of the final BIS features. Afterwards, a mapping from low-level visual features to high-level semantic features in the BIS is built via the Gaussian Process Regression (GPR) algorithm, and a manifold structure is then inferred in which video key frames are represented by the mapped feature vectors in the BIS. Finally, the manifold-ranking algorithm concerning the relationship among all data is applied to measure the similarity between key frames of video shots. Experimental results on the TRECVID 2005 dataset have demonstrated the superiority of the proposed work in comparison with traditional methods.
Keywords: Brain imaging space, video shot retrieval, functional magnetic resonance imaging, Gaussian Process regression
1. Introduction
With the explosive growth of digital video data, efficient management and retrieval of large-scale video databases have become increasingly important in recent years. A typical content-based video retrieval system involves a series of key techniques such as video structural analysis, feature representation, and similarity measurement. A video generally consists of sequences or stories, which are composed of numerous scenes [1]. Scenes can be further parsed into a set of shots. As the actual physical basic layer in video, a shot contains a number of frames describing a continuous action. Shot-based retrieval serves as the basis for video retrieval [55, 29], where two crucial issues need to be solved: how to meaningfully represent shots and how to measure similarity between shots. Most existing approaches extract key frames from each shot and measure the similarity between shots based on their key frames. Key frames are still images which can reasonably represent the content of video shots in an abstracted manner.
The capability of current methodologies of video representation and retrieval is rather limited due to the insurmountable gap between low-level features used by machines and high-level semantics perceived by the human brain’s cognitive systems. To alleviate this problem, first, many researchers attempted to design sophisticated feature descriptors that are more accurate and richer to describe visual content such as SIFT [2], SURF [3], and Bag-of-Words (BoW) [4]. The second line of research is to design biologically plausible features that can mimic human vision perception mechanisms, for example, cortex-like features and visual attention-based features [5–6]. The third school of approaches applied supervised learning algorithms to select the most relevant or discriminative features from the feature bank with the motivation of keeping the human in the loop. In these methods, human subjects can manually offer classification labels, preferences, and ranks to visual data [8]. Therefore, the semantic gap may be narrowed by taking the advantage of human’s guidance. Nevertheless, this type of human guidance generally can only provide subjective, rough, and sometimes ambiguous and incomplete information, which may lead to a weak learning performance. Moreover, traditional computational methods rely on data mining technique and totally ignore the human brain behaviors in visual understanding, and thus are incapable of leveraging the intrinsic mechanisms of human brain perception and cognition. The limited space in this paper does not allow us to extensively review existing work. A systemic summary of techniques used in video retrieval can be found in a recent survey [10].
Essentially, human brains are the end users and evaluators of video content and representation, and quantitative modeling of the interactions between video streams and the brain’s responses can provide meaningful guidance for video representation and retrieval. In recognition of this potential, in recent years, exploring the functional interactions among brain networks under the natural stimulus of watching video and applying neuroscience principles to deeply understand semantics of visual content have become a newly arising trend, which is potentially promising to offer a superior mechanism to bridge the semantic gaps. For instance, the work of [11–12] proposed an electroencephalography (EEG)-based brain machine interface system to achieve image annotation and retrieval where human brain responses while viewing images captured by an EEG and image visual features are combined. In [13], Kapoor et al. adopted the Pyramid Match Kernel to integrated image visual features and EEG responses from various subject brains for image object categorization.
However, in-vivo EEG usually collects brain signals via electrodes placed around human scalp, resulting in limited spatial resolutions and inability to capture the full-length comprehensive semantics of brain responses to videos. In contrast, functional magnetic resonance imaging (fMRI) is a powerful tool to probe and monitor human full-brain activity for cognition. For example, the milestone work in [14] has demonstrated that there are high temporal correlations between relevant fMRI signals and semantic content in the movie stream, which has provided strong evidence that fMRI time series data is potentially able to model the functional interaction between the human brain and multimedia information. In [16], Walther et al. performed pattern analysis using fMRI data to study which set of regions of the brain can differentiate natural scene categories. The work of [17] explored the decoding method based on correlations between visual stimuli and fMRI activity in early visual areas for image identification. Recently, Hu et al. [19, 54] developed a video classification model by correlating fMRI-derived brain responses and low-level features by using the PCA-CCA algorithm. Li et al. [20] built a human-centric video summarization framework via the optimization of attentional models by using fMRI data as the benchmark.
In general, fMRI-derived functional brain activity in response to video stimuli can quantitatively, objectively, and effectively reflect the brain’s comprehension of video content. In BIS, we are able to look into the functional interactions among relevant brain networks involved in video comprehension, and thus derive a wealth of high-level semantics. This motivates us to develop a generalized human-centric video representation and retrieval framework based on brain cognition related features inferred in BIS. In this paper, we extensively extended our preliminary work in [21] and designed a novel computational framework as illustrated in Fig. 1. The proposed computational framework is composed of two components: video shot representation and video shot retrieval. To represent video shots in the BIS, we firstly randomly select a subset of video shots from a large-scale video database and use them as the natural stimulus for fMRI scanning when the human subjects are watching video streams. Afterwards, 358 consistent and dense brain ROIs defined by our DICCCOL system [22] are located in each subject’s brain via our brain ROI prediction methods [35]. The relevant fMRI signals associated with 358 ROIs are then acquired. Subsequently, functional connectivities between various DICCCOL ROI pairs are utilized as BIS features to represent the brain’s comprehension of video semantics. An effective two-stage feature selection procedure is applied to derive the most relevant features while removing redundancy, which results in the formation of the finally obtained BIS features. Meanwhile, the feature selection provides a data-driven scheme to identify DICCCOL ROIs that are most relevant to video comprehension. Since fMRI scanning is quite expensive and time-consuming, we can only acquire a relatively small amount of fMRI datasets for predictive model learning. However, we can yield plenty of low-level visual features easily. Thus, we aim to build a mapping from low-level visual features to high-level fMRI-derived semantic features by using the GPR [30, 31], given a small number of scanned fMRI datasets in the training stage. Essentially, the mapping substantively realizes the identification and selection of visual features that most correlate with the human cognition of video understanding. The learned mapping can then be regarded as a primitive form of “mind-reading”, which predicts BIS features for any video shots without fMRI scanning data. In this way, each video shot in the database can be represented in BIS. In the component of video shot retrieval, a manifold structure is inferred where video key frames are represented in BIS. Given a query of video shot, the manifold-ranking [23, 25] algorithm concerning the relationship among all data on the manifold is applied to measure the similarity between key frames and rank the retrieved shots.
Fig. 1.
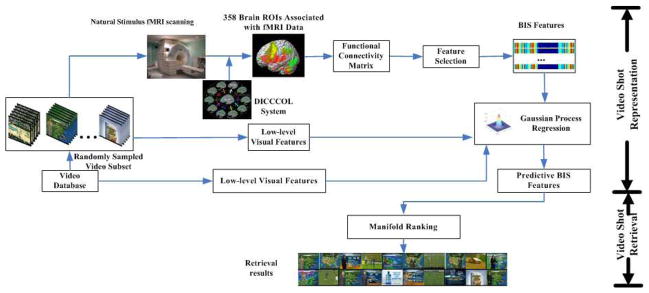
The overall architecture of the proposed framework.
The work in this paper is a substantial extension of our preliminary study in [21] and there are several major novelties and differences as follows. First, we combined the powerful diffusion tensor imaging (DTI) data with fMRI brain imaging data to accurately map and annotate the large-scale functional networks that are potentially involved in the perception and cognition of video clips. This brain imaging method significantly improved the quantitative measurement of functional brain responses so that our high-level brain imaging features could be much more comprehensive and systematic. Second, this work proposes a generalized methodology for representing video shots in the BIS, whereas the study in [21] only considered a special case of two classes of videos. To build the generalized methodology, the feature selection is an essential component and we develop a two-stage approach in this paper, whereas the feature selection was not explored in [21]. Third, in [21], 30 ROIs identified by task-based fMRI were used to measure the brain responses to video stimulus. In this work, we propose a novel data-driven approach, named DICCCOL as mentioned previously, to systematically identify and locate large-scale ROIs involved in video comprehension. Specifically, we apply the DICCCOL system to collect 358 dense and consistent ROIs and then use feature selection algorithms to select a set of pairwise functional connectivities to measure the distinct brain responses involved in the comprehension of different video categories. Comparing with [21], this work avoids large-scale task-based fMRI acquisition, which is very time-consuming and expensive. More importantly, the DICCCOLs can provide more comprehensive, accurate, and reliable ROIs to measure the brain responses during video comprehension. Therefore, this work can further improve the performance of [21], which will be demonstrated in subsection 4.1 (Fig. 5). Fourth, in this work, we explore and present more in-depth theoretic analysis, provide a more extensive discussion of related literatures, and perform more comprehensive experimental evaluations.
Fig. 5.

The comparison of KNN-based classification using features of brain responses from the 30 ROIs and the 358 ROIs. p is the p-value of the t-test in feature selection.
The rest of this paper is organized as follows. Section 2 describes video key frame representation in the BIS. Section 3 introduces video shot retrieval by using manifold-ranking approaches. The experiments and results are reported in Section 4. Finally, the conclusions are drawn in Section 5.
2. Representing key frames in the BIS
2.1 Brain ROI identification and localization
In principle, brain function is realized via large-scale structural and functional connectivities [36–38]. The functional connectivities and interactions among relevant brain networks reflect the brain’s comprehension of video stimuli [36–38]. In particular, the working memory [45], vision [47], language [48], emotion [49], semantics [50], attention [53], and motor [52] brain networks are among the most relevant functional systems that are involved in the comprehension of natural movies.
In the functional brain imaging field, task-based fMRI has been widely regarded and used as a benchmark approach to localizing functionally-specialized brain regions. As a result, a large amount of fMRI tasks have been designed and published in the fMRI community [15] to map functional brain networks and their ROIs. However, it is impractical to acquire large-scale task-based fMRI data for the same group of subjects due to the cost and time constraints. In addition, the human brain’s responses to the natural stimulus of watching videos could be very complex and involve many different functional networks such as visual, auditory, emotion, working memory, attention, language, and many others. It is infeasible to localize relevant large-scale functional networks involved in the comprehension of movie watching via traditional task-based fMRI analysis.
Recently, we developed and validated a novel data-driven strategy [22, 56] that identified 358 consistent and corresponding structural landmarks in multiple brains (colored bubbles in Fig. 2), in which each identified landmark was optimized to possess maximal group-wise consistency of DTI-derived fiber connection patterns [22, 35, 56]. The neuroscience foundation is that each brain’s cytoarchitectonic area has a unique set of extrinsic inputs and outputs, named the “connectional fingerprint” in [51], which principally determines the functions that each brain area could perform. This close relationship between structural connection pattern and brain function has been confirmed and replicated in a variety of recent studies in the literature [51] and our own works in [22, 35, 56]. This set of 358 structural brain landmarks is named DICCCOL and has been replicated in four separate healthy populations [22]. Importantly, this set of 358 ROIs can be accurately and reliably predicted in an individual subject based only on DTI data [35], demonstrating the remarkable reproducibility and predictability of DICCCOLs. The collection of 358 DICCCOLs has already been released online at: http://dicccol.cs.uga.edu for additional visual examination and evaluation online.
Fig. 2.
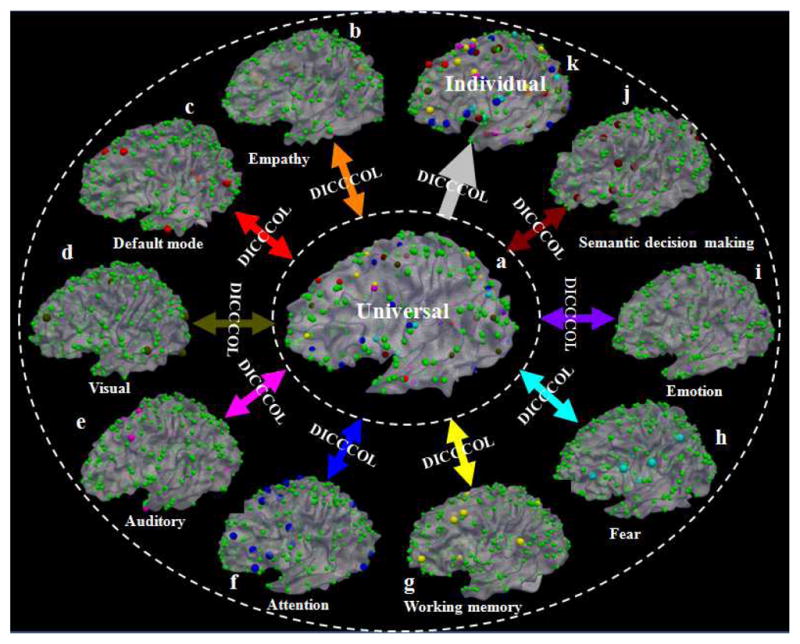
Nine different functionally-specialized brain networks ((b)-(j)) identified from different fMRI datasets are integrated into the same universal brain reference system (a) via the 358 DICCCOL ROIs. Then, the functionally-labeled landmarks in the universal space can be predicted in each individual brain with DTI data such that DICCCOL ROIs and their functional identities can be transferred to a local coordinate system (k).
In addition, we have used six different multimodal DTI and fMRI datasets (including both task-based fMRI and resting state fMRI) to functionally label these DICCCOL ROIs [22] (as shown in Fig. 2). In our current collection of DICCCOL ROIs [22], there are 95 ROIs that have already been functionally annotated into the brain regions in nine functional networks including working memory, visual, auditory, semantics, attention, emotion, fear, empathy, and default mode networks. DICCCOL enables us to measure functional interactions among large-scale relevant brain networks (particularly those involved in video processing and comprehension [19–21, 54]) without the need to perform large-scale costly task-based fMRI scans on the participating subjects.
This paper proposes to employ our DICCCOL system to localize large-scale relevant functional networks involved in the comprehension of movie watching as follows. First, we predict the set of 358 dense and consistent DICCCOL landmarks that provide a common and individualized brain reference system in each participant’s brain based on DTI data. Afterwards, the data-driven method of feature selection (Subsection 2.3) is adopted to infer the brain’s functional interaction patterns from natural stimulus fMRI data, which can simultaneously identify and localize the most relevant DICCCOL brain ROIs involved in video comprehension.
2.2 FMRI data acquisition and ROI prediction
To explore brain comprehension to video contents, we developed an experimental paradigm to perform fMRI scanning when human subjects were watching video stimulus. Four healthy young adults were recruited at The University of Georgia (UGA) under IRB approvals to participate in this study. MRI data was acquired in a GE 3T Signa HDx MRI system using an 8-channel head coil at the UGA. The multimodal DTI and fMRI scans were performed in three separate scan sessions for each participating subject. DTI scans were performed for each participant to localize their DICCCOL ROIs. DTI data was acquired using the isotropic spatial resolution 2mm×2mm×2mm; parameters were: TR=15.5s, TE=min-full, b-value=1000 for 30 DWIs and 3 B0 volumes. DTI data preprocessing includes skull removal, motion correction and eddy current correction [56]. T1-weighted structural MRI data with 1mm×1mm×1mm isotropic resolution was acquired for each subject for anatomical reference.
To perform natural stimulus fMRI scanning, 51 video shots belonging to the semantic categories of sports, weather report and commercial advertisement (20 sports, 19 weather reports and 12 commercial advertisements, respectively) were randomly selected from the TRECVID 2005 database and were composed into 8 clips. Each clip is about 11 minutes long. These clips were presented to the four subjects during fMRI scan via MRI-compatible goggles. The scan parameters are as follows: 30 axial slices, matrix size 64×64, 4mm slice thickness, 220mm FOV, TR=1.5s, TE=25ms, ASSET=2. The strict synchronization between movie viewing and fMRI scan was achieved via the E-prime software [18].
The preprocessing of fMRI data includes skull removal, motion correction, spatial smoothing, temporal prewhitening, slice time correction, and global drift removal. The brain ROI prediction approach in [35] was used to localize the 358 DICCCOLs in the scanned subjects with DTI data. Then, natural stimulus fMRI signals were extracted for each of these 358 DICCCOLs after linearly transforming the ROIs to the fMRI image space. Afterwards, the PCA (principal component analysis) was applied on the multiple fMRI time series within each ROI for extracting a representative fMRI signal [56]. The eigenvector corresponding to the largest eigenvalue was defined as the representative fMRI signal for this ROI.
2.3 Feature extraction in the BIS
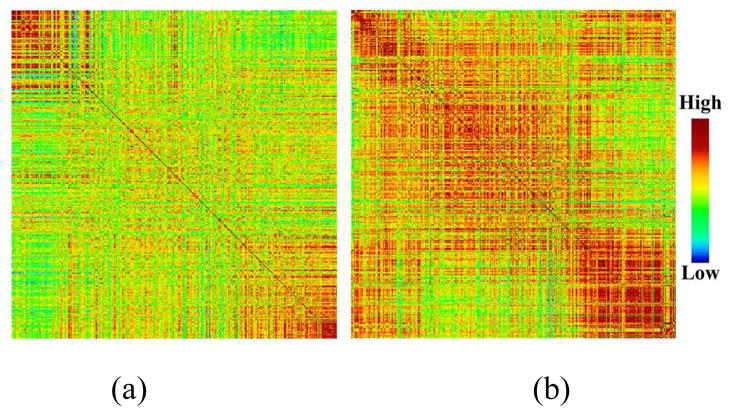
In the neuroscience field, functional connectivities [26] among relevant brain ROIs have been widely used to reflect meaningful interactions within brain networks. In this paper, we also adopt the functional connectivities of brain ROIs within each video shot time interval as the high-level semantic features in the BIS to model and describe the human brain’s responses to natural stimulus of watching video streams. Typically, the functional connectivity between two ROIs is measured as the Pearson correlation coefficient between their fMRI time series. As a result, for each scanned video shot, we constructed a 358×358 connectivity matrix. Fig. 3 shows two randomly selected examples of the connectivity matrix corresponding to two different types of video shots (sports and commercial). As can be seen, the connectivity patterns for the two shots are quite different. For example, the functional interactions are globally much stronger when watching the commercial shot compared with that when watching the sport shot. This observation is reasonable given the fact that the content in commercial videos is typically much more complex for participant to comprehend, in comparison with that in sport videos.
Fig. 3.
Two randomly selected examples of functional connectivity matrices upon 358 brain ROIs from one subject for two video shots. (a) A sport shot. (b) A commercial shot.
In our previous work [21], we used a functional connectivity matrix built on 30 functional brain ROIs to form the BIS and represent video shots. However, video is typically a synthesis of visual, aural, textual information. The functional brain mechanism for video comprehension may be far beyond what 30 brain ROIs can account for. In this paper, we employ a data-driven approach to select relevant fMRI response features from 358 consistent and dense ROIs that can cover the whole brain to represent video shots. We expect that an effective feature selection procedure can pick up the most relevant brain networks and their ROIs that are involved in video comprehension. If we directly use all elements in the 358×358 connectivity matrix as the high-level features in the BIS, the size of the feature vector is 63,903 dimensions, which is apparently not a concise and informative representation. Our strategy is to use the 358 ROIs to construct an over-complete ROI set. Then, we employ supervised feature selection upon the over-complete set to seek the most relevant features that are able to differentiate various video classes while removing redundant features. The selected features finally form the BIS and are used as the feature vector to represent video shots. At the same time, this feature selection procedure provides a data-driven method to automatically identify brain ROIs that are most involved in video perception and cognition. It can overcome the shortcoming of traditional methods that apply task-based fMRI to derive brain activations and identify ROIs under the hypothesis that brain networks activated by tasks can represent the complex content of video streams.
In general, the objectives of feature selection are twofold. One is to maximize feature relevance. The other is to minimize feature redundancy. It is worth noting that most current feature selection algorithms are incapable of achieving the above two objectives upon a very large dimensional feature set (for example, 63,903) in practice. Accordingly, this paper implements a two-stage procedure to fulfill the relevance maximization and the redundancy minimization of feature selection separately, which has been demonstrated to be effective for our study by experiments (subsection 4.2).
The first stage of feature selection mainly attempts to achieve relevance maximization. In this paper, we adopt a statistical test of Analysis of Variance (ANOVA) [27]. It treats each dimensional feature as an independent variable and determines each dimensional feature’s relevance individually by evaluating its correlation with the target class. Given a dimensional feature with the sample fi,j for the i th class and j th data point, the core idea is to perform the F-test [27, 57] to assess whether the expected values of this dimensional feature within several target classes differ from each other, which can be formulated as [27, 57]:
| (1) |
| (2) |
| (3) |
Here, C is the number of classes and Bi is the number of samples in the i th class. Essentially, a feature resulting in significant differences between classes indicates a trend that it has a high impact on classification, which is called the feature relevance. Then, the results of F are tested for statistical significance or p -value [27, 58], where the p -value is the estimated probability of rejecting the null hypothesis of a study question when that hypothesis is true. If the p -value of a feature is small, it implies there is strong evidence that the differences between classes are big, i.e. the feature is relevant. Therefore, we achieve the feature relevance maximization by comparing the p -value against a significance level γ [27, 57]. The set of features whose p -values are less than γ is considered as the most relevant features and then is selected to be processed at the second stage. The implementation details of one-way ANOVA can be found in [27].
Since the first stage of feature selection evaluates each dimensional feature individually, it cannot handle feature redundancy. This problem is left to be tackled at the second stage. In the proposed work, the Correlation-based Feature Selection (CFS) algorithm [28] is adopted as the second stage of feature selection because of its good performance. It is a heuristic method for evaluating the worth of a subset of features by taking into account feature-class and feature-feature correlations simultaneously. The hypothesis behind the heuristic can be simply described as: good feature subsets consist of features of highly correlating with the class while uncorrelating with each other. Given a feature subset S consisting of k features, its CFS can be calculated by [28]:
| (4) |
Here, f ∈ S is a feature and CL denotes a class. and are the mean feature-class correlation and the mean feature-feature correlation, which can be computed according to symmetrical uncertainty [28]. By following [28], the feature subset S* with the maximal Merit (Eq. (4)) can be efficiently found and is selected as the final features. The maximal Merit often corresponds to the minimal feature-feature correlation. In this way, the feature redundancy minimization is achieved.
2.4 Mapping from visual space to BIS via GPR
As mentioned before, the acquisition of high-level features in the BIS via fMRI scanning under natural stimulus is expensive and costly indeed. It is impractical to carry out fMRI scan for all video shots of a large-scale video collection. On the other hand, machines can produce plenty of visual features easily by current image processing and computer vision techniques. Therefore, we propose to learn a mapping from the visual features to the semantic features in the BIS using some training data, which results in predictions of semantic features given corresponding visual features. The mapping from the visual features to the fMRI-derived semantic features can be regarded as a primitive form of “mind-reading” that can find low-level features strongly correlating to brain behavior in differentiating video shots. The learning of this mapping can be mathematically formulated as a linear regression problem:
| (5) |
where x is the low-level visual feature vector, y is the high-level BIS feature vector, ϕ(x) is the basis functions, and ε is Gaussian noises. The weight vector w is the objective of learning. GPR allows a simple analytical treatment of exact Bayesian inference, is powerful for modeling non-linear dependencies, and has been demonstrated to achieve good performance. It is therefore used in our framework for learning the mapping. As described in [30, 31], the GPR can be efficiently implemented by defining the kernel function instead of directly choosing basis functions. However, the standard GPR algorithm [30] mainly aims at the prediction of a single output and ignores the correlations among output components. Recently, an improved GPR algorithm called Twin Gaussian Process (TGP) [31] was presented to remove these drawbacks. In our work, we utilized TGP to implement the regression. The details of TGP were provided in [31] whereas this paper only described the basic implementation process in Algorithm 1.
Algorithm 1.
TGP Regression to Map Features from Visual Space to BIS [31]
| Input: N training data represented by visual features as: X = (x1,x2,…,xN), with xi = (xi,1, xi,2,…,xi,d1) and represented by BIS features as: Y = (y1,y2,…,yN), with yi = (yi,1, yi,2,…, yi,d2); | |
| A test data with only visual features, xN+1. | |
| Output: Predicted BIS features of the test data, yN+1. | |
| Step1: Compute the kernel matrix KX and KY, where | |
|
| |
| Here, θx ≥ 0 is the kernel width parameter, λx ≥ 0 is the noise variance, and δi,j is the Kronecker delta function. KY is defined in the same way; | |
| Step2: For xN+1, predict yN+1 by optimizing the following function [31]: | |
|
| |
| where and Equation. is a N × 1 column vector with ; | |
| Return: yN+1. |
3. Retrieving video shots in BIS using manifold-ranking
Recently, manifold learning has been successfully applied to image retrieval tasks [23, 24], which works under the assumption that manifold structure is more powerful than traditional Euclidean structure to represent data. Instead of assuming that the image space is a Euclidean space and estimating similarity between images based on their Euclidean distance, the works [23, 24] weakly assume that the image space is a Riemannian manifold embedded in the feature space, which is called image manifold. Then, these works mainly focus on discovering the intrinsic geometrical structure of the image manifold and estimating the similarity between images based on the geodesic distance on the image manifold. In this paper, we basically follow the idea of [23, 24] whereas we explore the video manifold in BIS rather than in low-level visual feature space or the space based on limited and subjective user interactions.
3.1 Geometrical structure of video manifold in BIS
We suppose that the key frame yi = (yi,1,…,yi,D) be a point in BIS, where D is the dimensionality of BIS feature.
For each point yi, find its K nearest neighbors based on Euclidean distance; Connect any two points with an edge if they are neighbors.
Define the affinity matrix M whose element is if there is an edge linking yi and yj. Note that self-reinforcement should be avoided, thus let Mi,i = 0.
Repeating the above steps results in constructing a graph, which models the local geometrical structure of the video manifold. The geodesic distances between all pairs of video shots on the video manifold are defined as the shortest-path distances on the constructed graph.
3.2 Performing retrieval in BIS using manifold-ranking
We adopted a manifold-ranking algorithm [25] to perform retrieval, which measures the similarity between the query and the shots in the database via examining the relationship of all data upon the intrinsic global manifold structure in the BIS, instead of the traditional way of using local pair-wise Euclidean distances based on low-level features. Its basic idea is to spread a positive ranking score assigned to the query to its nearby unlabeled neighbors on the manifold structure until a global stable stage is achieved. The details of the algorithm are summarized below.
Algorithm 2.
Manifold-Ranking for Retrieving Video Shots
| Input: The query key frame set q, geometrical structure of video manifold in BIS including N points each representing a key frame in the database. |
| Output: Ranking score vector r = (r1,…,rN) in which ri denotes the ranking score of i th key frame to q. |
| Step 1: Normalize M in subsection 3.1 by U = P−1/2MP−1/2 where P is a diagonal matrix with ; |
| Step 2: The theorem in [32] can guarantee that {ri} converges to r = β(1−αU)−1L. Here β = 1−α, L = [l1,…,lN]T is a binary vector that can indicate whether a key frame is a query or not, where li = 1 if i th point is a query, and li = 0 otherwise. |
| Return: r = (r1,…,rN) |
4. Experiments
The NIST TRECVID is a common, well-known, and publicly available video dataset [33]. It has been widely used as the benchmark for evaluating tasks such as video retrieval, video shot boundary detection, video summarization, video instance search, video copy detection, and so on, since it is large, diverse, and contains full-length video sequences. In this paper, we constructed our evaluations on the TRECVID 2005 video streams [33], which are mainly selected from the television news and NASA science programming. As summarized by [34], these data is categorized into 7 concepts such as politics, finance/business, science/technology, sports, entertainment, weather, and commercial/advertisement. TRECVID provides annotations for three concepts of videos, including sports, weather, and commercial, which were thus collected as the test data in this paper. TRECVID 2005 has provided key frames for each video shot, which were therefore used in our evaluations. As reported in [33], these key frames are extracted by a group at Dublin City University using an automatic approach. Specifically, the shot boundaries are first automatically detected by using a system developed in [59]. Then, the I-Frame nearest to the middle frame of the shot boundary is selected as a key frame.
Totally, 581 sports, 383 weather, and 343 commercial video shots from TRECVID 2005 were adopted to evaluate the proposed work. This data was randomly split into the training set and the testing set. The training set consists of 51 video shots and was utilized as the natural stimuli presented to subjects for fMRI brain imaging. This set of training data was also applied to supervised feature selection and GPR training. The rest of 1256 video shots construct the testing data. It is clear that the training data set is much smaller than the testing data set because fMRI scanning is expensive and time-consuming.
For each key frame of video shots, its original BIS feature vector is 63,903 dimensional. It becomes 5613 dimensional after using ANOVA and eventually becomes 65 dimensional after performing CFS. In recent years, the model of bag of visual words (BoW) [4] has become one of most successful methods to represent images according to local features, which was also adopted as the low-level visual features in our work. In this work, firstly, a set of SIFT [2] descriptors each being 128 dimensionality were extracted from each key frame. Then, the K-means clustering algorithm was applied to cluster all SIFT descriptors to a number of visual words. At last, each key frame was characterized by a feature vector to reflect the probabilistic distribution of those words. Here, considering that our BIS feature is 65 dimensional and the size of our training set is relatively small, in order to obtain a GPR model with good performance, we need the size of visual low-level feature vector is comparable to the size of BIS feature vector. Hence, in our implementation, the number of words in BoW was set to 65.
4.1 Mapping of brain networks and ROIs involved in video comprehension and discrimination
This work used the DICCCOL system and feature selection to identify a set of brain ROIs that are involved in video comprehension and discrimination. In our work, 65 features from the functional connectivity matrix were selected, which are associated with 93 brain ROIs in the DICCCOL system. Fig. 4 visualizes the identified functional connections and brain ROIs overlaid on a cortical surface. It is apparent that a large portion of the whole brain, including the visual, auditory, language, attention, emotion, working memory and motor systems, are involved in video comprehension, as we expected.
Fig. 4.
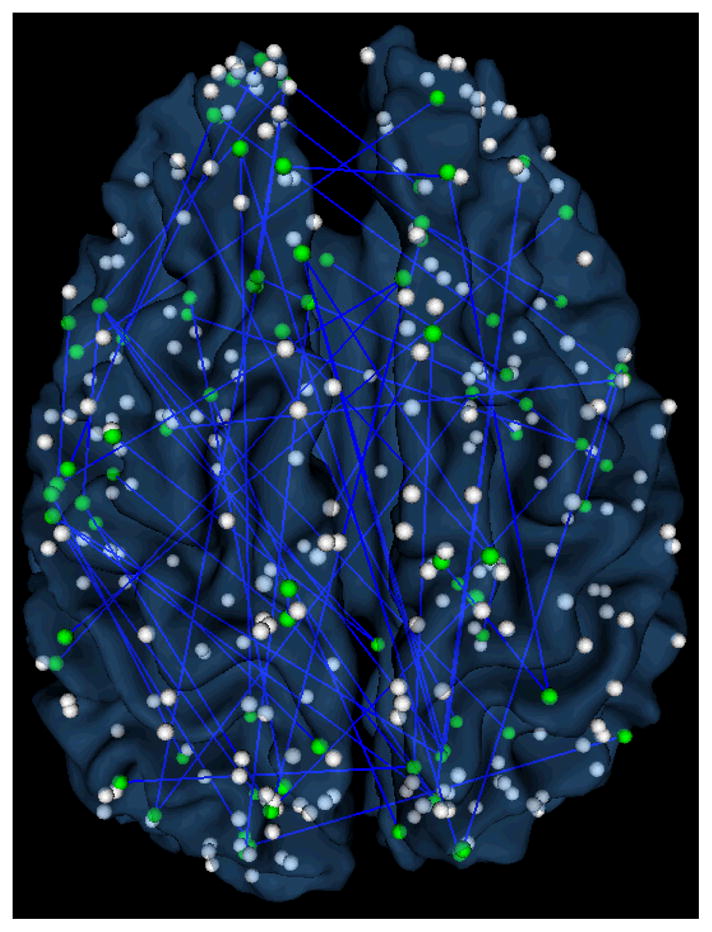
Localization visualization of identified functional connections for video comprehension and discrimination in DICCCOL system on a cortical surface. The spheres (both green and white) are the DICCCOL landmarks. The green ones are the landmarks involved in the indentified function connections. The detailed annotations of these ROIs are referred to [22].
We also labeled the functions of those 93 selected ROIs into different brain networks according to the DICCCOL system’s functional annotations. The top 10 functional networks that have the largest percentages of those selected ROIs are listed in Table 1. It turns out that the selected functional networks are quite reasonable and meaningful given current neuroscience knowledge. For instance, the attention, speech, semantics, emotion, execution, and working memory systems are among the most relevant brain networks in video comprehension. This result suggests that video comprehension involves the functional interaction of large-scale brain networks, as demonstrated by the widespread brain ROIs in Fig. 4, and that our feature selection can pick up the relevant brain networks, as listed in Table 1. Therefore, our experimental and computational framework can extract meaningful and descriptive BIS features from the fMRI data in order to characterize and describe the brain’s responses to video shots.
Table 1.
Top 10 brain networks involved in video comprehension and discrimination.
| # | Brain networks | Percentage |
|---|---|---|
| 1 | Attention | 9.15% |
| 2 | Execution.speech | 7.19% |
| 3 | Language.semantics | 7.19% |
| 4 | Emotion | 6.54% |
| 5 | Language.speech | 6.54% |
| 6 | Memory.explicit | 6.54% |
| 7 | Execution | 4.58% |
| 8 | UGA.emotion | 3.92% |
| 9 | Cognition | 3.27% |
| 10 | Memory.working | 3.27% |
This paper proposes to use our DICCCOL system to systematically localize functional brain networks, based on which the brain responses during free viewing of video stream are quantified. Then, feature selection is used to identify distinct brain responses during the comprehension of video stream in different categories. Traditionally, task-based fMRI is a standard method to localize functionally-specialized ROIs, which was also used in our previous work [21, 54]. Comparing with task-based fMRI, the proposed method can provide large-scale, comprehensive, accurate, and reliable brain ROIs and thus offer effective measurement of brain responses involved in video comprehension. To demonstrate this point, we followed the experiment designs in [21, 54] and constructed three two-class classification experiments including Sports VS Weather Report (S-W), Sports VS Commercial (S-C), and Weather Report VS Commercial (W-C) to compare the performance by using 30 ROIs [21, 54] with that by using 358 ROIs. The experiments were performed on 51 training videos. First, the most relevant elements in the connectivity matrices were selected by a two-tailed t-test [21]. Then, we used the KNN classifier and the leave-one-out strategy to perform the classification. The results are summarized in Fig. 5. As can be seen, substantially higher classification accuracies were achieved by using 358 ROIs, which demonstrates the proposed method of brain ROIs localization is superior.
4.2 Evaluation of BIS feature
We designed and conducted three experiments of video classification to evaluate the performance of the proposed BIS features. It is worth noting that we used K-nearest neighbor (K-NN) classifiers in our test because it is a naïve classifier, which has no inherent feature selection mechanism inside unlike other advanced classifiers such as SVM. The classification performance by using simple classifiers is more likely to reflect the effectiveness of the proposed video representation in BIS.
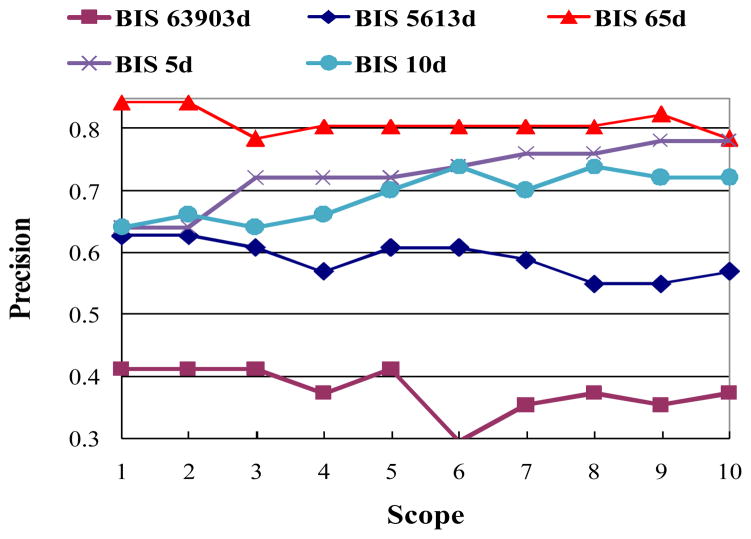
The first experiment was to test the supervised two-stage approach of feature selection used in this work. We adopted those 51 video shots which have BIS features and used the leave-one-out cross-validation to accomplish the classification. Fig. 6 shows the classification comparison results based on the original BIS features, selected features after the first stage (ANOVA), and selected features after the second stage (CFS), respectively. It can be clearly seen that our feature selection procedure is effective and achieves much better results. The classification accuracy by using 63,903 dimensional BIS features can be improved by more than 40% by using selected 65 dimensional features. It is worth noting that our experimental results do not imply that the classification accuracy will become higher as we use smaller number of features. We also show the classification accuracy using 5 and 10 dimensional features to demonstrate this point in Fig. 6.
Fig. 6.
Evaluations of the proposed feature selection for BIS features using K-NN classifier. (the numbers following “BIS” indicate the numbers of feature dimensions)
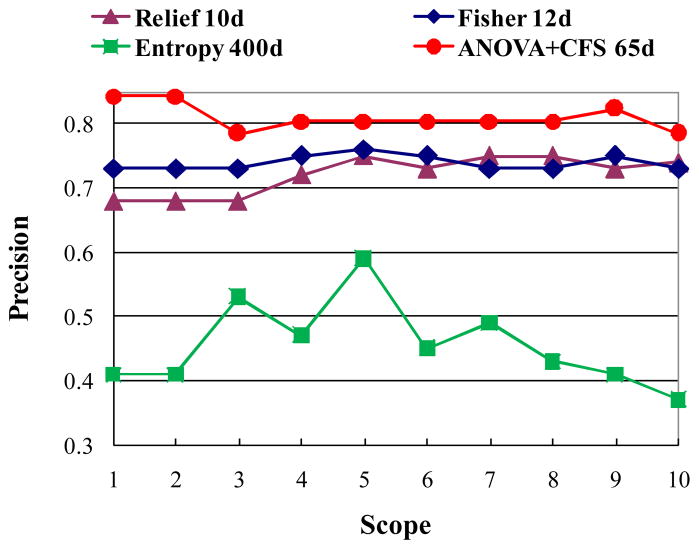
In this work, a two-stage of approach consisting of ANOVA and CFS (AC) were utilized to select features to form the BIS. To further evaluate the effectiveness of AC, we designed two experiments to compare it with other classical feature selection algorithms such as Gentle Adaboost (GA) [46], Fisher Score (FS) [7, 43], Relief (RE) [9, 43], and Fuzzy Entropy (FE) [44]. The GA was selected here since it is simple to implement, robust, and has been shown to outperform other boosting variants experimentally. The first experiment used those 51 video shots and the leave-one-out cross-validation to accomplish the classification task in the BIS. For FS, RE, and FE, we utilized K-NN as classifier. For GA, we utilized its original strong classifier consisting of a number of selected weak classifiers as the classifier, where each weak classifier corresponds to a selected feature. The classification accuracies using GA by varying the number of weak classifiers (the number of selected features), T, are listed as follows: 78.43% (T=5), 78.43% (T=10), 80.39% (T=15), 76.47% (T=20). The average accuracy is 78.43%. Fig. 7 shows comparison results of AC, FS, FE, and RE. As can be seen, FE did not obtain good performance. AC improves FS and RE by about 5%. AC is slightly better than GA with the improvement of 2.5%. However, the computational complexity of AC is much lower than that of GA according to our experiments. By using Matlab code, the running time of GA (T=15) is 3 hours on a Duo Core 2.93 GHZ machine with 2GB RAM, whereas the running time of AC is 15 minutes. Moreover, we list the time costs of AC in different settings by varying p-value in Table 2. As can be seen, the time cost of ANOVA is relatively small and constant across various settings whereas the time cost of CFS is considerably affected by the number of input features.
Fig. 7.
Comparisons of classification using various feature selection algorithms in the BIS.
Table 2.
Time costs of AC in different settings. (FD indicates the feature dimensionality)
| p(×10−3 | FD after ANOVA | Time cost of ANOVA (min) | FD after CFS | Time cost of CFS (min) |
|---|---|---|---|---|
| 4.1 | 4792 | 0.5103 | 62 | 8.4138 |
| 4.2 | 4889 | 0.5142 | 62 | 8.6974 |
| 4.3 | 4990 | 0.5090 | 62 | 9.0913 |
| 4.4 | 5079 | 0.5168 | 65 | 9.9737 |
| 4.5 | 5146 | 0.5087 | 62 | 9.8319 |
| 4.6 | 5234 | 0.5123 | 66 | 11.0924 |
| 4.7 | 5336 | 0.5090 | 65 | 11.5336 |
| 4.8 | 5440 | 0.5140 | 65 | 11.7384 |
| 4.9 | 5527 | 0.5088 | 65 | 12.9674 |
| 5 | 5613 | 0.5130 | 65 | 15.0000 |
In the second experiment, we used SVM classifier to measure the classification performance using various feature selection approaches. The classification accuracies of AC, FS, FE, and RE are 82.35%, 76.47%, 76.47%, and 41.18%, respectively. The results of these two experiments were basically similar and can demonstrate that AC used in this work is effective and efficient for selecting informative features from fMRI data.
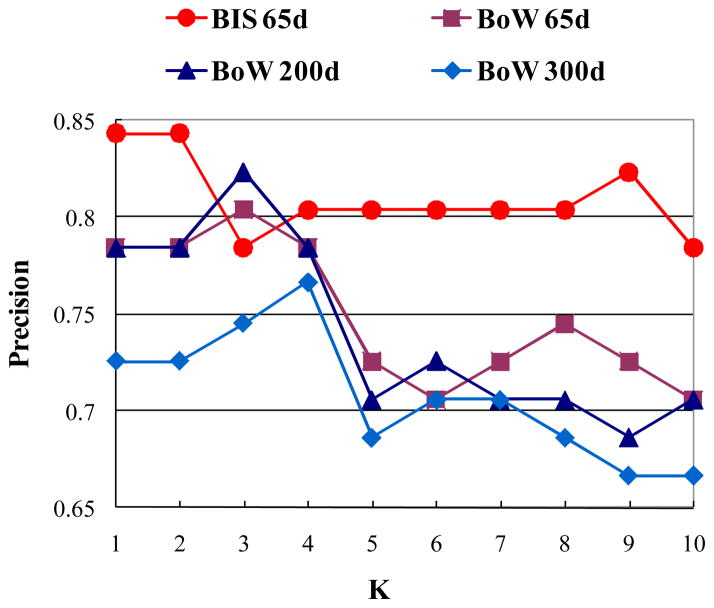
The third experiment was constructed to compare the classification performance of BIS features and state-of-the-art low-level visual features. We also used those 51 video shots with fMRI data. Fig. 8 displays the comparison results. As can be seen, the classification performance in the BIS is better than that using BoW. Averagely, the improvement is 7.7%.
Fig. 8.
Comparisons of classification in BIS and in low-level feature space. (Numbers following “BoW” indicate the numbers of feature dimensions)
4.3 Evaluation of model consistency across subjects
We performed two experiments to assess if the obtained result is consistent across various subjects. In these experiments, fMRI scanning data of three subjects when watching those 51 video shots were used. As described in subsection 4.1, 65 pair-wise functional connectivities involved in video comprehension were identified via DICCCOL and feature selection. The first experiment was to evaluate the consistency of identified ROIs and connectivity across subjects. For each of 51 video shots, we collected 65 pair-wise connectivities for each subject. We then calculated the variance of each element across three subjects. Totally, 65×51 variances were obtained and the distribution is illustrated in Fig. 9. The statistical result reflects that those identified ROIs and connectivities by using the proposed scheme have consistent responses to video stimulus across various subjects.
Fig. 9.
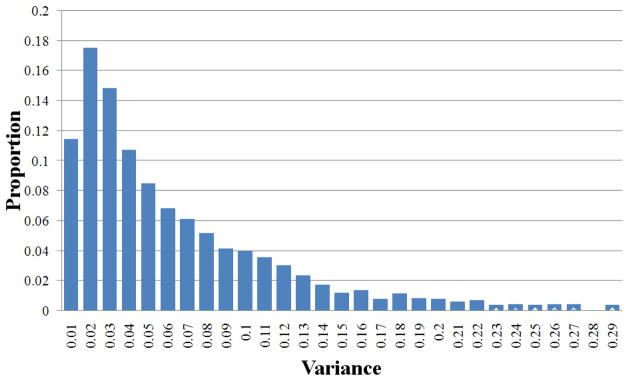
The statistical consistency of identified functional connectivities across subjects.
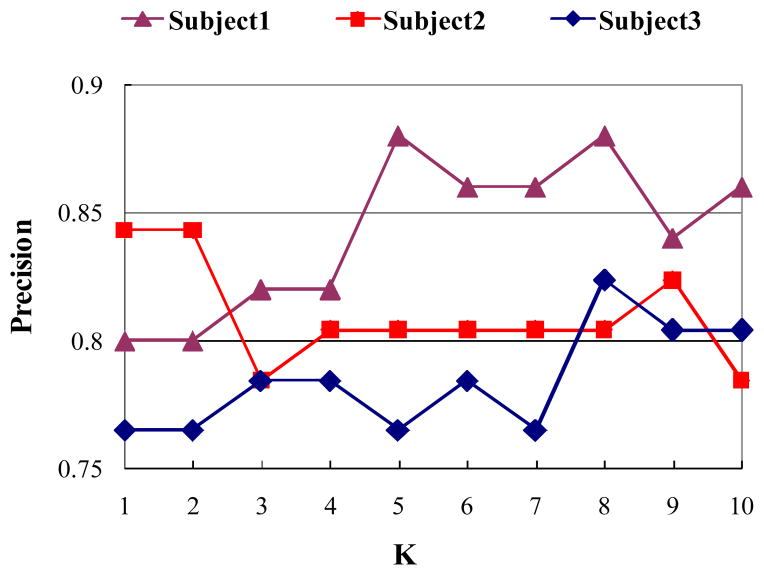
The second experiment was designed to test the consistency of performance of feature selection and classification across various subjects. We applied the leave-one-out cross-validation and K-NN classifier to compute the classification performance. For each subject, we repeated the feature selection to obtain BIS features and classification using these BIS features. Fig. 10 shows the classification results for three subjects. As can be seen, the classification performance associated with each subject is generally pretty good and performance variance across subjects is minor, which demonstrate the feature selection and classification proposed in this paper are relatively robust to different subjects.
Fig. 10.
Classification in the BIS using the proposed approach across various subjects.
4.4 Evaluation of GPR
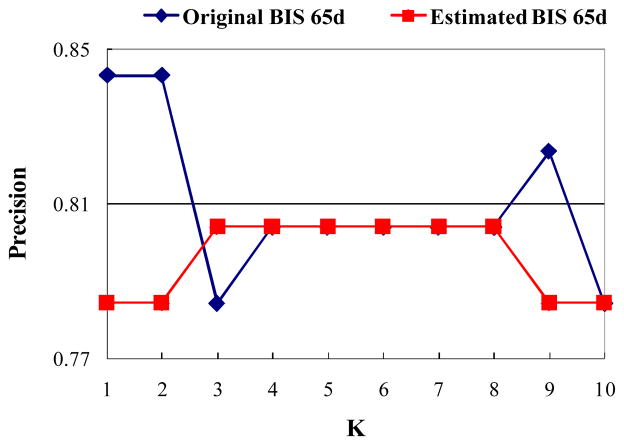
Two experiments were designed and performed to evaluate the GPR algorithm. In the first experiment, we compared the classification capability by using estimated BIS features and by using original BIS features. In our test data, 51 video shots have fMRI data and thus BIS features. We call these BIS features “original BIS features”. We trained a mapping from the BoW features to the BIS features by using the GPR algorithm described in subsection 2.4 upon these 51 video shots. These BIS features are called “estimated BIS features”. Subsequently, we applied the original BIS features and the estimated BIS features to classify video shots by using the K-NN algorithm, respectively. The classification comparison is shown in Fig. 11. As can be seen from the results, the classification precisions by using the original BIS features and the estimated BIS features are quite close. Their precision difference is only about 0.0176. This result suggests that the GPR algorithm can effective map the two features spaces of BoW and BIS features, and exhibits remarkable predictability power. In this sense, the GPR serves as a bridge that links the two feature spaces (BoW and BIS), enabling us to apply the learned model on video shots without fMRI scans. This capability is critically important to apply the proposed work of representing and retrieving video shots in BIS in large-scale real-world video shot databases.
Fig. 11.
Classification comparison by using the original BIS features and the estimated BIS features.
The second experiment aims to measure the average classification precision using the estimated BIS features. We suppose lable i be the classified label for the ith video shot by using K-NN and the original BIS features, and be the classified label for the ith video shot by using K-NN and the “estimated” BIS features. The classification using the “estimated” BIS features is correct if . The average classification precision is then defined as the correction rate for all the data. We also used the K-NN classifier. The overall average classification by varying K from 1 to 10 is about 0.89. The above two aspects of quantitative experimental results together demonstrate that the estimation capability of GPR algorithm is superior, which can effectively bridge the two feature spaces of BoW and BIS and enables us to perform large-scale video shot retrieval in the BIS space.
4.5 Evaluation of video retrieval
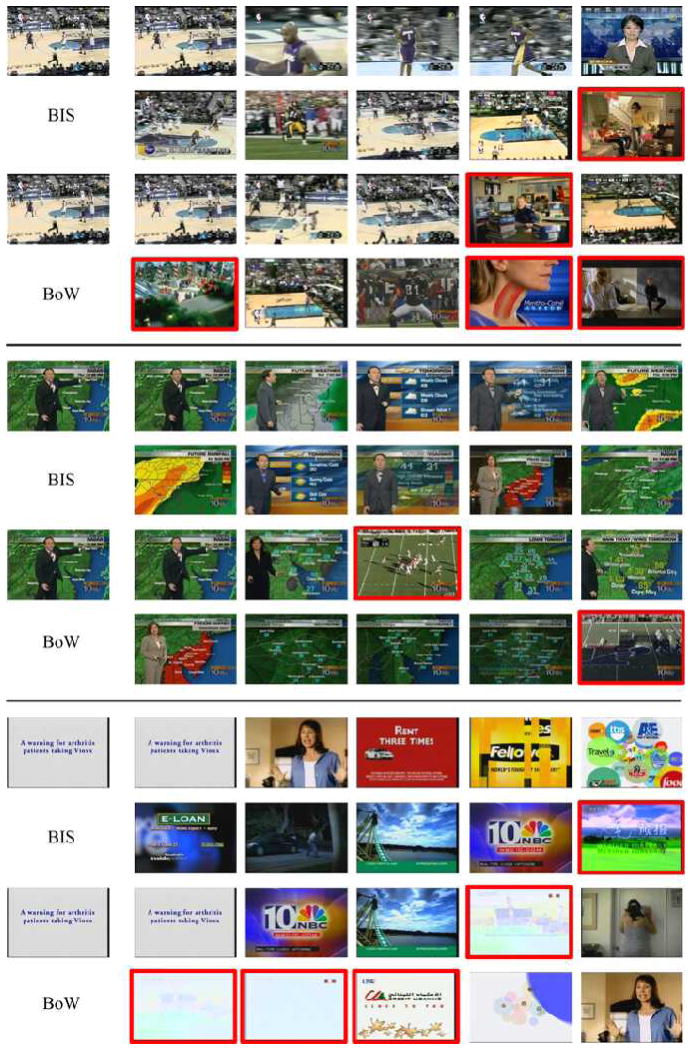
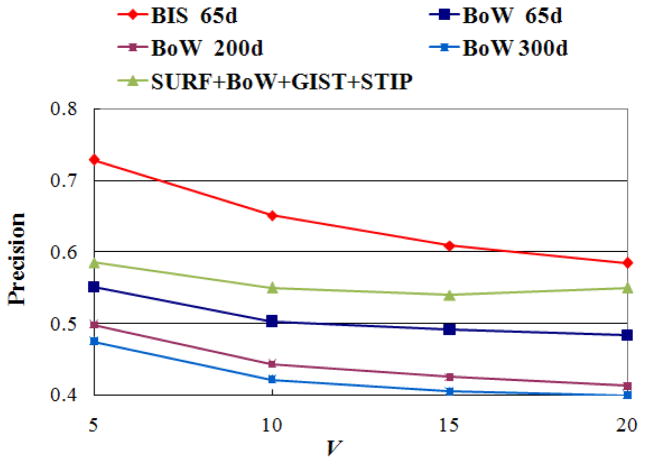
Similar to most retrieval systems [23, 24], our retrieval is also based on the query-by-example paradigm. Given a query video represented by key frames, the similarity between every video in the database and the query is measured. Then, all videos in the database are sorted in descending order of similarity. Finally, a number of video results that are most similar to the query are returned. Our evaluation is to compare those returned results with the ground truth data and quantitatively compute the retrieval accuracy. Specifically, this paper constructed the video retrieval experiment on our testing dataset that consists of 1256 video shots from TRECVID 2005. The GPR model was learned by using training video set as described in subsection 2.4. It was applied to build the mapping from low-level visual space to BIS for each testing video data. The manifold structure was generated in BIS for 1256 videos as described in subsection 3.1. Afterwards, given a video query, the similarity between every video in the database and the query was measured upon the BIS manifold using the manifold ranking algorithm as described in subsection 3.2. Following [23, 24], the retrieval accuracy was calculated as . In our experiment, we adopted every one of 1256 videos in our database as the query to perform the retrieval, which results in 1256 retrieval sessions totally. The average retrieval accuracy of those 1256 retrieval sessions was used to measure the retrieval performance of the proposed method. For comparison, we also created the manifold structure and retrieved video shots in the low-level visual space using BoW features. Fig. 12 shows three sets of retrieval examples by using the proposed BIS features and low-level BoW features, respectively. In these retrieval examples, 10 results that are most similar to the query from the database were returned. It can be easily seen that the retrieved results in BIS are more similar to the corresponding query than those in the visual low-level feature space. Additionally, it is worth noting that some correct results retrieved in BIS are visually different from the query (especially in the third example). This observation can highlight the difference between the proposed work and traditional work and demonstrate that understanding videos in BIS can capture the semantics of brain cognition. Quantitatively, Fig. 13 presents the performance by comparing the proposed retrieval in BIS with the retrieval in low-level visual space described by BoW features. Here, the dimensionality of BIS features is 65 and the dimensionalities of BoW features are 65, 200, 300, respectively. As can be seen, our method can improve the accuracy of the traditional method by about 20%, which is considered substantial.
Fig. 12.
Three examples of retrieving video shots using BIS features and BoW features, respectively. In each example, the top-left image shows the key frame of the query video. The retrieved results by using BIS features are shown in the top two rows and the retrieved results by using BoW features are shown in the bottom two rows. The images labeled by the red boxes are irrelevant retrieved examples.
Fig. 13.
Performance comparisons of video retrieval in the BIS and in low-level visual space.
In the above experiment, we built the BIS via mapping from BoW feature, and demonstrated that using BIS feature significantly improved the retrieval performance of using BoW feature. To further test the effectiveness of the derived BIS features, we constructed another experiment which compared the proposed approach using BIS features with the state-of-the-art method presented in TRECVID 2011. Currently, the popular solution for video retrieval/indexing in TRECVID 2011 is to combine global, local, and motion features to yield a more powerful visual representation for video shots, and then calculate the similarity between videos using the combined video representation. As reported in [40, 41], the combination of different features generally can obtain better performance. Therefore, it is reasonable to regard the method based on the combined features as the state-of-the-art approach. Based on reports of TRECVID 2011 [39–41], we selected a number of features that were mostly used and also achieved better retrieval performance experimentally to form the video representation. To be specific, SURF [3, 41] was selected as the global feature. SIFT based BoW [4, 39–41] and GIST [39, 41] were selected as the local feature. STIP [39, 41, 42] was selected as the motion feature. The dimensionalities of SURF, BoW, GIST, and STIP features in our experiments are 9, 65, 512, and 65, respectively. We compared two retrieval systems by using the proposed BIS features and the combined low-level features (SURF+BoW+GIST+STIP), respectively, and both using manifold ranking algorithm as the similarity measure. For each of those two retrieval systems, 1256 retrieval sessions that used each video in the database as the query were performed and the average retrieval accuracy was calculated. Fig. 13 shows the quantitative comparison results on the test dataset. It is easy to see that state-of-the-art approach by using combined features achieved better accuracy than that using BoW features (the best one) only with the improvement of 5%. However, on average, it is still worse than the proposed approach using BIS features by 8.3%. Especially, the proposed approach has much higher performance than the approach using combined features when the number of returned results is small (V=5 and 10). The average improvement is around 12.3%. Therefore, the experimental results demonstrate that our proposed video retrieval framework is effective.
In all experiments, a unified set of parameters was used. In ANOVA, the threshold γ was set to 0.005. In the calculation of the affinity matrix M, σ was set to 3. In the manifold ranking algorithm, α was set to 0.99 and β = 1−α. The proposed retrieval framework was implemented by Matlab. The computational speeds of off-line feature selection took a few tens of minutes, the GPR training took less than one minute, and the manifold construction took a few seconds. The online manifold-ranking retrieval took a few seconds.
5. Conclusions
In this paper, we have explored and evaluated a novel and generalized framework to represent and retrieve video shots in BIS where human brain cognition of video semantics can be captured and represented. Our major contributions can be summarized as follows. 1) The proposed work established the link between two research areas of brain science and video computing via fMRI technology. It developed an innovative brain-computer interface to investigate and leverage the high-level brain imaging space associated with brain behaviors in video perception and cognition, which can significantly boost video understanding and computing. 2) We firstly employed the DICCCOOL system to generate an over-complete set of functional brain ROIs. A data-driven strategy of feature selection was then developed to select the most relevant features, which simultaneously plays an important role in identifying the appropriate ROIs regarded as being involved in video cognition from the over-complete set. In contrast, the traditional method relies on task-based fMRI and is incapable of describing and representing the complicated video content comprehension. The proposed data-driven strategy is more systematic and comprehensive. 3) A computational model using GPR was used to build the mapping from the low-level visual space to the high-level BIS where the maximal correlations between low-level features and human-centric BIS features can be achieved. The computational model can alleviate the burden of lacking fMRI scanning data in the application stage. 4) The manifold-ranking algorithm was applied to retrieve video shots represented by BIS features. Evaluations on a publicly available benchmark video database have demonstrated the effectiveness of the proposed work.
In future work, we will improve the proposed work in three aspects. First, more types of BIS features reflecting the brain’s comprehension of video stimuli, e.g., functional interactions among cortical and subcortical regions, will be derived. Second, more categories of videos will be used to perform large-scale natural stimulus fMRI scanning and construct a broader BIS feature space. Finally, other alternative computational learning techniques will be investigated and compared. We envision that the combination of functional brain imaging and multimedia research will offer novel perspectives on both fields and advance our understanding of their interactions.
Acknowledgments
T. Liu was supported by the NIH Career Award EB 006878, NIH R01 HL087923-03S2, NIH R01 DA033393, NSF CAREER Award IIS-1149260, and The University of Georgia start-up research funding. J. Han and X. Hu were supported by the National Science Foundation of China under Grant 61005018, 91120005, and 61103061, NPU-FFR-JC20120237, Program for New Century Excellent Talents in University under grant NCET-10-0079, and the Postdoctoral Foundation of China under Grant 20110490174.
References
- 1.Dimitrova N, Zhang H, Shahraray B, et al. Applications of Video-Content Analysis and Retrieval. IEEE Multimedia. 2002:42–55. [Google Scholar]
- 2.Lowe D. Distinctive Image Features from Scale-Invariant Keypoints. International Journal of Computer Vision. 2004;60(2):91–110. [Google Scholar]
- 3.Bay H, Tuytelaars T, Gool LV. SURF: Speeded Up Robust Features. European Conference on Computer Vision; 2006. [Google Scholar]
- 4.Li F, Perona P. A Bayesian Hierarchical Model for Learning Natural Scene Categories. IEEE Conference on Computer Vision and Pattern Recognition; 2005. [Google Scholar]
- 5.Serre T, Wolf L, Bileschi S, Riesenhuber M, Poggio T. Object recognition with cortex-like mechanisms. IEEE Trans Pattern Anal Mach Intell. 2007 Mar;29(3):411–426. doi: 10.1109/TPAMI.2007.56. [DOI] [PubMed] [Google Scholar]
- 6.Song D, Tao D. Biologically Inspired Feature Manifold for Scene Classification. IEEE Trans on Image Processing. 2010;19(1):174–184. doi: 10.1109/TIP.2009.2032939. [DOI] [PubMed] [Google Scholar]
- 7.Duda R, Hart P, Stork D. Pattern Classication. 2. John Wiley & Sons; New York: 2001. [Google Scholar]
- 8.Rui Y, Huang TS, Ortega M, et al. Relevance feedback: A power tool for interactive content-based image retrieval. IEEE Transactions on Circuits and Systems for Video Technology. 1998;8(5):644–655. [Google Scholar]
- 9.Kononenko I. Estimating attributes: Analysis and extension of RELIEF. European Conference on Machine Learning; Italy. 1994. [Google Scholar]
- 10.Hu W, Xie N, Li L, Zeng X, Maybank S. A Survey on Visual Content-Based Video Indexing and Retrieval. IEEE Trans on Systems, Man, and Cybernetics C. 2011 Nov;41(6):797–819. [Google Scholar]
- 11.Wang J, Pohlmeyer E, Hanna B, Jiang Y, Sajda P, Chang S. Brain State Decoding for Rapid Image Retrieval. ACM international conference on Multimedia; October 2009. [Google Scholar]
- 12.Sajda P, Pohlmeyer E, Wang J, et al. In a Blink of an Eye and a Switch of a transistor: Cortically Coupled Computer Vision. Proceedings of the IEEE. 2010;98(3):462–478. [Google Scholar]
- 13.Kapoor A, Shenoy P, Tan D. Combining brain computer interfaces with vision for object categorization. IEEE Conference on Computer Vision and Pattern Recognition; 2008. [Google Scholar]
- 14.Hasson U, Nir Y, Levy I, Fuhrmann G, Malach R. Intersubject synchronization of cortical activity during natural vision. Science. 2004;303:1634–1640. doi: 10.1126/science.1089506. [DOI] [PubMed] [Google Scholar]
- 15.Laird A, Eickhoff S, Kurth F, Fox P, et al. ALE meta-analysis workflows via the BrainMap database: Progress towards a probabilistic functional brain atlas. Neuroinformatics. 2009;3(23):11. doi: 10.3389/neuro.11.023.2009. [DOI] [PMC free article] [PubMed] [Google Scholar]
- 16.Walther D, Caddigan E, Li F, Beck D. Natural scene categories revealed in distributed patterns of activity in the human brain. Journal of Neuroscience. 2009;29(34):10573–10581. doi: 10.1523/JNEUROSCI.0559-09.2009. [DOI] [PMC free article] [PubMed] [Google Scholar]
- 17.Kay K, Naselaris T, Prenger R, Gallant J. Identifying natural images from human brain activity. Nature. 2008 Mar 20;452 doi: 10.1038/nature06713. [DOI] [PMC free article] [PubMed] [Google Scholar]
- 18.Schneider W, Eschman A, Zuccolotto A. E-Prime Reference Guide. Pittsburgh: Psychology Software Tools, Inc; 2002. [Google Scholar]
- 19.Hu X, Deng F, Li K, et al. Bridging Low-level Features and High-level Semantics via fMRI Brain Imaging for Video Classification. ACM Conference on Multimedia; 2010. [Google Scholar]
- 20.Li K, Zhang T, Hu X, et al. Human-Friendly Attention Models for Video Summarization. ACM Conference on Multimodal Interfaces; 2010. [Google Scholar]
- 21.Ji X, Han J, Hu X, Li K, Deng F, Fang J, Guo L, Liu T. Retrieving Video Shots in Semantic Brain Imaging Space Using Manifold-Ranking. IEEE Conference on Image Processing; 2011. [Google Scholar]
- 22.Zhu D, Li K, Guo L, et al. DICCCOL: Dense Individualized and Common Connectivity-based Cortical Landmarks. Cerebral Cortex. 2012 doi: 10.1093/cercor/bhs072. [DOI] [PMC free article] [PubMed] [Google Scholar]
- 23.He J, Li M, Zhang H, Tong H, Zhang C. Generalized Manifold-Ranking-Based Image Retrieval. IEEE Transactions on Image Processing. 2006:3170–3177. doi: 10.1109/tip.2006.877491. [DOI] [PubMed] [Google Scholar]
- 24.He X, Ma W, Zhang HJ, et al. Learning an Image Manifold for Retrieval. ACM Conference on Multimedia; 2004. [Google Scholar]
- 25.Zhou D, et al. NIPS. 2003. Ranking on data manifolds. [Google Scholar]
- 26.Horwitz B. The Elusive Concept of Brain Connectivity. Neuroimage. 2003:466–470. doi: 10.1016/s1053-8119(03)00112-5. [DOI] [PubMed] [Google Scholar]
- 27.Abramowitz M, Stegun I. Handbook of Mathematical Functions. Government Printing Office; 1964. [Google Scholar]
- 28.Hall M, Smith L. Feature Selection for Machine Learning: Comparing a Correlation-Based Filter Approach to the Wrapper. FLAIRS Conference; 1999. pp. 235–239. [Google Scholar]
- 29.Peng Y, Ngo C, Xiao J. OM-based video shot retrieval by one-to-one matching. Multimedia Tools and Applications. 2007;34:249–266. [Google Scholar]
- 30.Rasmussen CE, Williams CKI. Gaussian Processes for Machine Learning. MIT Press; 2006. [Google Scholar]
- 31.Bo L, Sminchisescu C. Twin Gaussian Processes for Structured Prediction. International Journal of Computer Vision. 2010;87:28–52. [Google Scholar]
- 32.Zhou D, et al. NIPS. 2003. Learning with local and global consistency. [Google Scholar]
- 33.http://www-nlpir.nist.gov/projects/tv2005/.
- 34.www-nlpir.nist.gov/projects/tv2005/LSCOMlite_NKKCSOH.pdf.
- 35.Zhang T, Guo L, Li K, Jing C, Yin Y, Zhu D, Cui G, Li L, Liu T. Predicting functional cortical ROIs via DTI-derived fiber shape models. Cerebral Cortex. 2011 doi: 10.1093/cercor/bhr152. [DOI] [PMC free article] [PubMed] [Google Scholar]
- 36.Friston K. Modalities, modes, and models in functional neuroimaging. Science. 2009;326(5951):399–403. doi: 10.1126/science.1174521. [DOI] [PubMed] [Google Scholar]
- 37.Lynall M, Bassett D, Kerwin R, McKenna P, Kitzbichler M, Muller U, Bullmore E. Functional connectivity and brain networks in schizophrenia. Journal of Neuroscience. 2010;30(28):9477–87. doi: 10.1523/JNEUROSCI.0333-10.2010. [DOI] [PMC free article] [PubMed] [Google Scholar]
- 38.Hagmann P, Cammoun L, Gigandet X, et al. MR connectomics: principles and challenges. Journal of Neuroscience Methods. 2010;194(1):34–45. doi: 10.1016/j.jneumeth.2010.01.014. [DOI] [PubMed] [Google Scholar]
- 39.Cao L, Chang S, Smith J, et al. IBM Research and Columbia University TRECVID-2011 Multimedia Event Detection (MED) System. NIST TRECVID Workshop; 2011. [Google Scholar]
- 40.Cheng H, Tamrakar A, Allan J, et al. Team SRI-Sarnoff’s AURORA System @ TRECVID 2011. NIST TRECVID Workshop; 2011. [Google Scholar]
- 41.Scott D, Guo J, Smeaton A. TRECVid 2011 Experiments at Dublin City University. NIST TRECVID Workshop; 2011. [Google Scholar]
- 42.Laptev I. On space-time interest points. International Journal of Computer Vision. 2005;64(2–3):107–123. [Google Scholar]
- 43.Zhao Z, Liu H, et al. Technical Report. Arizona State University; 2010. Advancing Feature Selection Research-ASU Feature Selection Repository. [Google Scholar]
- 44.Luukka P. Feature Selection Using Fuzzy Entropy Measures with Similarity Classifier. Expert Systems with Applications. 2011;38 [Google Scholar]
- 45.Baddeley A. Working memory: looking back and looking forward. Nature Reviews Neuroscience. 2003;4(10):829–39. doi: 10.1038/nrn1201. [DOI] [PubMed] [Google Scholar]
- 46.Friedman J, Hastie T, Tibshirani R. Additive logistic regression: a statistical view of boosting. Annals of Statistics. 2000;28(2):337–374. [Google Scholar]
- 47.Singer1 J, Kreiman G. Toward Unmasking the Dynamics of Visual Perception. Neuron. 2009;446 doi: 10.1016/j.neuron.2009.11.008. [DOI] [PMC free article] [PubMed] [Google Scholar]
- 48.Beauchamp M, Lee K, Argall B, Martin A. Integration of Auditory and Visual Information about Objects in Superior Temporal Sulcus. Neuron. 2004 Mar;41:809–823. doi: 10.1016/s0896-6273(04)00070-4. [DOI] [PubMed] [Google Scholar]
- 49.Sabatinelli D, Lang PJ, Bradley MM, Costa VD, Keil A. The timing of emotional discrimination in human amygdala and ventral visual cortex. Journal of Neuroscience. 2009 Nov;29(47):14864–14868. doi: 10.1523/JNEUROSCI.3278-09.2009. [DOI] [PMC free article] [PubMed] [Google Scholar]
- 50.Rinnea J, Laineb M, Hiltunenc J, Erkinjuntti T. Semantic decision making in early probable AD: a PET activation study. Cognitive Brain Research. 2003;18:89–96. doi: 10.1016/j.cogbrainres.2003.09.009. [DOI] [PubMed] [Google Scholar]
- 51.Passingham R, Stephan K, Kötter R. The anatomical basis of functional localization in the cortex. Nat Rev Neurosci. 2002;3(8):606–16. doi: 10.1038/nrn893. [DOI] [PubMed] [Google Scholar]
- 52.Meier J, Aflalo T, Kastner S, Graziano M. Complex Organization of Human Primary Motor Cortex: A High-Resolution fMRI Study. J Neurophysiol. 2008;100:1800–1812. doi: 10.1152/jn.90531.2008. [DOI] [PMC free article] [PubMed] [Google Scholar]
- 53.Ethridge L, Brahmbhatt S, Gao Y, McDowell JE, Clementz B. Consider the context: blocked versus interleaved presentation of antisaccade trials. Psychophysiology. 2009 doi: 10.1111/j.1469-8986.2009.00834.x. [DOI] [PMC free article] [PubMed] [Google Scholar]
- 54.Hu X, Li K, Han J, Hua X, Guo L, Liu T. Bridging Semantic Gaps via Functional Brain Imaging. IEEE Transactions on Multimedia. 2012 [Google Scholar]
- 55.Gao X, Li X, Feng J, Tao D. Shot-based video retrieval with optical flow tensor and HMMs. Pattern Recognition Letters. 2009;30:140–147. [Google Scholar]
- 56.Zhu D, Li K, Faraco C, Deng F, Liu T, et al. Optimization of Functional Brain ROIs via Maximization of Consistency of Structural Connectivity Profiles. NeuroImage. 2012;59(2):1382–93. doi: 10.1016/j.neuroimage.2011.08.037. [DOI] [PMC free article] [PubMed] [Google Scholar]
- 57.Lomax R, Hahs-Vaughn D. Statistical Concepts: A Second Course. 3. Routledge Academic; 2007. [Google Scholar]
- 58.Schervish MJ. P Values: What They Are and What They Are Not. The American Statistician. 1996;50(3):203–206. [Google Scholar]
- 59.Petersohn C. Fraunhofer HHI at TRECVID 2004: Shot Boundary Detection System. TREC Proceeding; 2004. [Google Scholar]


