

Abstract
Depressive symptoms, even at a subclinical level, have been associated with structural brain abnormalities. However, previous studies have used regions of interest or small sample sizes, limiting the ability to generalize the results. In this study, we examined neuroanatomical structures of both gray matter and white matter associated with depressive symptoms across the whole brain in a large sample. A total of 810 community-dwelling adult participants underwent measurement of depressive symptoms with the Center for Epidemiologic Studies Depression Scale (CES-D). The participants were not demented and had no neurological or psychiatric history. To examine the gray and white matter volume, we used structural MRI scans and voxel-based morphometry (VBM); to examine the white matter integrity, we used diffusion tensor imaging with tract-based spatial statistics (TBSS). In female participants, VBM revealed a negative correlation between bilateral anterior cingulate gray matter volume and the CES-D score. TBSS showed a CES-D-related decrease in fractional anisotropy and increase in radial and mean diffusivity in several white matter regions, including the right anterior cingulum. In male participants, there was no significant correlation between gray or white matter volume or white matter integrity and the CES-D score. Our results indicate that the reduction in gray matter volume and differences in white matter integrity in specific brain regions, including the anterior cingulate, are associated with depressive symptoms in women.
Keywords: Anterior cingulate gyrus, Voxel-based morphometry, Diffusion tensor imaging, Tract-based spatial statistics, Subclinical depression
Abbreviations: CES-D, Center for Epidemiologic Studies Depression Scale; DTI, diffusion tensor imaging; FA, fractional anisotropy; MD, mean diffusivity; RD, radial diffusivity; TBSS, tract-based spatial statistics; VBM, voxel-based morphometry
Highlights
-
•
We studied neuroanatomical structures associated with subclinical depression.
-
•
The analysis was performed across the whole brain in a large sample.
-
•
Anterior cingulate gray matter volume reduction was revealed by VBM.
-
•
Broad white matter integrity differences were revealed by DTI with TBSS.
-
•
Both changes were seen only in females but not in males.
1. Introduction
Major depressive disorder is associated with decreased brain volume or changes in white matter integrity, particularly in frontal areas (Abe et al., 2010; Bremner et al., 2002; Egger et al., 2008; Kieseppä et al., 2010; Shimony et al., 2009) and in medial temporal areas such as the hippocampus (Abe et al., 2010; Campbell et al., 2004; Videbech and Ravnkilde, 2004). Recently, depressive symptoms that do not meet the criteria for major depression have received increased attention. Understanding this preclinical state precisely is important for preventing major depressive disorder (Cuijpers et al., 2004). Several previous reports have suggested that depressive symptoms at a subclinical level have some of the same neural correlates as those in major depression (Hayakawa et al., 2013; Lavretsky and Kumar, 2002; Lyness et al., 1999). However, most previous studies on this issue have been based on regions of interest or small sample sizes, limiting the ability to draw firm conclusions from them.
The purpose of this study was to investigate brain structures associated with depressive symptoms in gray and white matter across the whole brain in a large sample. We used voxel-based morphometry (VBM) and diffusion tensor imaging (DTI) with tract-based spatial statistics (TBSS). Both VBM and TBSS enable the global analysis of brain volume or white matter integrity without a priori identification of a region of interest. White matter integrity was represented by four DTI measures: fractional anisotropy (FA), mean diffusivity (MD), axial diffusivity (AD), and radial diffusivity (RD). The diffusivity of water molecules in white matter is more limited in the direction of neuronal fibers. Although the histological reasons for this limitation are not well understood, FA is believed to reflect the degree of myelination and axonal density (Arfanakis et al., 2002; Harsan et al., 2006; Song et al. 2002, Song et al. 2003). Recently, more discrete analysis of the AD and RD has provided potential measures of the mechanisms that underlie white matter pathology and disease processes (Song et al., 2002; Wozniak and Lim, 2006). AD reflects diffusivity parallel to axonal fibers. Increases in AD are thought to reflect pathology of the axon itself, such as from trauma or ischemic changes (Song et al., 2003). RD reflects diffusivity perpendicular to axonal fibers and appears to be more strongly correlated with myelin abnormalities—either dysmyelination or demyelination—such as in multiple sclerosis (Song et al., 2005). All analyses were performed not only for all participants combined but also for each sex separately, because there is evidence that the brains of males and females with major depression have structural differences (Lorenzetti et al., 2009), suggesting that the sex difference may be present even at the subclinical level. In support of this hypothesis, in our preliminary study of 21 community-dwelling adults (Hayakawa et al., 2013), we found brain structural differences between subjects with subclinical depression and controls only in females.
2. Materials and methods
2.1. Participants
The participants were 1148 volunteers who underwent private health screening at the University of Tokyo hospital from 2008 to 2009. Depressive symptoms were measured with the Center for Epidemiologic Studies Depression Scale (CES-D; Radloff, 1977) during a visit to screen for depression. The CES-D (range, 0–60) is a widely used 20-item self-report inventory that assesses the frequency and severity of depressive symptoms experienced in the past week. Adequate validity of the CES-D in elderly community-dwelling adults has been demonstrated (Haringsma et al., 2004).
The exclusion criteria were missing data from the CES-D or mini-mental state examination (MMSE); past or current history of neuropsychiatric disorders, including major depression diagnosed with the Diagnostic and Statistical Manual for Mental Disorders IV criteria; central nervous system disease; serious head trauma; or medication with antipsychotic drugs. Two trained neuroradiologists (one with 4 years, and the other with 10 years of experience) reviewed all scans (including T2-weighted, fluid-attenuated inversion recovery images and magnetic resonance angiography) and excluded participants who had gross abnormalities such as infarct, hemorrhage, brain tumor, or aneurysm. Participants with a Fazekas score of 3 (irregular periventricular hyperintensity extending into the deep white matter) were also excluded (Fazekas et al., 1987).
The ethical committee of our institute approved this study. After a complete explanation of the study was provided to each participant, written informed consent was obtained.
2.2. Image acquisition
MRI data were obtained on two 3 T Signa HDx scanners (GE Medical Systems, Milwaukee, WI, USA) of the exact same model with an 8-channel brain phased-array coil. For the VBM analysis, T1-weighted images were acquired by using three-dimensional spoiled-gradient recalled acquisition in the steady state (3D SPGR) in 124 axial slices (repetition time: 6.4 ms; echo time: 2.0 ms; flip angle: 151; field of view: 250 mm; slice thickness: 1 mm with no gap; acquisition matrix: 256 × 256; number of excitations: 0.5). The voxel dimensions were 0.977 × 0.977 × 1.0 mm. For the DTI analysis, diffusion tensor images were acquired by using a single-shot spin-echo echo-planar sequence in 50 axial sections (repetition time: 13,200 ms; echo time: 62 ms; field of view: 288 mm; slice thickness: 3 mm with no gap; acquisition matrix: 96 × 96; number of excitations: 1). Diffusion weighting was applied along 13 noncollinear directions with a b-value of 1000 s/mm2, and a single volume was collected with no diffusion gradients applied (b = 0). The reconstructed voxel dimensions were 1.125 × 1.125 × 3.0 mm. Parallel imaging (array spatial sensitivity encoding technique) was used with an acceleration factor of 2.0.
2.3. Image processing
2.3.1. VBM analysis
All 3D SPGR images were processed and examined using the Statistical Parametric Mapping version 8 software (Wellcome Department of Imaging Neuroscience Group, London, UK; http://www.fil.ion.ucl.ac.uk/spm), where we applied VBM implemented in the VBM8 toolbox (http://dbm.neuro.uni-jena.de/vbm.html) with default parameters in MATLAB 7.7.0.471 (The MathWorks, Natick, MA, U.S.A.) running on a Windows computer. A ‘nonlinear only’ modulation was performed on all images during spatial normalization so that values in resultant images are expressed as volume corrected for brain size. The resultant modulated images were smoothed with a Gaussian kernel of 8 mm (full width at half maximum).
2.3.2. DTI analysis
We performed an unbiased whole-brain TBSS analysis (Smith et al., 2006), which is part of FSL (FMRIB software library) 4.1 (http://www.fmrib.ox.ac.uk/fsl) (Smith et al., 2004). First, the raw diffusion data were corrected for eddy current distortion and head motion by using FDT (FMRIB's Diffusion Toolbox) 2.0 (Smith et al., 2004) and corrected for spatial distortion due to gradient nonlinearity by using grad_unwarp (Jovicich et al., 2006). Following brain extraction by using BET2.1 (Smith, 2002), FA, MD, AD, and RD maps were created by fitting a tensor model to the diffusion data by using FDT. The FA data of all participants were then aligned into Montreal Neurological Institute (MNI) 152 space by using FNIRT 1.0 (Smith et al., 2004), which uses a b-spline representation of the registration warp field. The FMRIB58_FA standard-space image was used as the target. Next, a mean FA image was generated and thinned to create a mean FA skeleton, which represents the centers of all tracts common to the group. The mean FA skeleton image was thresholded at an FA value of 0.2 to prevent inclusion of nonskeleton voxels. The aligned FA data of each participant were then projected onto this skeleton. The MD, AD, and RD data were also aligned into MNI 152 space and projected onto the mean FA skeleton by using the FA data to find the projection vectors.
2.4. Statistical analysis
Relationships between four variables, CES-D, sex, age, and MMSE score, were tested by Pearson product moment correlation for all participants in the VBM analysis group and all participants in the TBSS analysis group.
2.4.1. VBM analysis
We performed voxel-wise correlation analyses by using the multiple regression function of SPM8 for all participants combined and for each sex separately. The CES-D score was treated as a covariate of interest. As nuisance variables, individual values for sex, age, and MMSE score were included for analysis of all participants combined, and age and MMSE for analysis of each sex. Two linear contrasts (1, −1) were made for positive and negative correlations, respectively. The significance level was set at family-wise error (FWE)-corrected P< 0.05.
2.4.2. DTI analysis
Voxel-wise analyses of the skeletonized data were performed by using permutation-based, voxel-wise nonparametric testing as implemented in the randomize tool of FSL (Nichols et al., 2002). We identified areas in which FA, MD, AD, or RD was significantly correlated with the CES-D score. Sex and age were included as covariates for analysis of all participants combined, and age for analysis of each sex. Both positive and negative contrasts were tested with 5000 permutations. We used threshold-free cluster enhancement (Smith et al., 2009) as implemented within randomize, which provides the ability to perform cluster-based inferences without setting an arbitrary cluster-forming threshold. Voxel-wise statistical inference was made on the resulting statistical image, and the significance level was set at P< 0.05, corrected for the FWE rate.
3. Results
3.1. Participants
Of the 1148 volunteers who were screened, 338 met the exclusion criteria. Among the images from the resulting 810 participants, 18 3D SPGR images and 4 diffusion tensor images were excluded because of poor quality or artifacts. Images were therefore analyzed with VBM for 792 participants and with TBSS for 806 participants. There were no sex differences in age or MMSE in either group (Table 1). However, the CES-D score was significantly different between males and females in both analysis groups, and females were more depressed than males.
Table 1.
Participant characteristics.
| All |
Men |
Women |
P | |||||||
|---|---|---|---|---|---|---|---|---|---|---|
| Mean | SD | Range | Mean | SD | Range | Mean | SD | Range | ||
| Participants in the VBM analysis | ||||||||||
| N | 792 | 523 | 269 | |||||||
| Age | 55.3 | 9.8 | 23–84 | 55.3 | 9.7 | 23–84 | 55.2 | 9.9 | 24–81 | n.s. |
| MMSE | 29.1 | 1.1 | 24–30 | 29.1 | 1.1 | 24–30 | 29.2 | 1.0 | 24–30 | n.s. |
| CES-D | 4.2 | 5.1 | 0–48 | 3.8 | 4.7 | 0–48 | 5.1 | 5.7 | 0–44 | <0.01 |
| Participants in the TBSS analysis | ||||||||||
| N | 806 | 535 | 271 | |||||||
| Age | 55.3 | 9.9 | 23–84 | 55.4 | 9.9 | 23–84 | 55.3 | 10.0 | 24–81 | n.s. |
| MMSE | 29.1 | 1.1 | 24–30 | 29.1 | 1.1 | 24–30 | 29.2 | 1.0 | 24–30 | n.s. |
| CES-D | 4.3 | 5.1 | 0–48 | 3.8 | 4.8 | 0–48 | 5.1 | 5.7 | 0–44 | <0.01 |
MMSE: mini-mental state examination; CES-D: Center for Epidemiologic Studies Depression Scale. n.s., not significant; P: two-sample t-test for men vs. women.
3.2. Relationships between CES-D and sex, age, and MMSE score
Table 2 shows Pearson product moment correlations between variables in each analysis group. The CES-D score was negatively correlated with sex and age. The sex is a dummy variable (female = 0, male = 1), so the negative correlation indicates that female participants tend to have higher CES-D scores. We found no correlation between CES-D and MMSE score. We found a negative correlation between the age and MMSE score.
Table 2.
Pearson product moment correlations between variables.
| CES-D | Sex | Age | |
|---|---|---|---|
| In the VBM analysis group (792 participants) | |||
| Sex | −0.123* | ||
| Age | −0.103* | 0.006 | |
| MMSE | −0.009 | −0.051 | −0.279* |
| In the TBSS analysis group (806 participants) | |||
| Sex | −0.117* | ||
| Age | −0.119* | 0.001 | |
| MMSE | −0.013 | −0.052 | −0.279* |
MMSE: mini-mental state examination; CES-D: Center for Epidemiologic Studies Depression Scale.
Sex is a dummy variable (female = 0, male = 1).
P < 0.01.
3.3. VBM analysis of gray and white matter volume associated with CES-D
There was no significant correlation between gray matter volume and CES-D score for all participants combined. In the separate analysis of each sex, significant negative correlations between gray matter volume and the CES-D score were seen in the right rostral anterior cingulate gyrus and bilaterally in the dorsal anterior cingulate gyri in female participants after adjusting for age and MMSE score (Table 3). Fig. 1 shows the extent of gray matter regions that had a volume reduction correlated with the CES-D score in female participants. There was no significant correlation between gray matter volume and the CES-D score in male participants. We observed no significant correlation between white matter volume and the CES-D score.
Table 3.
Areas with significant gray matter volume reduction that correlated with depressive symptoms in female participants.
| Anatomical location | Talairach coordinates |
P | Cluster size | ||
|---|---|---|---|---|---|
| x | y | z | (FWE corrected) | ||
| Right rostral anterior cingulate gyrus | 1 | 31 | 22 | 0.029 | 846 |
| 15 | 32 | 21 | |||
| 10 | 28 | 15 | |||
| Left dorsal anterior cingulate gyrus | −1 | 4 | 34 | 0.037 | 785 |
| Right dorsal anterior cingulate gyrus | 7 | 0 | 34 | ||
Fig. 1.
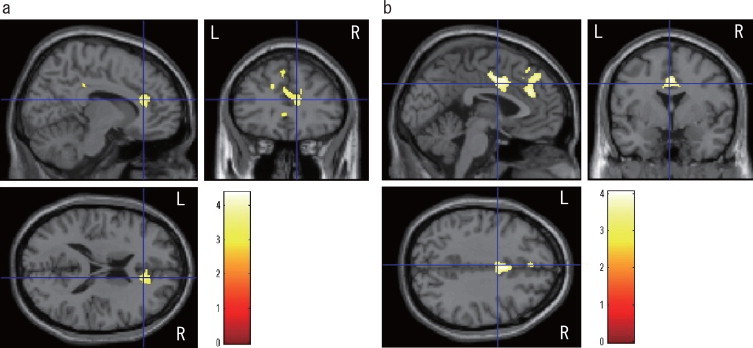
Results from multiple regression in female participants with a threshold of P< 0.001 (uncorrected data). Gray matter volumes in the right rostral anterior cingulate gyrus (a) and bilateral dorsal anterior cingulate gyri (b) were negatively correlated with depressive symptoms (P< 0.05, FWE-corrected, cluster level). Cluster locations, sizes, and significance values are shown in Table 2. R and L indicate right and left, respectively. Color scale (0–4) represents t values.
3.4. DTI analysis of white matter integrity associated with CES-D
In the analysis of all participants combined, there were no significant correlations between DTI measures and CES-D score. In the separate analysis of each sex, TBSS showed clusters of significant FA reduction, MD increase, and RD increase that correlated with the CES-D score in female participants (Fig. 2). 10.3% of all skeleton voxels showed significant negative associations between FA and CES-D, and 16.5% and 20.2% showed positive associations with RD and MD, respectively. The clusters of FA reduction included deep white matter in the bilateral frontal, temporal, and occipital lobes, external capsule, a large portion of the corpus callosum, right anterior cingulate, left fornix, and left uncinate. The clusters of RD increase were in almost the same structures as the clusters of FA reduction. The clusters of MD increase included deep white matter in the bilateral frontal, temporal, occipital, and parietal lobes, external capsule, superior longitudinal fasciculus, a large portion of the corpus callosum, right anterior limb of the internal capsule, left anterior cingulate, left fornix, and left uncinate. The cluster tool in FSL revealed that a largest cluster including the right dorsal anterior cingulum (Fig. 3) showed a significant reduction in FA (P-value at the peak voxel = 0.003, cluster size = 14,170) and an increase in RD (P-value at the peak voxel = 0.002, cluster size = 20,391) in association with the CES-D score. There were no significant clusters of increased FA, reduced MD, or reduced RD. AD showed no significant correlation with the CES-D score. There was no significant correlation between DTI measures and the CES-D score in male participants.
Fig. 2.
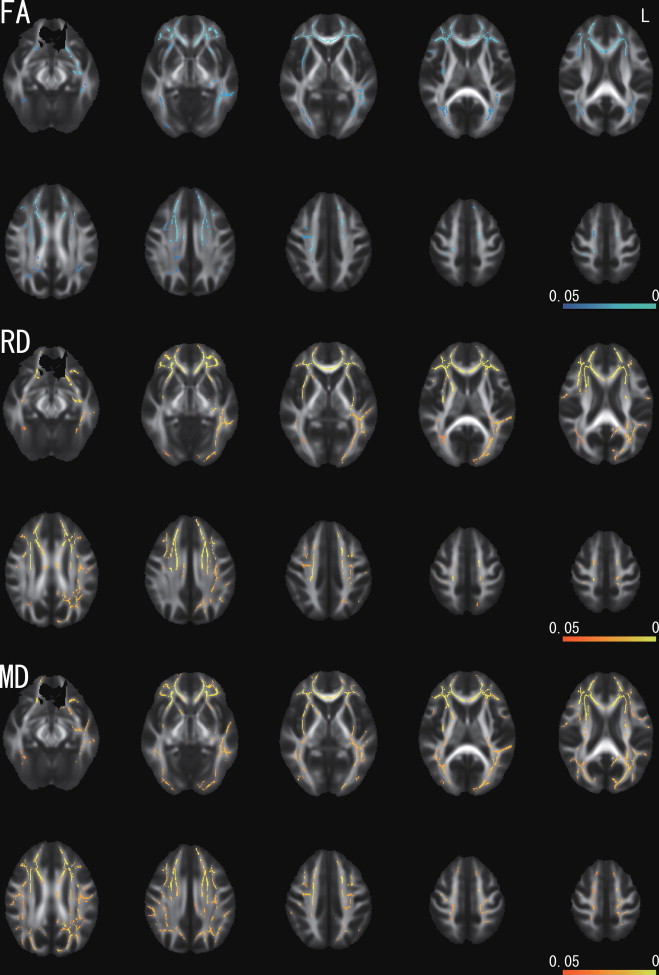
Correlation between FA, RD, MD, and the CES-D score as identified by TBSS in female participants. The statistical image was thresholded at P< 0.05 and overlaid on the mean FA map of all participants. There were significant negative correlations between FA and the CES-D score (blue–light blue), and positive correlations between RD as well as MD and the CES-D score (red–yellow). L indicates left.
Fig. 3.
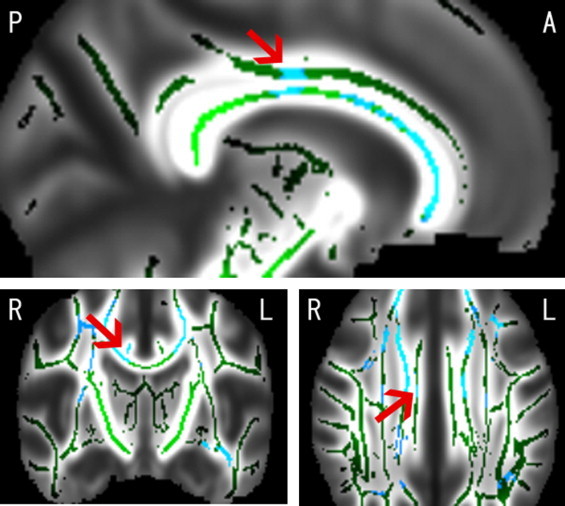
Blue voxels show the regions where FA was reduced in association with the CES-D score in female participants (P< 0.05) overlaid on the mean FA skeleton (green voxels). The background image is the mean FA map of all participants. Arrows indicate the right dorsal anterior cingulate region (Talairach coordinates: x= 6, y= −13, z = 28). The same region was positively correlated with RD (not shown in this figure). A and P indicate anterior and posterior, and R and L indicate right and left, respectively.
4. Discussion
To our knowledge, this is the first report to simultaneously study brain volume and white matter integrity associated with depressive symptoms in a large sample. We found statistically significant results only in the analysis of female participants and not in all participants combined or in male participants. The gray matter volume in the right rostral anterior cingulate and bilateral dorsal anterior cingulate gyrus decreased in association with increased depressive symptoms. There were white matter regions in which FA was negatively correlated with depressive symptoms. The CES-D score in most of the regions showed significant positive correlations with RD and MD.
4.1. The anterior cingulate gyrus and depressive symptoms
Volume reduction in the anterior cingulate gyrus has been reported in major depression (Botteron et al., 2002; Caetano et al., 2006; Lorenzetti et al., 2009). Several studies of community-dwelling populations revealed regional brain volume reductions in the anterior cingulate gyrus associated with depressive symptoms (Boes et al., 2008; Dotson et al., 2009). Boes et al. (2008) revealed volume reduction in the rostral anterior cingulate cortex of boys (but not girls) with subclinical depressive symptoms, suggesting that the rostral anterior cingulate cortex may act as a biological marker of vulnerability to, or as a trait marker of, depression. Moreover, some personality traits, such as harm avoidance, are known to be risk markers for major depression and have relationships with anterior cingulate volume (Grucza et al., 2003; Pujol et al., 2002). The present study, along with the previous reports, indicates that anterior cingulate volume reduction is associated with subclinical depressive symptoms. This is consistent with the hypothesis that this area is associated with vulnerability or future progression to major depression.
In addition, using TBSS, we discovered a negative correlation between FA and the CES-D score, and a positive correlation between RD and the CES-D score, in the right anterior cingulum in female participants. Increased RD reflects demyelination of axons in animal studies (Song et al., 2005). Although the anatomical underpinnings of RD in humans are not fully understood, when the TBSS results are combined with the VBM results, this study suggests that the volume reduction seen in the right anterior cingulate gyrus is the result of demyelination and/or abnormal myelination of the underlying white matter. In the left anterior cingulum, there was a positive correlation between MD and depressive symptoms. By definition, the difference between MD and RD depends on AD. In this study, although AD showed no significant correlation with depressive symptoms, the slight but non-significant variance of AD may have influenced the difference between RD and MD.
4.2. The white matter integrity and depressive symptoms
Disruption of integrity in some white matter regions has recently been reported in major depression (Abe et al., 2010; Kieseppä et al., 2010; Shimony et al., 2009). Kieseppä et al. (2010), using TBSS, suggested that FA is decreased in the left sagittal stratum, right cingulate gyrus, and posterior body of the corpus callosum in major depression. Fewer studies have focused on white matter integrity and subclinical depressive symptoms in healthy participants. As for individuals at risk for depression, Huang et al. (2011) reported lower FA values in white matter tracts including the left cingulum in healthy adolescents at familial risk of unipolar depression than in controls. Some personality traits identified as predisposing factors for affective disorders have been reported to associate with white matter microstructures in widespread brain areas (Ayling et al., 2012; Bj⊘rnebekk et al., 2013; Westlye et al., 2011). Bj⊘rnebekk et al. (2013) demonstrated that increased neuroticism is associated with decreased FA, as well as increased MD and RD in widespread regions of white matter. These regions include the long association fibers connecting the frontal, occipital, parietal, and temporal lobes; tracts connecting orbitofrontal regions with limbic regions; fiber tracts connecting thalamic nuclei with the frontal lobes; and cross-hemispheric pathways, including the corpus callosum. These white matter microstructures may underlie vulnerability to depression, and the present study suggests that widespread regions of white matter are also associated with depressive symptoms in community-dwelling women. The affected regions are broader than regions of volume reduction, suggesting that microstructural changes in white matter precede reductions in brain volume. Note that we did not control for preclinical anxiety as a potential confound in this study. Because anxiety and depression are highly correlated, the results of the current study could have been modulated by comorbid preclinical anxiety. A more detailed analysis of the potential effect of anxiety is an important direction for future research.
4.3. Sex difference
In this study, depressive symptoms were associated with brain volume and white matter integrity only in female participants. One possible explanation of this is that the sex difference per se influences the brain structure in major depression (Frodl et al., 2002; Hastings et al., 2004) and even in subclinical depression. Another explanation is the heterogeneity of the participant's characteristics: the depressive symptoms measured by CES-D were statistically higher in women than in men. Therefore, the possibility remains that male participants who have the same depressive symptoms will show the same patterns in brain structure as females. Additional evidence from a more homogeneous group is needed to examine this possibility.
5. Conclusion
By using both VBM and TBSS in a large group of community-dwelling participants, we have shown associations between brain structures and depressive symptoms in female participants. Our findings show that frontal–limbic structures, including the bilateral anterior cingulate gyrus, are associated with depressive symptoms even at a subclinical level. Moreover, they show that white matter structure is associated with depressive symptoms in widespread regions.
References
- Abe O., Yamasue H., Kasai K., Yamada H., Aoki S., Inoue H., Takei K., Suga M., Matsuo K., Kato T., Masutani Y., Ohtomo K. Voxel-based analyses of gray/white matter volume and diffusion tensor data in major depression. Psychiatry Research. 2010;181:64–70. doi: 10.1016/j.pscychresns.2009.07.007. 19959342 [DOI] [PubMed] [Google Scholar]
- Arfanakis K., Haughton V.M., Carew J.D., Rogers B.P., Dempsey R.J., Meyerand M.E. Diffusion tensor MR imaging in diffuse axonal injury. AJNR. American Journal of Neuroradiology. 2002;23:794–802. 12006280 [PMC free article] [PubMed] [Google Scholar]
- Ayling E., Aghajani M., Fouche J.-P., van der Wee N. Diffusion tensor imaging in anxiety disorders. Current Psychiatry Reports. 2012;14:197–202. doi: 10.1007/s11920-012-0273-z. 22460663 [DOI] [PubMed] [Google Scholar]
- Bj⊘rnebekk A., Fjell A.M., Walhovd K.B., Grydeland H., Torgersen S., Westlye L.T. Neuronal correlates of the five factor model (FFM) of human personality: multimodal imaging in a large healthy sample. Neuroimage. 2013;65:194–208. doi: 10.1016/j.neuroimage.2012.10.009. 23063449 [DOI] [PubMed] [Google Scholar]
- Boes A.D., McCormick L.M., Coryell W.H., Nopoulos P. Rostral anterior cingulate cortex volume correlates with depressed mood in normal healthy children. Biological Psychiatry. 2008;63:391–397. doi: 10.1016/j.biopsych.2007.07.018. 17916329 [DOI] [PMC free article] [PubMed] [Google Scholar]
- Botteron K.N., Raichle M.E., Drevets W.C., Heath A.C., Todd R.D. Volumetric reduction in left subgenual prefrontal cortex in early onset depression. Biological Psychiatry. 2002;51:342–344. doi: 10.1016/S0006-3223(01)01280-X. 11958786 [DOI] [PubMed] [Google Scholar]
- Bremner J.D., Vythilingam M., Vermetten E., Nazeer A., Adil J., Khan S., Staib L.H., Charney D.S. Reduced volume of orbitofrontal cortex in major depression. Biological Psychiatry. 2002;51:273–279. doi: 10.1016/S0006-3223(01)01336-1. 11958777 [DOI] [PubMed] [Google Scholar]
- Caetano S.C., Kaur S., Brambilla P., Nicoletti M., Hatch J.P., Sassi R.B., Mallinger A.G., Keshavan M.S., Kupfer D.J., Frank E., Soares J.C. Smaller cingulate volumes in unipolar depressed patients. Biological Psychiatry. 2006;59:702–706. doi: 10.1016/j.biopsych.2005.10.011. 16414029 [DOI] [PubMed] [Google Scholar]
- Campbell S., Marriott M., Nahmias C., MacQueen G.M. Lower hippocampal volume in patients suffering from depression: a meta-analysis. American Journal of Psychiatry. 2004;161:598–607. doi: 10.1176/appi.ajp.161.4.598. 15056502 [DOI] [PubMed] [Google Scholar]
- Cuijpers P., de Graaf R., van Dorsselaer S. Minor depression: risk profiles, functional disability, health care use and risk of developing major depression. Journal of Affective Disorders. 2004;79:71–79. doi: 10.1016/S0165-0327(02)00348-8. 15023482 [DOI] [PubMed] [Google Scholar]
- Dotson V.M., Davatzikos C., Kraut M.A., Resnick S.M. Depressive symptoms and brain volumes in older adults: a longitudinal magnetic resonance imaging study. Journal of Psychiatry & Neuroscience : JPN. 2009;34:367–375. 19721847 [PMC free article] [PubMed] [Google Scholar]
- Egger K., Schocke M., Weiss E., Auffinger S., Esterhammer R., Goebel G., Walch T., Mechtcheriakov S., Marksteiner J. Pattern of brain atrophy in elderly patients with depression revealed by voxel-based morphometry. Psychiatry Research. 2008;164:237–244. doi: 10.1016/j.pscychresns.2007.12.018. 19013058 [DOI] [PubMed] [Google Scholar]
- !(ce:label)!Fazekas F., Chawluk J.B., Alavi A., Hurtig H.I., Zimmerman R.A. MR signal abnormalities at 1.5 T in Alzheimer's dementia and normal aging. American Journal of Roentgenology. 1987;149:351–356. doi: 10.2214/ajr.149.2.351. [DOI] [PubMed] [Google Scholar]
- Frodl T., Meisenzahl E.M., Zetzsche T., Born C., Groll C., Jäger M. Hippocampal changes in patients with a first episode of major depression. American Journal of Psychiatry. 2002;159:1112–1118. doi: 10.1176/appi.ajp.159.7.1112. 12091188 [DOI] [PubMed] [Google Scholar]
- Grucza R.A., Przybeck T.R., Spitznagel E.L., Cloninger C.R. Personality and depressive symptoms: a multi-dimensional analysis. Journal of Affective Disorders. 2003;74:123–130. doi: 10.1016/S0165-0327(02)00303-8. 12706513 [DOI] [PubMed] [Google Scholar]
- Harsan L.A., Poulet P., Guignard B., Steibel J., Parizel N., de Sousa P.L., Boehm N., Grucker D., Ghandour M.S. Brain dysmyelination and recovery assessment by noninvasive in vivo diffusion tensor magnetic resonance imaging. Journal of Neuroscience Research. 2006;83:392–402. doi: 10.1002/jnr.20742. 16397901 [DOI] [PubMed] [Google Scholar]
- Hastings R.S., Parsey R.V., Oquendo M.A., Arango V., Mann J.J. Volumetric analysis of the prefrontal cortex, amygdala, and hippocampus in major depression. Neuropsychopharmacology : Official Publication of the American College of Neuropsychopharmacology. 2004;29:952–959. doi: 10.1038/sj.npp.1300371. 14997169 [DOI] [PubMed] [Google Scholar]
- Haringsma R., Engels G.I., Beekman A.T., Spinhoven P. The criterion validity of the Center for Epidemiological Studies Depression Scale (CES-D) in a sample of self-referred elders with depressive symptomatology. International Journal of Geriatric Psychiatry. 2004;19:558–563. doi: 10.1002/gps.1130. 15211536 [DOI] [PubMed] [Google Scholar]
- Hayakawa Y.K., Sasaki H., Takao H., Mori H., Hayashi N., Kunimatsu A., Aoki S., Ohtomo K. Structural brain abnormalities in women with subclinical depression, as revealed by voxel-based morphometry and diffusion tensor imaging. Journal of Affective Disorders. 2013;144:263–268. doi: 10.1016/j.jad.2012.10.023. 23141669 [DOI] [PubMed] [Google Scholar]
- Huang H., Fan X., Williamson D.E., Rao U. White matter changes in healthy adolescents at familial risk for unipolar depression: a diffusion tensor imaging study. Neuropsychopharmacology: Official Publication of the American College of Neuropsychopharmacology. 2011;36:684–691. doi: 10.1038/npp.2010.199. 21085111 [DOI] [PMC free article] [PubMed] [Google Scholar]
- Jovicich J., Czanner S., Greve D., Haley E., van der Kouwe A., Gollub R., Kennedy D., Schmitt F., Brown G., Macfall J., Fischl B., Dale A. Reliability in multi-site structural MRI studies: effects of gradient non-linearity correction on phantom and human data. Neuroimage. 2006;30:436–443. doi: 10.1016/j.neuroimage.2005.09.046. 16300968 [DOI] [PubMed] [Google Scholar]
- Kieseppä T., Eerola M., Mäntylä R., Neuvonen T., Poutanen V.P., Luoma K., Tuulio-Henriksson A., Jylhä P., Mantere O., Melartin T., Rytsälä H., Vuorilehto M., Isometsä E. Major depressive disorder and white matter abnormalities: a diffusion tensor imaging study with tract-based spatial statistics. Journal of Affective Disorders. 2010;120:240–244. doi: 10.1016/j.jad.2009.04.023. 19467559 [DOI] [PubMed] [Google Scholar]
- Lavretsky H., Kumar A. Clinically significant non-major depression: old concepts, new insights. American Journal of Geriatric Psychiatry: Official Journal of the American Association for Geriatric Psychiatry. 2002;10:239–255. doi: 10.1176/appi.ajgp.10.3.23910.1097/00019442-200205000-00003. 11994211 [DOI] [PubMed] [Google Scholar]
- Lorenzetti V., Allen N.B., Fornito A., Yücel M. Structural brain abnormalities in major depressive disorder: a selective review of recent MRI studies. Journal of Affective Disorders. 2009;117:1–17. doi: 10.1016/j.jad.2008.11.021. 19237202 [DOI] [PubMed] [Google Scholar]
- Lyness J.M., King D.A., Cox C., Yoediono Z., Caine E.D. The importance of subsyndromal depression in older primary care patients: prevalence and associated functional disability. Journal of the American Geriatrics Society. 1999;47:647–652. doi: 10.1111/j.1532-5415.1999.tb01584.x. 10366161 [DOI] [PubMed] [Google Scholar]
- Nichols T.E., Holmes A.P. Nonparametric permutation tests for functional neuroimaging: a primer with examples. Human Brain Mapping. 2002;15:1–25. doi: 10.1002/hbm.1058. 11747097 [DOI] [PMC free article] [PubMed] [Google Scholar]
- Pujol J., López A., Deus J., Cardoner N., Vallejo J., Capdevila A., Paus T. Anatomical variability of the anterior cingulate gyrus and basic dimensions of human personality. NeuroImage. 2002;15:847–855. doi: 10.1006/nimg.2001.1004. 11906225 [DOI] [PubMed] [Google Scholar]
- Radloff L.S. The CES-D Scale:a self-report depression scale for research in the general population. Applied Psychological Measurement. 1977;1:386–401. [Google Scholar]
- Shimony J.S., Sheline Y.I., D'Angelo G., Epstein A.A., Benzinger T.L., Mintun M.A., McKinstry R.C., Snyder A.Z. Diffuse microstructural abnormalities of normal-appearing white matter in late life depression: a diffusion tensor imaging study. Biological Psychiatry. 2009;66:245–252. doi: 10.1016/j.biopsych.2009.02.032. 19375071 [DOI] [PMC free article] [PubMed] [Google Scholar]
- Smith S.M. Fast robust automated brain extraction. Human Brain Mapping. 2002;17:143–155. doi: 10.1002/hbm.10062. 12391568 [DOI] [PMC free article] [PubMed] [Google Scholar]
- Smith S.M., Jenkinson M., Woolrich M.W., Beckmann C.F., Behrens T.E., Johansen-Berg H., Bannister P.R., De Luca M., Drobnjak I., Flitney D.E., Niazy R.K., Saunders J., Vickers J., Zhang Y., De Stefano N., Brady J.M., Matthews P.M. Advances in functional and structural MR image analysis and implementation as FSL. Neuroimage. 2004;23(Suppl 1):S208–S219. doi: 10.1016/j.neuroimage.2004.07.051. 15501092 [DOI] [PubMed] [Google Scholar]
- Smith S.M., Jenkinson M., Johansen-Berg H., Rueckert D., Nichols T.E., Mackay C.E., Watkins K.E., Ciccarelli O., Cader M.Z., Matthews P.M., Behrens T.E. Tract-based spatial statistics: voxelwise analysis of multi-subject diffusion data. Neuroimage. 2006;31:1487–1505. doi: 10.1016/j.neuroimage.2006.02.024. 16624579 [DOI] [PubMed] [Google Scholar]
- Smith S.M., Nichols T.E. Threshold-free cluster enhancement: addressing problems of smoothing, threshold dependence and localisation in cluster inference. Neuroimage. 2009;44:83–98. doi: 10.1016/j.neuroimage.2008.03.061. 18501637 [DOI] [PubMed] [Google Scholar]
- Song S.K., Sun S.W., Ramsbottom M.J., Chang C., Russell J., Cross A.H. Dysmyelination revealed through MRI as increased radial (but unchanged axial) diffusion of water. Neuroimage. 2002;17:1429–1436. doi: 10.1006/nimg.2002.1267. 12414282 [DOI] [PubMed] [Google Scholar]
- Song S.K., Sun S.W., Ju W.K., Lin S.J., Cross A.H., Neufeld A.H. Diffusion tensor imaging detects and differentiates axon and myelin degeneration in mouse optic nerve after retinal ischemia. NeuroImage. 2003;20:1714–1722. doi: 10.1016/j.neuroimage.2003.07.005. 14642481 [DOI] [PubMed] [Google Scholar]
- Song S.K., Yoshino J., Le T.Q., Lin S.J., Sun S.W., Cross A.H., Armstrong R.C. Demyelination increases radial diffusivity in corpus callosum of mouse brain. Neuroimage. 2005;26:132–140. doi: 10.1016/j.neuroimage.2005.01.028. 15862213 [DOI] [PubMed] [Google Scholar]
- Videbech P., Ravnkilde B. Hippocampal volume and depression: a meta-analysis of MRI studies. American Journal of Psychiatry. 2004;161:1957–1966. doi: 10.1176/appi.ajp.161.11.1957. 15514393 [DOI] [PubMed] [Google Scholar]
- Westlye L.T., Bj⊘rnebekk A., Grydeland H., Fjell A.M., Walhovd K.B. Linking an anxiety-related personality trait to brain White matter microstructure. Archives of General Psychiatry. 2011;68:369–377. doi: 10.1001/archgenpsychiatry.2011.24. 21464361 [DOI] [PubMed] [Google Scholar]
- Wozniak J.R., Lim K.O. Advances in white matter imaging: a review of in vivo magnetic resonance methodologies and their applicability to the study of development and aging. Neuroscience and Biobehavioral Reviews. 2006;30:762–774. doi: 10.1016/j.neubiorev.2006.06.003. 16890990 [DOI] [PMC free article] [PubMed] [Google Scholar]