

Abstract
Spike-wave discharges (SWDs) are thalamocortical oscillations that are often considered to be the EEG correlate of absence seizures. GAERS and Wag/Rij rat strains exhibit SWDs and are considered to be genetic animal models of absence epilepsy. However, it has been reported that other rat strains have SWDs, suggesting that SWDs may vary in their prevalence but all rats have a predisposition for them. This is important because many of these rat strains are used to study temporal lobe epilepsy (TLE), where it is assumed that there is no seizure-like activity in controls. In the course of other studies about the Sprague-Dawley rat, a common rat strain for animal models of TLE, we found that approximately 19% of 2–3 month old naïve female Sprague-Dawley rats exhibited SWDs spontaneously during periods of behavioral arrest and they continued for months. Males exhibited SWDs only after 3 months of age, consistent with previous reports [1]. Housing in atypical lighting during early life appeared to facilitate the incidence SWDs.
SWDs were often accompanied by behaviors similar to stage 1–2 limbic seizures. Therefore, additional analyses were made to address the similarity. We observed that the frequency of SWDs was similar to theta rhythm during exploration for a given animal, typically 7–8 Hz. Therefore, activity in the frequency of theta rhythm that occurs during frozen behavior may not reflect seizures necessarily. Hippocampal recordings exhibited high frequency oscillations (>250 Hz) during SWDs, suggesting neuronal activity in hippocampus occurs during SWDs, i.e., it is not a passive structure. The data also suggest that high frequency oscillations, if rhythmic, may reflect SWDs. We also confirmed that SWDs were present in a common animal model of TLE, the pilocarpine model, using female Sprague-Dawley rats. Therefore, damage and associated changes to thalamic, hippocampal and cortical neurons in does not prevent SWDs, at least in this animal model. The results suggest that it is possible that SWDs occur in rodent models of TLE and investigators mistakenly assume they are stage 1–2 limbic seizures. We discuss the implications of the results and ways to avoid the potential problems associated with SWDs in animal models of TLE..
Keywords: thalamocortical oscillations, absence seizures, limbic seizures, video-EEG, pilocarpine, female
INTRODUCTION
Spike wave discharges (SWDs) are rhythmic oscillations composed of spikes followed by slow waves generated by thalamocortical circuitry [2–7]. In patients with absence epilepsy, where spontaneous SWDs occur synchronously in both hemispheres, they are associated with a temporary loss or ‘absence’ of consciousness [4, 6, 8–10].
Two rat strains, GAERS (Genetic Absence Epilepsy Rat of Strasbourg; [11] and Wag/Rij (Wistar Albino Glaxo Rats from Rijswijk; [12]) exhibit spontaneous SWDs, and have been used as genetic animal models of absence epilepsy. These animals display generalized SWDs at 7–12 Hz primarily during periods of immobility, also called behavioral arrest, which is a pause in activity with frozen posture and open eyes.
SWDs have also been observed in other rat strains such as Long-Evans [1, 13–17], Fischer 344 [1, 16, 18, 19], Wistar [16, 20], Buffalo [1], Agouti [16, 21] and Brown [21] or Brown Norway [16, 22] although not at all ages, in all animals, or both sexes. There have been conflicting reports for the Sprague-Dawley rat strain: spontaneous SWDs during behavioral arrest were described in some studies [1, 18, 23] but were not observed in others [1, 16] or observed rarely [24, 25]. In studies of control and photothrombotic-lesioned Sprague-Dawley rats, both groups showed SWD [23]. SWDs in Sprague-Dawley rats are important because this strain is commonly used in animal models of temporal lobe epilepsy (TLE). In many of these animal models, insult or injury (e.g., febrile seizures, neonatal hypoxia/ischemia, traumatic brain injury, status epilepticus or SE) is used to induce epilepsy, typically at young ages (<2 months;[26]). Weeks and months later, animals are examined to characterize whether spontaneous limbic seizures emerge, typically using the Racine scale, which ranges from 1 to 5 [27]. The least severe seizure is stage 1 and includes a frozen posture with mouth and facial movements. Stage 2 corresponds to small movements of the head, such as head nodding [25].
If the strain that is used for studies of TLE naturally develops SWDs in adulthood, investigators have a possible confound when they try to address the emergence of epilepsy in animals at that age. This confound would be more of a problem if animals exhibit increased hippocampal neuronal activity during SWDs, and recording electrodes were only in hippocampus, making it unclear that the rhythmic hippocampal activity reflects SWDs. Investigators might interpret the increased activity in hippocampus to reflect a limbic stage 1–2 seizure when it actually reflects SWDs occurring normally in the animal during behavioral arrest, originating in thalamocortical circuits that only indirectly affect hippocampus.
Here we report that, during experiments intended to study the EEG of the normal female Sprague-Dawley rat, we found that SWDs were present in a subset of female and male rats. We first confirmed if the SWDs were similar in characteristics to previously-described SWDs in rodents. We then added analyses to further characterize SWDs, emphasizing the analyses that would be relevant to a comparison with stage 1–2 limbic seizures. Our observations suggest that investigators could easily mistake SWDs for stage 1–2 limbic seizures.
Next, we questioned whether the SWDs would actually occur in an animal model of TLE, because many of the models of experimental TLE are associated with extensive thalamic and cortical damage and therefore could block thalamocortical oscillations. In addition, there is cell loss in hippocampus, which may lead to an absence of activity in hippocampal recordings even if they occurred in thalamocortical sites. Indeed, in a model of neocortical epilepsy induced by photothrombosis, SWDs declined in the lesioned group compared to sham rats [19]. We report here that in the pilocarpine model, where SE is induced with an injection of pilocarpine and then epilepsy develops in subsequent weeks, SWDs actually increase. Therefore, SWDs are an important consideration in animal models of TLE and may become more important rather than less important, depending on the model. The implications of these findings for animal research in TLE are discussed. We also suggest methods to circumvent the potential confounds associated with the use of rats in animal models of TLE.
MATERIALS AND METHODS
Subjects
All experiments were conducted in accordance with the National Institutes of Health (NIH) guidelines for the care and use of laboratory animals. Adult male and female Sprague-Dawley rats that were used for breeding were obtained from Charles River laboratories (Wilmington, MA). Animals that were shipped after birth were obtained from the same source and were shipped at approximately 5–6 weeks of age.
Housing
Subjects were housed in standard opaque rat cages with food and water ad libitum. Animals were housed 2–3/cage prior to surgery and housed alone after implantation of electrodes. Subjects housed in a standard environment had a 12 hr:12 hr light:dark cycle starting at 7 a.m (“typical light”). Subjects housed in a second environment (“atypical light”) had a 9 hr:15 hr light: dark cycle beginning at 9 a.m. In addition, there was dim overhead light that remained on 24 hr/day. All animals were fed the same chow (Purina 5001; W.F. Fisher, Somerville, NJ).
Surgery to implant electrodes
Subjects were initially anesthetized with a dose of 0.1 ml/100g (i.p.) of a ketamine/xylazine solution (#K4138, 80mg/ml ketamine/6mg/ml xylazine; Sigma-Aldrich, St Louis MO) followed by isoflurane (Isotec, Surgivet; Dublin, OH). After shaving hair on the scalp (Model 8900; Wahl USA; Sterling, IL), and lubricating eyes (Altalube; Butler Schein, Dublin, OH), animals were placed in a stereotaxic apparatus (Model 502603; World Precision Instruments, Sarasota, FL) on a heating pad with rectal probe for control of body temperature using a heater with a feedback circuit to maintain temperature at 37°C (Homeothermic temperature controller; Harvard Apparatus, Holliston, MA). A scalp incision was used to expose the dorsal surface of the skull, and holes were drilled (Model C300; Grobet USA, Carlstadt, NJ; 0.7 mm drill bits; Fine Science Tools, Foster City, CA) to implant 8 electrodes: 4 epidural electrodes (bone skull screws; Frederick Haer, Bowdoin ME) and 2 bipolar depth electrodes made in-house (twisted 75 μm-diameter Teflon-coated stainless steel wire; California Fine Wire, Grover Beach, CA). Epidural electrodes were placed bilaterally over the frontal cortex (FC) and occipital cortex (OC). Coordinates for FC electrodes were: -1.0 mm posterior to Bregma and 3.0 mm lateral to the midline. For OC electrodes, coordinates were -6.0 mm and 3.0 mm. One ground electrode was implanted 1.0 mm anterior to Bregma and 3.0 mm lateral to the midline. The reference electrode was 1.0 mm posterior to Lambda and 1.5 mm lateral to the midline. Depth electrodes were located in dorsal hippocampus (1/hippocampus): -3.5 mm posterior to Bregma, 3.5 mm lateral to the midline, and 3.5 mm below dura. Electrodes were inserted into a 16-pin connector (Digi-key; Thief River Falls, MN), and the connector was fixed to the skull (dental cement; Henry Schein Inc, Melville, NY). Animals were treated with buprenorphine (0.5 mg/kg; Henry Schein) i.p. and yohimbine (2 mg/kg, i.p., Henry Schein) immediately after surgery, and handled by the experimenter as they awoke from anesthesia. The handling at this time is notable because it appeared to decrease hyperactivity during handling and recording in the subsequent weeks. This could have allowed us to observe spontaneous periods of behavioral arrest more often because animals were less active after the onset of a recording session.
Video-EEG recording
Subjects were allowed 1 week to recover from surgery. During this time, the same investigator that conducted surgery habituated animals to the cage where recordings would be made by placing them in the cage for 1 hr daily. During recording, animals were allowed to move freely while attached to a digital telemetry system (Bio-Signal Corp., Brooklyn, NY) which included a transmitter that plugged into the pin connector on the skull. The transmitter was attached by a cable to a commutator (#SL2C; Plastics One, Roanoke, VA) to allow freedom of movement. Recordings were synchronized with a video camera (Axis Systems, Auburn Hills, MI). EEG was acquired at 2 kHz using Acqknowledge (version 4.1; Biopac Systems, Goleta, CA).
Recordings were made for approximately 1 hr between 9:00 a.m. and 12:00 p.m. During recordings, an investigator marked the times in the EEG record that were accompanied by exploration, behavioral arrest, or sleep. Behavioral arrest was defined as a spontaneous pause in behavior when there was a frozen posture and the eyes were open. Periods of behavioral arrest that lasted <2 sec are not included in the analysis of SWDs because more than 2 sec were required to determine, unequivocally, if was behavioral arrest. Notably, during brief pauses lasting <2 sec, SWDs were not observed. Exploration was defined as walking, e.g., walking across the cage, and was typically associated with theta oscillations in one or more of the electrodes in the hippocampus. Sleep was defined by closed eyes, absence of movement, with slow waves in the epidural electrodes. Occasionally animals were in behavioral arrest and eyelids slowly lowered; because this behavior suggests a transition to sleep it was not included in analysis of behavioral arrest.
For the purposes of this study, the phrase ‘spontaneous behavioral arrest’ is the same as ‘spontaneous immobility,’ and is only a judgement of behavior, not the EEG accompanying it. An investigator watched the animal during recording sessions, not the EEG display, so it is unlikely that the investigator was biased by the EEG in making a determination of behavioral state. A second investigator examined the EEG records manually for SWDs after all data were collected, without knowledge of behavioral state. During this review, SWDs were not detected during exploration. Also, the extent that spontaneous behavioral arrest occurred varied greatly from one recording session to the next. Therefore, the number of SWD episodes is not reported. Instead, the duration of SWDs during spontaneous behavioral arrest was determined.
Data analysis of video-EEG
SWDs were defined by a spike-wave oscillation as shown in Figure 1. When this oscillation was detected, it never occurred in one lead, but sometimes it was not evident in all 8 recording sites. Therefore, we defined SWDs as the oscillations that occurred in at least 2 channels. The onset of a SWD episode was defined as the start of the first spike of the spike-wave rhythm, and was defined by the electrode where the SWDs was largest in amplitude, typically the FC electrode. The end of a SWD episode was the time when the last slow wave ended.
Figure 1. SWDs in adult Sprague-Dawley rats.

A. A schematic illustrates the location of implanted electrodes. There were four epidural (screw) electrodes, two over frontal cortex (one/hemisphere) and two over occipital cortex (one/hemisphere). Two twisted bipolar electrodes were placed in dorsal hippocampus (one in each hemisphere). Reference (Ref) and ground (Gnd) electrodes were epidural screws.
B. The percentage of naïve rats with SWDs is shown. Differences were not significant (p=0.090). Samples sizes are above each bar.
C. SWDs are interrupted by noise. An example of a SWD during behavioral arrest from a naïve rat. A noise occurred at the arrow and interrupted the SWD episode, which resumed spontaneously. When the SWD was disrupted, the animal moved, turning towards the noise. When the SWD resumed, the rat froze, exhibiting the behavior typical of behavioral arrest. In this figure and other figures, OC= occipital cortex; FC= frontal cortex; HC= hippocampus.
D. 1–3. A representative example of SWDs before (Pre), after ethosuximide administration (approximately 30 min after; Post), and 24 hrs later (Recovery). In 2, the transition between exploration and behavioral arrest is marked by the arrowhead. The bar marks the period of hippocampal theta oscillations occurring before behavioral arrest. 4. SWDs are quantified as the duration of SWDs in 2 min of spontaneous behavioral arrest, expressed as a percent. The differences in SWDs were significant (n=3 rats/group; p<0.05).
To quantify SWDs, animals with SWDs were selected from all animals that had been recorded. Two experimenters reviewed the data. The first experimenter knew the behavioral state because the recordings were reviewed at the time they were made. The second experimenter reviewed recordings after they were taken and did not know behavioral state. In animals where SWDs were observed, the duration of SWDs during 2 min of behavioral arrest was calculated, using the first 2 min of spontaneous behavioral arrest that occurred during a recording session. Periods of behavioral arrest sometimes lasted less than 2 min and in these cases each period of behavioral arrest was summed until the total duration used for quantification was 2 min. The percentage of SWDs during behavioral arrest was calculated as follows: (duration of SWDs)/(total duration of behavioral arrest) × 100.
Blackman filters (-61db, 200–500 Hz) were used to examine high frequency oscillations using Acqknowledge software; similar results were obtained with other filters (e.g., Hamming). Spectrograms were generated using a custom-written script in MATLAB (MathWorks, Natick, MA). Theta and SWD frequency was calculated by defining one cycle as the time from one peak to the next (for theta oscillations) or one peak of the wave component of spike-wave oscillations to the next (for spike-wave).
Histology
At the end of recordings, subjects were deeply anesthetized by isoflurane inhalation and decapitated. The brain was removed and immersed in 4% paraformaldehyde (pH 7.4; Sigma-Aldrich, St. Louis, MO) as described elsewhere [28]. To confirm electrode positions, 50 μm coronal sections were cut using a vibratome (TPI 3000, The Vibratome Co., St. Louis, MO) and were stained with 1% cresyl violet (Sigma-Aldrich) as described elsewhere [29]. Upon removal of the skull in 9 of 10 of the animals with SWDs, there was no evidence of infection or penetration of the dura by epidural electrodes. In these animals, we confirmed that the tips of hippocampal electrodes were in the hippocampal formation.
Gonadectomy
Bilateral gonadectomy or sham surgery was conducted as previously described [30]. In brief, animals were anesthetized with ketamine/xylazine (for dose, see Surgery to implant electrodes), and the animal was maintained at 37°C using the heating pad with rectal probe (described above; see Surgery to implant electrodes). The abdomen was shaved with a small animal shaver (as described above; see Surgery to implant electrodes) and the area was swabbed with Betadine. An abdominal incision was made with a sterile scalpel and the gonads were removed and ligated with sterile sutures (Henry Schein). The incision was swabbed with Betadine and closed with wound clips (EZ clip wound closures, Stoelting Co., Wood Dale IL). No recordings were made during the week after surgery, to allow for recovery.
Pharmacology
Ethosuximide (100 mg/kg i.p.; #E7138; Sigma-Aldrich) was dissolved in 0.9% NaCl and stored at 4°C.
Pilocarpine
Animals were placed into individual transparent cages without bedding and maintained in dim light. The muscarinic cholinergic antagonist atropine methylbromide (1mg/kg, s.c., #A6883, Sigma-Aldrich; dissolved in phosphate buffered saline) was injected to decrease the peripheral cholinergic effects of pilocarpine, and raloxifene hydrochloride was injected soon thereafter, because it reduces mortality of pilocarpine-induced SE in females (2 mg/kg, s.c., #R1402, Sigma-Aldrich; dissolved in dimethylsulfoxide; [31]). Thirty min later, pilocarpine hydrocholoride was administered (380 mg/kg, s.c., #P6503; Sigma-Aldrich; dissolved in 0.9% NaCl). Most animals exhibited one or more stage 3–5 seizures in the 60 min after pilocarpine injection, and then SE, defined as a stage 4–5 seizure that was not followed by resumption of normal behavior for at least 5 min [30]. Animals were injected with diazepam (if SE was mild, defined by repetitive twitching of the body; 5 mg/kg; Baxter, Franklin Lakes, NJ) or Nembutal sodium solution (if SE was more severe, defined by repetitive strong tonic-clonic movements; 30–50 mg/kg; Ovation Pharm., Deerfield, IL) within 60 min of SE onset. All rats were injected with 1 ml Lactated Ringer’s solution within 6 hrs of SE onset (i.p.; Henry Schein). In the subsequent days (~7 days), 1) food pellets were placed at the base of the cage to facilitate food intake, 2) a normal age-matched rat was placed in the cage to reinstate social housing, 3) animals were handled 1–2x daily. After 4 weeks, animals were implanted with electrodes as described above, and housed alone thereafter. All animals that had SE developed epilepsy, defined by at least one spontaneous stage 3–5 seizure in the 4–8 weeks after SE.
Statistics
Data are reported as mean ± standard error of the mean (sem). Data were analyzed using GraphPad Prism (version 5.04, La Jolla, CA). Fisher’s exact test was used when the sample size of at least one experimental group was <10. χ2 test was used when the sample size of both groups were >10.
RESULTS
SWDs occur spontaneously in a subset of Sprague-Dawley rats
In 51 naive rats that were implanted with electrodes in adulthood (2–3 months old) and examined one week later, 7 (13.7%) animals exhibited SWDs during spontaneous periods of behavioral arrest (Fig. 1B). The 7 animals with SWDs were naive female rats (7/36 or 19.4% of all naïve females). No naive males had SWDs at this age (0/15 naïve males; Fig. 1B).
The difference between females (7/36) and males (0/15) was not statistically significant (χ2 test; p=0.087). However, the fact that males did not show SWDs at this age led us to examine gonadectomized male rats. Gonadectomized rats allowed us to determine whether SWDs would be unmasked by the reduction in serum testosterone levels, consistent with the evidence that testosterone suppresses excitability in males ([29, 31–34]; but see [35]). Interestingly, in males, 2/11 or 18.1% of orchidectomized males exhibited SWDs. Perhaps more importantly, 1/6 or 16.7% of sham males had SWDs. Although not significantly different (p=0.390) the data showed that males could exhibit SWDs – even after a sham surgery. We therefore examined the possibility that these animals simply exhibited some SWDs because they were older than the naïve males used earlier (Fig. 1B). In fact, the males that exhibited SWDs were older (6.8 ± 0.6 months for 14 of the 17 males; birth dates were not recorded in some males) than the naïve male rats that did not show SWDs (4.1 ± 0.9 months, n=12; Student’s t-test, p=0.026). These data are consistent with previous reports that SWDs in male Sprague-Dawley rats typically emerge after 6 months of age [12]. In summary, the data suggest that Sprague-Dawley females have spontaneous SWDs as early as 2–3 months of age, whereas they develop at older ages in males.
It seems unlikely that SWDs were underestimated because each animal that had SWDs had them almost every day for multiple weeks (mean, 25 ± 3 days, ~1 hr per day, n=10 rats with SWDs) Animals which did not exhibit SWDs were typically recorded for the same time or longer. Nevertheless, we cannot exclude the possibility that more recordings would have made it possible to identify more animals with SWDs. Notably, seizures accompanied by convulsive behavior (stages 3–5 on the Racine scale;[27]) was not observed in any of the animals.
Characteristics of SWDs in Sprague-Dawley rats
To confirm that SWDs observed in our cohort were similar to those that have been previously described, several measurements were made. First, we asked which electrodes exhibited the most robust SWDs, in terms of size and morphology (i.e., where the clearest spike-wave morphology was recorded) and confirmed the sites were cortical (Figs. 1–3) as would be expected of SWDs based on previous studies. We also found that SWDs only occurred during periods of behavioral arrest, and animals appeared to be unresponsive because if animals were touched or a loud noise was made, the SWDs stopped, and typically the animal also moved, orienting towards the touch or the noise. If the noise was brief, SWDs often resumed (Fig. 1C), and the body froze again. These characteristics are similar to previous descriptions of SWDs in rats discussed in more detail elsewhere [32]. However, they do differ from type II SWDs in Wag/Rij rats [40, 41] and male Fisher 344 rats, where SWDs were noticed in diverse behavioral states [18].
Figure 3. SWDs in naïve rats resemble seizure-like discharges in the hippocampal recording.

A. 1–4. EEG is shown for a period of exploration (1) and behavioral arrest (2–4) from the same recording session. 3. The part of the SWD episode boxed in red is shown with greater temporal resolution as indicated by the arrow. 4. One of the poles of the left hippocampal recording is expanded to show that the recording in hippocampus resembles a seizure. Calibration for 1–2 is shown in 2; calibration for 3 is shown in 3; calibration for 4 is shown to the right of the trace.
B. 1–4. EEG is shown from a different animal, with a recording during a period of exploration on the left (1), a recording during behavioral arrest with a SWD in the center (2), and expansion of the area in the red box on the far right (3). 4. The recording in the blue box is expanded below 2. Same calibrations as A.
Ethosuximide, a T-type calcium channel antagonist that blocks SWDs [20, 33–40], was used to confirm it would block SWDs in our rats. As shown in Figure 1D, ethosuximide dramatically reduced SWDs reversibly. To conduct this experiment, an animal was recorded for a typical 1 hr session, injected with ethosuximide 24 hrs later, recorded immediately thereafter for a 1–3 hr session, and then recorded for 1 hr the next day to determine if there was recovery. After at least 3 days, the procedure was repeated. For each animal, measurements for the two procedures were averaged. The measurement was duration of SWDs in the first 2 min of spontaneous behavioral arrest. In three animals where ethosuxmide was injected, dramatic reduction or blockade of SWDs occurred shortly after injection and there was recovery the next day (Fig. 1D). There were significant differences before, 30 min after ethosuximide, and 24 hrs later (Friedman’s test, p=0.008). In three animals, 1 of which was the same, vehicle was tested (once per animal), and had no effect (p=0.796).
To establish the degree that each animal exhibited SWDs, the first two minutes of spontaneous behavioral arrest were analyzed for 9 of the 10 animals that exhibited SWDs. These periods of behavioral arrest were examined for each of the first 4–6 days of recordings. Measurements were made of the duration of time during these 2 minutes of behavioral arrest when SWDs occurred. The percentage of the 2 minutes when animals exhibited SWDs varied for each animal (range, 6.0–70.2%, n=9) but on average, was approximately 1/3 of the time during behavioral arrest (mean 36.6 ± 8.0 %, n=9). The use of 2 minutes is likely to provide a good estimate, because the amount of time when SWDs occurred during the first 2 minutes of behavioral arrest were similar to the values for the second 2 minutes, in 4 animals where it was compared (Paired t-test, p=0.536).
Two types of SWDs, type I and II, have been previously described in Wag-Rij rats, where type II SWDs occur in behavioral states other than behavioral arrest [41, 42]. SWDs occurring in states other than spontaneous behavioral arrest have also been reported in Sprague-Dawley rats [19]. In these prior studies, there was variability in the morphology of the spike and wave [41] and in the number of channels that showed SWDs [19]. Our observations are different: there were no SWDs observed outside of behavioral arrest in any animal in approximately 25 days of recordings/rat (~1 hr/day, n=10). Although there was inter-animal variation in spike-wave oscillations, there was remarkable intra-animal consistency from one day to the next (Fig. 3). Each animal exhibited a slightly different pattern of spike-wave oscillations across all channels and it was almost identical from one SWD to the next (Fig. 3).
In our cohort, the frequency of SWDs was typically 7–8 Hz (mean: 7.6 ± 0.2 Hz; range: 6.8–8.5 Hz; n=9; Fig. 4,5). This frequency was very consistent from day to day (data not shown) and independent of sex (females, 7.5 ± 0.2 Hz, n=6; males, 7.7 ± 0.2 Hz, n=3; Student’s t-test, p=0.742). These frequencies are closer to type I (7–8 Hz) than type II SWDs (<7 Hz; [41]) and lower than mu rhythm [15, 20]. In summary, the data suggest that type I SWDs were observed primarily in our cohort, and SWDs were unlikely to be related to mu rhythm.
Figure 4. Hippocampal neuronal activity during SWDs.

A. An example of a SWD is shown.
B. The boxed area of A is shown with greater temporal resolution. Below the left FC trace is the same recording after filtering at 250–500 Hz. Similarly, the HC recording is shown from B and then below it is the same recording after filtering at 250–500 Hz. Arrows point to examples of high frequency oscillations (>250 Hz) in the hippocampus that occur at the same time as the spike of the spike-wave pattern. The results suggest that there are high frequency oscillations of hippocampal principal cells.
C. SWD frequencies during spontaneous episodes of behavioral arrest are plotted in relation to the frequencies of hippocampal theta rhythm, recorded during spontaneous periods of exploration. For a given animal, its SWD frequency and its theta frequency are used for each point in the graph. One animal is excluded because theta rhythm was not robust in the hippocampal recordings, most likely because the tips of the electrodes were not in an optimal layer [45].
Figure 5. SWDs are longer in duration when head movement occurs.
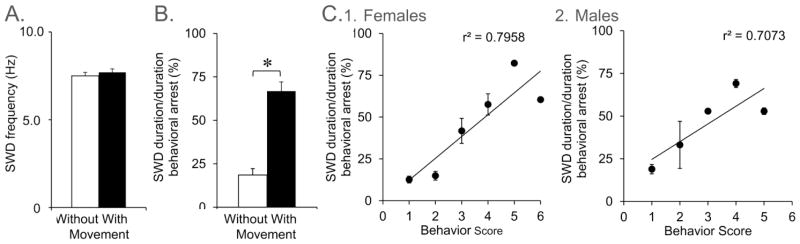
A. SWD frequency was determined for SWDs with movement and without movement. Movement included small head movements (e.g., head nodding and mastications) that accompanied frozen posture. Frequency was similar regardless of movements that occurred during SWDs (n=9; Student’s t-test, p>0.05).
B. Animals were divided into those that showed head movement during SWDs and those that did not exhibit detectable head movement. The duration of SWDs, expressed as a percentage of time in behavioral arrest, was greatest in animals that exhibited movement (p<0.05). To assess SWDs similarly in all animals, the first two minutes of behavioral arrest in a given recording session was used.
C. There was a correlation between SWD duration (defined as described in A-B) and movement of the head in females (1; n=5) and males (2; n=3). Movements were scored as follows: 1, no movement; 2, movement of the nose; 3, vigorous movement of nose and vibrissae; 4, lowering the head to the floor; 5, head bobbing; 6, head lowering with head bobbing. Two animals are excluded because they were not scored.
Environmental effects on SWDs
Similar to previous reports [42–44], SWDs appeared to vary with the environment of animals. In previous studies environmental influences did not include housing during early life (although development has been suggested to play a role; [44]). Therefore, it is notable that we report here a potential facilitatory effect of housing, especially early in life, on SWDs. Thus, rats that were housed in an environment with more light than normal developed SWDs (24 hrs of dim light and a 15hr: 9 hr light: dark cycle) developed SWDs (3/3; 100%). The environment was used for housing during mating, gestation, and for at least the first 3 weeks of postnatal life. In contrast, when the environment had a 12hr: 12hr light: dark cycle, rats did not exhibit SWDs - although there were 2 notable exceptions: these 2 rats were moved to the environment with atypical lighting after weaning (2/19 or 10.5% rats). Animals were also examined after receipt from a vendor where environment was standard (12 hr: 12 hr light: dark cycle, n=13). Of those animals, SWDs were not detected – except for one rat (1/13 or 7.7%) that was housed in the environment with atypical lighting after arrival. The differences between animals bred in the atypical environment and standard environment were significant (χ2 test, p=0.029).
Hippocampal recordings during SWDs
Next we examined the hippocampal recordings during SWDs more closely. As shown in Figure 3, the hippocampal recordings during SWDs were sometimes similar to seizure-like activity. This activity in hippocampal recordings during SWDs could have been due to volume conduction from thalamus/cortex. However, filtering the hippocampal recordings (250–500 Hz) showed that high frequency oscillations were present in hippocampus at the peaks of the spike component of epidural cortical recordings (Fig. 4). The high frequency of the oscillations in the hippocampal recordings suggest that action potentials of hippocampal neurons occurred at that time. The cortical recordings did not exhibit the high frequency oscillations (Fig. 4B), although a direct comparison is difficult because cortical electrodes were epidural screws, unlike hippocampal electrodes, which were Teflon-coated wires inserted into hippocampus. The 250–500 Hz hippocampal oscillations were synchronized with the spikes of SWDs recorded with cortical screws (Fig. 4B). These data suggest hippocampal neurons were active during SWDs and hippocampal EEG fluctuations during SWDs were not due to volume conduction. They also suggest that SWDs could be mistaken for repetitive high frequency oscillations in limbic epilepsy models.
As would be expected in the rat, animals exhibited theta oscillations in most hippocampal electrodes during exploration. (When they did not, we assume that the electrode tip was in a layer such as stratum radiatum, where theta oscillations are normally less prominent than other layers, such as stratum lacunosum-moleculare; [45]). Interestingly, the SWD frequency of a given animal was almost exactly the same as its frequency of theta rhythm, determined from the hippocampal electrode of the same animal (Fig. 4C). This is interesting in light of the fact that theta power in hippocampus has been suggested to increase in animals with seizures [46]. Our data suggest that theta power could increase because of SWDs, not necessarily any hippocampal theta activity.
Behaviors during SWDs
Although the body was immobile when SWDs occurred, sometimes there were subtle movements of the head, such as head bobbing. Previous studies have described these and other movements during SWDs, including mastications [1]. All 10 animals with SWDs (7 female, 3 male) had these movements during some periods of behavioral arrest, but the degree that these movements were present during behavioral arrest varied from animal to animal. It should be noted that the mastications were modest compared to chewing rat chow, because the latter is accompanied by large EEG artifacts of the facial muscle movements (data not shown).
SWDs appeared to be longer in duration when there was head movement. To quantify the relationship between SWD and movement of the head, periods of behavioral arrest during the first 4–6 consecutive days of recording were analyzed. When there was no movement of the head during the period of behavioral arrest, 18.5 ± 3.7% of the period of behavioral arrest was accompanied by SWDs; when behavioral arrest was accompanied by head movement, 66.8 ± 5.3% of this time was accompanied by SWDs (n=9; Student’s t-test, p<0.001; Fig. 5). One male rat was not included because there were no SWDs in the first week of recordings, probably because it was young (~3 months old).
In Figure 5, a behavioral scale was used that was more detailed and a single investigator rated behavior to keep scoring as consistent as possible. Score 1 reflected no movement of the head; Score 2 was movement of the nose; Score 3 was associated with vigorous movement of nose and vibrissae; Score 4 was used for lowering of the head to the floor; Score 5 was associated with head bobbing; Score 6 was defined as head lowering with head bobbing. As shown in Figure 5, the duration of behavioral arrest that was accompanied by SWDs increased as the behavioral rating increased, and this occurred in both females and males.
SWDs in the pilocarpine model of TLE
These observations suggest that normal Sprague-Dawley rats can exhibit SWDs. However, it might be doubted that SWD would develop in animal models of TLE where stage 1–2 limbic seizures occur, because there is typically extensive neuronal damage and other changes in neurons, glia and the vasculature in thalamus, hippocampus and cortex. Damage could block the oscillations by killing the neurons mediating them or modifying the ion channels critical to their generation. In fact, in animals with photothrombosis, SWDs declined [23].
To clarify whether SWD would occur in an animal model of epilepsy, we examined a common animal model of TLE, the pilocarpine model. In this model, SE is induced by pilocarpine and then in the subsequent weeks/months, spontaneous recurrent seizures develop. Most studies of this model use male rats; we used females, and modified the methods to induce SE with improved mortality, which in the past has been severe in females [31]. In these rats, SE was induced, animals were allowed 4 weeks until implantation, and then 1 week after implantation for recovery from surgery. Afterwards, they were recorded in the morning for approximately 1 hr to capture spontaneous periods of behavioral arrest. Recordings occurred 5–7 days/week for at least 3 weeks. As shown in Figure 6, spontaneous SWDs occurred in 8 of 10 rats after pilocarpine-induced SE, and 4/6 rats that had pilocarpine-induced seizures, but not SE. In Figure 6C the groups are compared to naïve female rats. The number of rats with SWDs out of all rats tested was significantly different between the groups (one-way ANOVA; p=0.005; Fig. 6C). The frequencies of the spike-wave oscillations were not distinguishable, however (p>0.05; Fig 6D). Therefore, SWDs do occur in the pilocarpine model, at least in female Sprague-Dawley rats, under the conditions used here, and SWDs are increased in incidence relative to naïve rats.
Figure 6. SWDs are increased in rats after pilocarpine-induced seizures.

A–B.
A. A recording from a rat during behavioral arrest after pilocarpine-induced SE. The boxed area is expanded in B as indicated by the arrow. Calibration, 250 μV (A); 500 μV (B).
C. The percent of animals with SWDs are shown for the naïve rats (same data as Fig. 1), rats that had pilocarpine but did not have SE (“pilocarpine”) and rats that had pilocarpine and SE in the subsequent hrs (“pilocarpine + SE”). Differences were significant (Fisher’s exact test, p=0.005).
D. The frequencies of spike-wave oscillations were not different among the groups (p>0.05).
DISCUSSION
Summary
The present study supports previous observations of SWDs in Sprague-Dawley rats [1, 23]. We also found housing influences SWDs, which extends the list of developmental or environmental factors that influence SWDs [1, 42, 44]. Furthermore, the results suggest that the hippocampus can actively participate in SWDs. Neuronal activity appears to occur at a frequency similar to high frequency oscillations and SWD rhythmicity occurs at a frequency similar to hippocampal theta rhythm. Finally, we showed that SWDs increase after pilocarpine-induced SE in female rats. Therefore, when animals are frozen in limbic epilepsy models, and the EEG shows oscillations at theta frequency, the potential that the hippocampal EEG reflects SWDs should be considered.
SWDs occur in a subset of normal adult rats
Our observations of SWDs were limited to a subset of Sprague-Dawley rats at ages 2–6 months. The small sample limits our conclusions. However, it was clear that the SWDs we observed were similar in many ways to other studies of SWDs. For example, the behaviors associated with SWDs in our rats were similar to previous studies of SWDs in rodents, where the primary behavior is a frozen stance [11, 12, 34, 47]. Animals appeared to be unresponsive in our experiments, but were aroused from SWDs by touch or a noise, similar to other studies of SWDs in rodents [32]. Ethosuximide blocked SWDs, as shown by others [20, 33–39]. The frequency of SWDs in our rats was similar others [1, 11, 12, 17, 48]. However, we did not obtain evidence for type II SWDs [40, 41].
Environmental influences on SWDs
It has previously been reported that Sprague Dawley male rats that are >12 months-old have a high incidence of SWDs (>70%; [1]. In one study SWDs were found between between 3 and 9 months of age; these animals received a sham procedure to compare with a photothrombotic lesion [18]. Here we show that females can exhibit SWDs at 2–3 months of age and males can exhibit SWDs at 6–7 months of age. In these animals, atypical lighting appeared to facilitate SWDs. The role of the light:dark cycle in SWDs already has support from studies where animals were housed in constant light. In a genetic model of absence epilepsy, females exposed to constant light exhibited more SWDs [49]. Constant light also has been studied extensively in female rodents without EEG recordings, and it has been documented that constant light disrupts the estrous cycle and serum hormone levels [50–52]. Differences in light:dark cycles also exert effects on the estrous cycle and associated aspects of reproductive function [53, 54], which may influence the brain. In our subjects, the light:dark cycle was not completely stopped, and estrous cycles were not blocked (data not shown). However, there still could have been alterations in the serum hormone levels. For example, disruption of the light:dark cycle could influence levels of corticosterone, which is potentially important because altered levels of corticosterone exacerbate SWDs in WAG/Rij rats [55]. The results suggest an influence of sex on SWDs. These data are consistent with sex differences in SWDs in Wag/Rij rats, where rats exhibit SWDs after puberty [12]. They are also consistent with human data, where absence epilepsy is more common in females [6, 8].
Hippocampal activity during SWDs
SWDs have been recorded in the thalamus [1, 20, 56] as well as the hippocampus [13], but it is not always clear whether EEG recordings showing rhythmic activity in hippocampal electrodes simply reflect volume conduction from thalamus. In dorsal hippocampus of the rat, this is likely because the hippocampus is located directly above anterior thalamus and below many areas of neocortex. Our results suggest that hippocampal principal cells could be actively involved in SWDs because high frequency oscillations occurred in hippocampus during the spikes of SWDs recorded in epidural cortical electrodes. The results agree with other observations of hippocampal activity during SWDs and bold fMRI [4] but disagree with recordings from some preparations during absence seizures, where hippocampal activity can be minimal [4].
A related point is that the frequency of theta oscillations in hippocampus was virtually identical to the SWD frequency of the animal. This correlation suggests that the generator of theta could be related to the generator of SWDs. This is surprising because the generation of SWDs is typically explained by interactions between thalamocortical relay cells, corticothalamic neurons, and the GABAergic neurons of the reticular nucleus of the thalamus [7]. That network is not considered to be the one that generates theta oscillations in hippocampus. Instead, the ascending cholinergic systems and intrinsic circuitry in hippocampus are thought to play important roles in the generation of theta rhythm in hippocampus and modulate SWDs [57–60]. One explanation is that the ascending cholinergic systems are responsible both for cholinergic control of hippocampal theta oscillations and cholinergic modulation of SWDs, so in any given animal there is similarity between theta frequency and SWD frequency. Whatever the mechanism, the strong relationship we observed suggests that mechanisms underlying theta and SWD generation could be related.
Relevance to animal models of TLE
In animal models of TLE, an early life insult or injury is typically used to induce a gradual change in the brain, and weeks or months later there are spontaneous recurrent seizures (epilepsy). The animal is often considered to have a limbic seizure if there is freezing, because Racine published a scale that is widely used for classifying seizures that include this behavior [27]. That scale was based on seizures that have their initial signs as freezing behavior, and become progressively more severe (involve more movements of the body) during amygdala kindling [27]. An important caveat is that normal rats have freezing behavior when they pause after exploring their environment.
We suggest that some animals with behavioral arrest after an early life insult or injury may have SWDs and not a stage 1–2 seizure. Furthermore, any rhythmic activity in hippocampus that might be recorded at the same time as the freezing behavior could reflect the indirect involvement of hippocampus in SWDs, not a seizure generated in hippocampus. If the hippocampal rhythmic activity occurs at 7–12 Hz, SWDs would seem likely. If high frequency oscillations are detected, and they repeat at 7–12 Hz, they could be related to SWDs. These considerations would become increasingly important with increasing age after the initial insult, which is notable because in some animal models of TLE, the time when epilepsy is examined is after 3 months of age, when SWDs emerge in male Sprague-Dawley rats. Therefore, one could mistakenly conclude an emerging “epilepsy” exists when an animal actually is exhibiting the onset of spontaneous SWDs with age. Fortunately, several methods can be used to dissociate stage 1–2 limbic seizures from SWDs (see last section, below).
It is important to consider that there may be SWDs in animals that undergo SE. Therefore, even in an animal where SWDs may not be expected, such as an animal that is intended to simulate limbic epilepsy, SWDs could occur. Indeed, there are interactions between thalamus and hippocampus in animal models of TLE and an important role of the thalamus in TLE has been proposed [61–66].
The functional significance of SWDs
It has been suggested that SWDs are a normal neurobiological oscillation which has important functions, not a seizure. The argument is that the subset of rats with SWDs have genetic epilepsy, and SWDs are seizures. These arguments have been discussed elsewhere [67, 68].
If SWDs are normal, what would their function be? One suggestion is that SWDs facilitate the processing of sensory input, an idea that is based on the finding that sensory input is acquired during SWDs [17] and that action potential discharge is facilitated at that time [69]. Another possibility is that SWDs have the opposite function - they interrupt sensory input and in so doing, facilitate intrinsic information processing within cortical networks. This idea is analogous to the proposal of Hasselmo regarding the influence of weak cholinergic states on cortical circuits: there is a decrease in the strength of afferent input and increase in intrinsic feedback circuitry at the same time [70]. In support of the idea that SWDs disrupt sensory input to cortical networks, animals do appear to be unresponsive during SWDs, even if underlying sensory input can be acquired [17, 32, 71]. An interesting, related interpretation comes from recordings in primary sensory (gustatory) cortex, where an early ~11 Hz rhythm occurs which is critical to an initial phase of sensory processing, and this is followed by a second ~7 Hz rhythm that is also important, but associated with decreased arousal [48]. SWDs may be analogous to that secondary rhythm, with a critical but secondary role in processing sensory information. Another proposed function of SWDs is that they are a ‘resetting’ device for the brain to return it to a more normal state, which is important as it ages and excitability increases [72].
It is also possible that SWDs have an important function related to hippocampus. They could interrupt the normal mechanisms of memory consolidation that occur in that region during behavioral arrest. Thus, it has been proposed that hippocampal sharp waves (SPWs), large spikes that occur in the hippocampal EEG which emerge during behavioral arrest and sleep, are important to consolidate the information that was recently encoded during exploration [73, 74]. Given that SWDs block or mask hippocampal SPWs during behavioral arrest, SWDs potentially modulate SPWs and therefore hippocampal-dependent memory consolidation. While this proposal for a ‘normal’ function of SWDs is consistent with the lack of SPWs during SWDs, the data in Figure 1D suggest that it is not a complete explanation, because no SPWs were revealed when ethosuximide blocked SWDs.
Methods to address SWDs in animal models of TLE
Regardless of one’s view of the functional significance of SWDs, the fact that the species has SWDs is important for individuals who study TLE and use rats for their animal model. For investigators who do not use electrodes but simply view behavior to evaluate possible seizures using the Racine scale, one cannot assume that freezing behavior is a seizure. Controls are critical. Animal models of traumatic brain injury or animal models where aged animals are used are particularly important to address with controls because aging male Sprague-Dawley rats have a high incidence of SWDs and males are the sex that is most commonly used in TLE research.
Fortunately there are ways to circumvent the potential confounds of SWDs. One is to control lighting and age: standard lighting, and males younger than 6 months of age (preferably younger than 3 months, in light of our findings) decrease the likelihood of SWDs. The benefits of attention to controls is reflected in the study of Kelly et al. [23] who showed that both control and lesioned male rats experienced SWDs after photothrombosis; their careful analysis showed that lesioned animals did not develop SWDs more than controls. In contrast, D’Ambrosio et al. showed that male Sprague-Dawley rats developed stage 1–2 behaviors and rhythmic EEG activity after fluid-percussive injury, but not controls [75–77].
One method to address SWDs is to filter the EEG record between 7–12 Hz. If power is high in this band during freezing behavior, interpretations require caution. Kelly et al. show used quantitative methods along these lines to show changes in power at 7–8 Hz [78]. However, these methods depend on electrodes that are positioned in the locations where they can detect SWDs. It is important to recognize that recordings in only 1–2 locations may miss focal SWDs or suggest SWDs are focal when they actually are generalized [78]. In the current study, for example, we could have missed focal SWDs because our recording positions were not sufficiently close to the locations where focal SWDs occurred.
If recordings are not possible, there are other methods that can be useful: epilepsy can be judged on the basis of stage 3–5 behaviors. This approach has drawbacks, however, because “mild” epilepsy (without stage 3–5 behaviors) would have the potential for misinterpretation because freezing could be unaccompanied by seizures and without electrodes an investigator would not know. Only the types of epilepsy with the most severe convulsive behavior are straightforward to interpret, if there are no EEG recordings simultaneous to behavior.
Conclusions
The results support the idea that all rat strains have some predisposition to SWDs in adulthood and serve as a warning to investigators who study animal models of TLE that their animals may develop behavioral arrest with rhythmic spiking normally. Fortunately, there are steps that can be taken to address this concern.
Figure 2. SWD patterns vary across animals but are consistent within each animal.
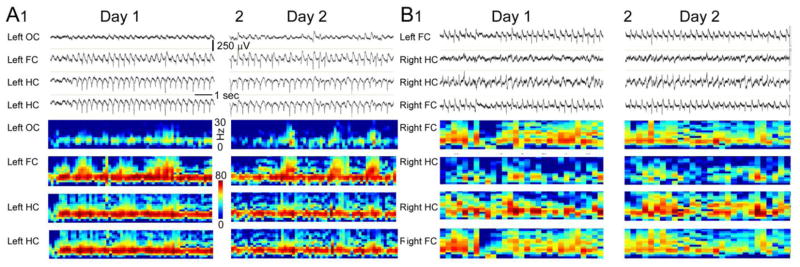
A. EEG (top) and spectrogram (bottom) for two consecutive days of recording from a naïve female rat. For A and B, only 4 of the 8 channels used for the recording are shown.
B. Same as A, but recordings were from a different rat. The calibrations are the same as in A.
Highlights.
Spike-wave discharges (SWDs) accompanied by behavioral arrest were observed in subset of adult rats
SWDs were similar in many ways to previously-described SWDs in rats
Behaviors during SWDs were similar to stage 1–2 seizures on the Racine scale
Filtered data suggest that hippocampal neurons discharged during some SWDs
SWDs were observed in female rats after pilocarpine-induced seizures
Using hippocampal recordings alone, SWDs could appear to stage 1–2 limbic seizures
Acknowledgments
We thank Dr. Erika Fanselow for discussion and Vanessa Skucas for technical assistance. Support was provided by NIH (NS-37562 and NS-064474), the New York State Department of Health, and a Natural Sciences and Engineering Research Council of Canada Discovery Grant 197293-2007.
Footnotes
Publisher's Disclaimer: This is a PDF file of an unedited manuscript that has been accepted for publication. As a service to our customers we are providing this early version of the manuscript. The manuscript will undergo copyediting, typesetting, and review of the resulting proof before it is published in its final citable form. Please note that during the production process errors may be discovered which could affect the content, and all legal disclaimers that apply to the journal pertain.
References
- 1.Buzsáki G, Laszlovszky I, Lajtha A, Vadasz C. Spike-and-wave neocortical patterns in rats: genetic and aminergic control. Neuroscience. 1990;38:323–33. doi: 10.1016/0306-4522(90)90031-x. [DOI] [PubMed] [Google Scholar]
- 2.Steriade M. Neuronal substrates of spike-wave seizures and hypsarrhythmia in corticothalamic systems. Adv Neurol. 2006;97:149–54. [PubMed] [Google Scholar]
- 3.Huguenard JR, McCormick DA. Thalamic synchrony and dynamic regulation of global forebrain oscillations. Trends Neurosci. 2007;30:350–6. doi: 10.1016/j.tins.2007.05.007. [DOI] [PubMed] [Google Scholar]
- 4.Blumenfeld H. Cellular and network mechanisms of spike-wave seizures. Epilepsia. 2005;46 (Suppl 9):21–33. doi: 10.1111/j.1528-1167.2005.00311.x. [DOI] [PubMed] [Google Scholar]
- 5.Avoli M. A brief history on the oscillating roles of thalamus and cortex in absence seizures. Epilepsia. 2012;53:779–89. doi: 10.1111/j.1528-1167.2012.03421.x. [DOI] [PMC free article] [PubMed] [Google Scholar]
- 6.Crunelli V, Leresche N. Childhood absence epilepsy: genes, channels, neurons and networks. Nat Rev Neurosci. 2002;3:371–82. doi: 10.1038/nrn811. [DOI] [PubMed] [Google Scholar]
- 7.Destexhe A, McCormick DA, Sejnowski TJ. Thalamic and thalamocortical mechanisms underlying 3 Hz spike-and-wave discharges. Prog Brain Res. 1999;121:289–307. doi: 10.1016/s0079-6123(08)63080-0. [DOI] [PubMed] [Google Scholar]
- 8.Janz D. The idiopathic generalized epilepsies of adolescence with childhood and juvenile age of onset. Epilepsia. 1997;38:4–11. doi: 10.1111/j.1528-1157.1997.tb01073.x. [DOI] [PubMed] [Google Scholar]
- 9.Niedermeyer E. Primary (idiopathic) generalized epilepsy and underlying mechanisms. Clin Electroencephalogr. 1996;27:1–21. doi: 10.1177/155005949602700103. [DOI] [PubMed] [Google Scholar]
- 10.Porter RJ. The absence epilepsies. Epilepsia. 1993;34 (Suppl 3):S42–8. doi: 10.1111/j.1528-1167.1993.tb06258.x. [DOI] [PubMed] [Google Scholar]
- 11.Marescaux C, Vergnes M, Depaulis A. Genetic absence epilepsy in rats from Strasbourg--a review. J Neural Transm Suppl. 1992;35:37–69. doi: 10.1007/978-3-7091-9206-1_4. [DOI] [PubMed] [Google Scholar]
- 12.Coenen AM, Van Luijtelaar EL. Genetic animal models for absence epilepsy: a review of the WAG/Rij strain of rats. Behav Genet. 2003;33:635–55. doi: 10.1023/a:1026179013847. [DOI] [PubMed] [Google Scholar]
- 13.Semba K, Komisaruk BR. Neural substrates of two different rhythmical vibrissal movements in the rat. Neuroscience. 1984;12:761–74. doi: 10.1016/0306-4522(84)90168-4. [DOI] [PubMed] [Google Scholar]
- 14.Semba K, Szechtman H, Komisaruk BR. Synchrony among rhythmical facial tremor, neocortical ‘alpha’ waves, and thalamic non-sensory neuronal bursts in intact awake rats. Brain Res. 1980;195:281–98. doi: 10.1016/0006-8993(80)90065-7. [DOI] [PubMed] [Google Scholar]
- 15.Shaw FZ. Is spontaneous high-voltage rhythmic spike discharge in Long Evans rats an absence-like seizure activity? J Neurophysiol. 2004;91:63–77. doi: 10.1152/jn.00487.2003. [DOI] [PubMed] [Google Scholar]
- 16.Willoughby JO, Mackenzie L. Nonconvulsive electrocorticographic paroxysms (absence epilepsy) in rat strains. Lab Anim Sci. 1992;42:551–4. [PubMed] [Google Scholar]
- 17.Wiest MC, Nicolelis MA. Behavioral detection of tactile stimuli during 7–12 Hz cortical oscillations in awake rats. Nat Neurosci. 2003;6:913–4. doi: 10.1038/nn1107. [DOI] [PubMed] [Google Scholar]
- 18.Kelly KM, Shiau DS, Jukkola PI, Miller ER, Mercadante AL, Quigley MM, Nair SP, Sackellares JC. Effects of age and cortical infarction on EEG dynamic changes associated with spike wave discharges in F344 rats. Exp Neurol. 2011;232:15–21. doi: 10.1016/j.expneurol.2011.07.004. [DOI] [PMC free article] [PubMed] [Google Scholar]
- 19.Kharlamov EA, Jukkola PI, Schmitt KL, Kelly KM. Electrobehavioral characteristics of epileptic rats following photothrombotic brain infarction. Epilepsy Res. 2003;56:185–203. doi: 10.1016/j.eplepsyres.2003.09.005. [DOI] [PubMed] [Google Scholar]
- 20.Shaw FZ. 7–12 Hz high-voltage rhythmic spike discharges in rats evaluated by antiepileptic drugs and flicker stimulation. J Neurophysiol. 2007;97:238–47. doi: 10.1152/jn.00340.2006. [DOI] [PubMed] [Google Scholar]
- 21.Inoue M, Peeters BW, van Luijtelaar EL, Vossen JM, Coenen AM. Spontaneous occurrence of spike-wave discharges in five inbred strains of rats. Physiol Behav. 1990;48:199–201. doi: 10.1016/0031-9384(90)90285-c. [DOI] [PubMed] [Google Scholar]
- 22.Jando G, Carpi D, Kandel A, Urioste R, Horvath Z, Pierre E, Vadi D, Vadasz C, Buzsaki G. Spike-and-wave epilepsy in rats: sex differences and inheritance of physiological traits. Neuroscience. 1995;64:301–17. doi: 10.1016/0306-4522(94)00329-4. [DOI] [PubMed] [Google Scholar]
- 23.Kelly KM, Kharlamov A, Hentosz TM, Kharlamova EA, Williamson JM, Bertram EH, 3rd, Kapur J, Armstrong DM. Photothrombotic brain infarction results in seizure activity in aging Fischer 344 and Sprague Dawley rats. Epilepsy Res. 2001;47:189–203. doi: 10.1016/s0920-1211(01)00294-7. [DOI] [PubMed] [Google Scholar]
- 24.Kleinlogel H. Spontaneous EEG paroxysms in the rat: effects of psychotropic and alpha-adrenergic agents. Neuropsychobiology. 1985;13:206–13. doi: 10.1159/000118189. [DOI] [PubMed] [Google Scholar]
- 25.Robinson PF, Gilmore SA. Spontaneous generalized spike-wave discharges in the electrocorticograms of albino rats. Brain Res. 1980;201:452–8. doi: 10.1016/0006-8993(80)91052-5. [DOI] [PubMed] [Google Scholar]
- 26.Pitkanen A, Schwartzkroin PA, Moshe SL. Models of seizures and epilepsy. San Diego, CA: Elseivier; 2006. [Google Scholar]
- 27.Racine RJ. Modification of seizure activity by electrical stimulation. II. Motor seizure. Electroencephalogr Clin Neurophysiol. 1972;32:281–94. doi: 10.1016/0013-4694(72)90177-0. [DOI] [PubMed] [Google Scholar]
- 28.Scharfman HE, Sollas AL, Smith KL, Jackson MB, Goodman JH. Structural and functional asymmetry in the normal and epileptic rat dentate gyrus. J Comp Neurol. 2002;454:424–39. doi: 10.1002/cne.10449. [DOI] [PMC free article] [PubMed] [Google Scholar]
- 29.Scharfman HE, Goodman JH, Sollas AL. Granule-like neurons at the hilar/CA3 border after status epilepticus and their synchrony with area CA3 pyramidal cells: functional implications of seizure-induced neurogenesis. J Neurosci. 2000;20:6144–58. doi: 10.1523/JNEUROSCI.20-16-06144.2000. [DOI] [PMC free article] [PubMed] [Google Scholar]
- 30.Skucas VA, Duffy AM, Harte-Hargrove LC, Magagna-Poveda A, Radman T, Chakraborty G, Schroeder CE, MacLusky NJ, Scharfman HE. Testosterone depletion in adult male rats increases mossy fiber transmission, LTP, and sprouting in area CA3 of hippocampus. J Neurosci. 2013;33:2338–55. doi: 10.1523/JNEUROSCI.3857-12.2013. [DOI] [PMC free article] [PubMed] [Google Scholar]
- 31.Scharfman HE, Malthankar-Phatak GH, Friedman D, Pearce P, McCloskey DP, Harden CL, Maclusky NJ. A rat model of epilepsy in women: a tool to study physiological interactions between endocrine systems and seizures. Endocrinology. 2009;150:4437–42. doi: 10.1210/en.2009-0135. [DOI] [PMC free article] [PubMed] [Google Scholar]
- 32.Drinkenburg WH, Schuurmans ML, Coenen AM, Vossen JM, van Luijtelaar EL. Ictal stimulus processing during spike-wave discharges in genetic epileptic rats. Behav Brain Res. 2003;143:141–6. doi: 10.1016/s0166-4328(03)00031-7. [DOI] [PubMed] [Google Scholar]
- 33.Julien RM, Fowler GW, Danielson MG. The effects of antiepileptic drugs on estrogen-induced electrographic spike-wave discharge. J Pharmacol Exp Ther. 1975;193:647–56. [PubMed] [Google Scholar]
- 34.Sasa M, Ohno Y, Ujihara H, Fujita Y, Yoshimura M, Takaori S, Serikawa T, Yamada J. Effects of antiepileptic drugs on absence-like and tonic seizures in the spontaneously epileptic rat, a double mutant rat. Epilepsia. 1988;29:505–13. doi: 10.1111/j.1528-1157.1988.tb03754.x. [DOI] [PubMed] [Google Scholar]
- 35.Coulter DA, Huguenard JR, Prince DA. Specific petit mal anticonvulsants reduce calcium currents in thalamic neurons. Neurosci Lett. 1989;98:74–8. doi: 10.1016/0304-3940(89)90376-5. [DOI] [PubMed] [Google Scholar]
- 36.Nehlig A, Vergnes M, Marescaux C, Boyet S. Cerebral energy metabolism in rats with genetic absence epilepsy is not correlated with the pharmacological increase or suppression of spike-wave discharges. Brain Res. 1993;618:1–8. doi: 10.1016/0006-8993(93)90421-i. [DOI] [PubMed] [Google Scholar]
- 37.Huguenard JR, Prince DA. Intrathalamic rhythmicity studied in vitro: nominal T-current modulation causes robust antioscillatory effects. J Neurosci. 1994;14:5485–502. doi: 10.1523/JNEUROSCI.14-09-05485.1994. [DOI] [PMC free article] [PubMed] [Google Scholar]
- 38.Zhang YF, Gibbs JW, 3rd, Coulter DA. Anticonvulsant drug effects on spontaneous thalamocortical rhythms in vitro: ethosuximide, trimethadione, and dimethadione. Epilepsy Res. 1996;23:15–36. doi: 10.1016/0920-1211(95)00079-8. [DOI] [PubMed] [Google Scholar]
- 39.Cortez MA, McKerlie C, Snead OC., 3rd A model of atypical absence seizures: EEG, pharmacology, and developmental characterization. Neurology. 2001;56:341–9. doi: 10.1212/wnl.56.3.341. [DOI] [PubMed] [Google Scholar]
- 40.Sarkisova KY, Kuznetsova GD, Kulikov MA, van Luijtelaar G. Spike-wave discharges are necessary for the expression of behavioral depression-like symptoms. Epilepsia. 2010;51:146–60. doi: 10.1111/j.1528-1167.2009.02260.x. [DOI] [PubMed] [Google Scholar]
- 41.van Luijtelaar EL, Coenen AM. Two types of electrocortical paroxysms in an inbred strain of rats. Neurosci Lett. 1986;70:393–7. doi: 10.1016/0304-3940(86)90586-0. [DOI] [PubMed] [Google Scholar]
- 42.Schridde U, van Luijtelaar G. The influence of strain and housing on two types of spike-wave discharges in rats. Genes Brain Behav. 2004;3:1–7. doi: 10.1111/j.1601-1848.2004.00034.x. [DOI] [PubMed] [Google Scholar]
- 43.Schridde U, van Luijtelaar G. The role of the environment on the development of spike-wave discharges in two strains of rats. Physiol Behav. 2005;84:379–86. doi: 10.1016/j.physbeh.2004.12.015. [DOI] [PubMed] [Google Scholar]
- 44.Vadasz C, Carpi D, Jando G, Kandel A, Urioste R, Horvath Z, Pierre E, Vadi D, Fleischer A, Buzsaki G. Genetic threshold hypothesis of neocortical spike-and-wave discharges in the rat: an animal model of petit mal epilepsy. Am J Med Genet. 1995;60:55–63. doi: 10.1002/ajmg.1320600111. [DOI] [PubMed] [Google Scholar]
- 45.Buzsaki G, Czopf J, Kondakor I, Kellenyi L. Laminar distribution of hippocampal rhythmic slow activity (RSA) in the behaving rat: current-source density analysis, effects of urethane and atropine. Brain Res. 1986;365:125–37. doi: 10.1016/0006-8993(86)90729-8. [DOI] [PubMed] [Google Scholar]
- 46.Sharma SK, Dakshinamurti K. Seizure activity in pyridoxine-deficient adult rats. Epilepsia. 1992;33:235–47. doi: 10.1111/j.1528-1157.1992.tb02312.x. [DOI] [PubMed] [Google Scholar]
- 47.Zouhar A, Mares P, Liskova-Bernaskova K, Mudrochova M. Motor and electrocorticographic epileptic activity induced by bicuculline in developing rats. Epilepsia. 1989;30:501–10. doi: 10.1111/j.1528-1157.1989.tb05332.x. [DOI] [PubMed] [Google Scholar]
- 48.Tort AB, Fontanini A, Kramer MA, Jones-Lush LM, Kopell NJ, Katz DB. Cortical networks produce three distinct 7–12 Hz rhythms during single sensory responses in the awake rat. J Neurosci. 2010;30:4315–24. doi: 10.1523/JNEUROSCI.6051-09.2010. [DOI] [PMC free article] [PubMed] [Google Scholar]
- 49.Smyk MK, Coenen AM, Lewandowski MH, van Luijtelaar G. Endogenous rhythm of absence epilepsy: relationship with general motor activity and sleep-wake states. Epilepsy Res. 2011;93:120–7. doi: 10.1016/j.eplepsyres.2010.11.003. [DOI] [PubMed] [Google Scholar]
- 50.Schwartz SM. Effects of constant bright illumination on reproductive processes in the female rat. Neurosci Biobehav Rev. 1982;6:391–406. doi: 10.1016/0149-7634(82)90049-5. [DOI] [PubMed] [Google Scholar]
- 51.Shirama K. Induction of persistent estrus by constant light: effects of neonatal constant light and Harderian gland function. Neuroendocrinology. 1978;27:193–203. doi: 10.1159/000122812. [DOI] [PubMed] [Google Scholar]
- 52.Watts AG, Fink G. Effects of short-term constant light on the proestrous luteinizing hormone surge and pituitary responsiveness in the female rat. Neuroendocrinology. 1981;33:176–80. doi: 10.1159/000123225. [DOI] [PubMed] [Google Scholar]
- 53.Yochim JM, Shirer HW. Evidence for a photoperiod-sensitive pacemaker for estrous cycle of the rat. Am J Physiol. 1981;241:E261–7. doi: 10.1152/ajpendo.1981.241.3.E261. [DOI] [PubMed] [Google Scholar]
- 54.Hagino N, Sako T, Nakamoto O, Kunz Y, Saito H. Prevention of continuous light-induced anovulation in rats by early exposure to continuous light. Biol Reprod. 1983;29:355–61. doi: 10.1095/biolreprod29.2.355. [DOI] [PubMed] [Google Scholar]
- 55.Mohawk JA, Pargament JM, Lee TM. Circadian dependence of corticosterone release to light exposure in the rat. Physiol Behav. 2007;92:800–6. doi: 10.1016/j.physbeh.2007.06.009. [DOI] [PMC free article] [PubMed] [Google Scholar]
- 56.Vergnes M, Marescaux C, Depaulis A, Micheletti G, Warter JM. Spontaneous spike and wave discharges in thalamus and cortex in a rat model of genetic petit mal-like seizures. Exp Neurol. 1987;96:127–36. doi: 10.1016/0014-4886(87)90174-9. [DOI] [PubMed] [Google Scholar]
- 57.Lee MG, Chrobak JJ, Sik A, Wiley RG, Buzsaki G. Hippocampal theta activity following selective lesion of the septal cholinergic system. Neuroscience. 1994;62:1033–47. doi: 10.1016/0306-4522(94)90341-7. [DOI] [PubMed] [Google Scholar]
- 58.Buzsaki G, Bickford RG, Armstrong DM, Ponomareff G, Chen KS, Ruiz R, Thal LJ, Gage FH. Electric activity in the neocortex of freely moving young and aged rats. Neuroscience. 1988;26:735–44. doi: 10.1016/0306-4522(88)90095-4. [DOI] [PubMed] [Google Scholar]
- 59.Smythe JW, Colom LV, Bland BH. The extrinsic modulation of hippocampal theta depends on the coactivation of cholinergic and GABA-ergic medial septal inputs. Neurosci Biobehav Rev. 1992;16:289–308. doi: 10.1016/s0149-7634(05)80203-9. [DOI] [PubMed] [Google Scholar]
- 60.Teitelbaum H, Lee JF, Johannessen JN. Behaviorally evoked hippocampal theta waves: a cholinergic response. Science. 1975;188:1114–6. doi: 10.1126/science.175440. [DOI] [PubMed] [Google Scholar]
- 61.Sloan DM, Bertram EH., 3rd Changes in midline thalamic recruiting responses in the prefrontal cortex of the rat during the development of chronic limbic seizures. Epilepsia. 2009;50:556–65. doi: 10.1111/j.1528-1167.2008.01790.x. [DOI] [PubMed] [Google Scholar]
- 62.Sloan DM, Zhang D, Bertram EH., 3rd Excitatory amplification through divergent-convergent circuits: the role of the midline thalamus in limbic seizures. Neurobiol Dis. 2011;43:435–45. doi: 10.1016/j.nbd.2011.04.017. [DOI] [PMC free article] [PubMed] [Google Scholar]
- 63.Sloan DM, Zhang D, Bertram EH., 3rd Increased GABAergic inhibition in the midline thalamus affects signaling and seizure spread in the hippocampus-prefrontal cortex pathway. Epilepsia. 2011;52:523–30. doi: 10.1111/j.1528-1167.2010.02919.x. [DOI] [PMC free article] [PubMed] [Google Scholar]
- 64.Kubova H, Druga R, Lukasiuk K, Suchomelova L, Haugvicova R, Jirmanova I, Pitkanen A. Status epilepticus causes necrotic damage in the mediodorsal nucleus of the thalamus in immature rats. J Neurosci. 2001;21:3593–9. doi: 10.1523/JNEUROSCI.21-10-03593.2001. [DOI] [PMC free article] [PubMed] [Google Scholar]
- 65.Narkilahti S, Pirttila TJ, Lukasiuk K, Tuunanen J, Pitkanen A. Expression and activation of caspase 3 following status epilepticus in the rat. Eur J Neurosci. 2003;18:1486–96. doi: 10.1046/j.1460-9568.2003.02874.x. [DOI] [PubMed] [Google Scholar]
- 66.Immonen R, Kharatishvili I, Grohn O, Pitkanen A. MRI biomarkers for post-traumatic epileptogenesis. J Neurotrauma. 2013;30:1305–9. doi: 10.1089/neu.2012.2815. [DOI] [PMC free article] [PubMed] [Google Scholar]
- 67.Kelly KM. Spike-wave discharges: absence or not, a common finding in common laboratory rats. Epilepsy Curr. 2004;4:176–7. doi: 10.1111/j.1535-7597.2004.04503.x. [DOI] [PMC free article] [PubMed] [Google Scholar]
- 68.Stafstrom CE. Neurons do the wave (and the spike!) during neocortical seizures. Epilepsy Curr. 2005;5:69–71. doi: 10.1111/j.1535-7597.2005.05208.x. [DOI] [PMC free article] [PubMed] [Google Scholar]
- 69.Fanselow EE, Sameshima K, Baccala LA, Nicolelis MA. Thalamic bursting in rats during different awake behavioral states. Proc Natl Acad Sci U S A. 2001;98:15330–5. doi: 10.1073/pnas.261273898. [DOI] [PMC free article] [PubMed] [Google Scholar]
- 70.Hasselmo ME. The role of acetylcholine in learning and memory. Curr Opin Neurobiol. 2006;16:710–5. doi: 10.1016/j.conb.2006.09.002. [DOI] [PMC free article] [PubMed] [Google Scholar]
- 71.Nicolelis MA, Fanselow EE. Dynamic shifting in thalamocortical processing during different behavioural states. Philos Trans R Soc Lond B Biol Sci. 2002;357:1753–8. doi: 10.1098/rstb.2002.1175. [DOI] [PMC free article] [PubMed] [Google Scholar]
- 72.Nair SP, Jukkola PI, Quigley M, Wilberger A, Shiau DS, Sackellares JC, Pardalos PM, Kelly KM. Absence Seizures as Resetting Mechanisms of Brain Dynamics. Cybern Syst Anal. 2008;44:664–672. doi: 10.1007/s10559-008-9051-7. [DOI] [PMC free article] [PubMed] [Google Scholar]
- 73.Buzsaki G. Hippocampal sharp waves: their origin and significance. Brain Res. 1986;398:242–52. doi: 10.1016/0006-8993(86)91483-6. [DOI] [PubMed] [Google Scholar]
- 74.Buzsaki G. Two-stage model of memory trace formation: a role for “noisy” brain states. Neuroscience. 1989;31:551–70. doi: 10.1016/0306-4522(89)90423-5. [DOI] [PubMed] [Google Scholar]
- 75.Curia G, Levitt M, Fender JS, Miller JW, Ojemann J, D’Ambrosio R. Impact of injury location and severity on posttraumatic epilepsy in the rat: role of frontal neocortex. Cereb Cortex. 2011;21:1574–92. doi: 10.1093/cercor/bhq218. [DOI] [PMC free article] [PubMed] [Google Scholar]
- 76.D’Ambrosio R, Fender JS, Fairbanks JP, Simon EA, Born DE, Doyle DL, Miller JW. Progression from frontal-parietal to mesial-temporal epilepsy after fluid percussion injury in the rat. Brain. 2005;128:174–88. doi: 10.1093/brain/awh337. [DOI] [PMC free article] [PubMed] [Google Scholar]
- 77.D’Ambrosio R, Fairbanks JP, Fender JS, Born DE, Doyle DL, Miller JW. Post-traumatic epilepsy following fluid percussion injury in the rat. Brain. 2004;127:304–14. doi: 10.1093/brain/awh038. [DOI] [PMC free article] [PubMed] [Google Scholar]
- 78.Kelly KM, Jukkola PI, Kharlamov EA, Downey KL, McBride JW, Strong R, Aronowski J. Long-term video-EEG recordings following transient unilateral middle cerebral and common carotid artery occlusion in Long-Evans rats. Exp Neurol. 2006;201:495–506. doi: 10.1016/j.expneurol.2006.05.006. [DOI] [PubMed] [Google Scholar]