Abstract
Background
Glioblastoma multiforme (GBM) is the most aggressive form of human brain tumor. It was previously shown that high levels of laminin-8 expression were a predictor of tumor recurrence and patient survival. It is thus important to elucidate the mechanism by which laminin-8 expression is regulated and determine how this contributes to glioma progression. This study investigated the mechanism of regulation of LAMB1, which encodes the β1 chain of laminin-8, in glioma cells lines and in a mouse model of GBM.
Methods
The expression levels of LAMB1 and miR-124-5p were examined in glioma cell lines (U87 and U251) and GBM tissue samples by quantitative PCR and Western blotting. The potential regulation of LAMB1 by miR-124-5p was investigated by assessing the effects of restored miR-124-5p expression on cell proliferation, colony formation, and tumor growth and angiogenesis. The effects of inhibiting LAMB1 on tumor growth and angiogenesis were also assessed.
Results
The upregulation of LAMB1 expression was highly correlated with the downregulation of miR-124-5p. LAMB1 protein expression was suppressed by miR-124-5p. The restoration of miR-124-5p expression suppressed glioma growth by inhibiting angiogenesis, effects that were also observed upon LAMB1 knockdown.
Conclusions
The findings indicate that miR-124-5p functions as a tumor suppressor and could serve as a molecular marker for glioma diagnosis and as a potential therapeutic target in GBM treatment.
Keywords: glioma, laminin-8, LAMB1, miR-124-5p
Glioblastoma multiforme (GBM) is the most frequently occurring malignant brain tumor in adults. Despite treatment strategies that combine neurosurgery, radiotherapy, and chemotherapy, the median patient survival is 14.6 months,1 underscoring the aggressive growth properties of GBM. High-grade gliomas are highly vascular tumors that typically recur even after complete surgical excision. GBM is characterized by endothelial cell proliferation and prominent vascularization2,3 arising from a combination of blood vessel co-option and tumor angiogenesis,4,5 the latter being a fundamental aspect of tumor growth, invasion, and metastasis.
Laminins are a family of large, extracellular, heterotrimeric basement membrane (BM) glycoproteins.6,7 Members of this family have a tissue-specific distribution as a result of the combinatorial diversity of laminin α, β, and γ chains.8 Laminins have important roles in many fundamental biological processes including embryogenesis, tumor invasion, tissue differentiation, and wound healing.9 Laminin-8 (α4β1γ1) is the predominant isoform expressed in vascular endothelial cell BMs.10–12 Along with its receptor integrin α6β1, laminin-8 has been shown to be important for BM function and the maintenance of the blood-brain barrier.13,14 Low expression levels of the α4 chain containing laminin-9 were observed in capillary BMs in the normal human brain. During the progression of human gliomas to GBM, the expression of capillary BM laminins containing the α4 chain is upregulated, and laminin-9 (α4β2γ1) expression is supplanted by laminin-8 (α4β1γ1),15 which is distinguished by having a β1 subunit. The factors regulating the switch to laminin β1 expression in gliomas are still unknown.
The microRNA (miRNA) miR-124 is abundantly expressed in the embryonic and adult cortex in various mammalian species,16,17 suggesting an essential role in normal functioning of the brain. Indeed, expression profiling of various human brain tumors has shown that miR-124 is among the most dramatically downregulated miRNAs in brain neoplasias. Overexpression of miR-124 can lead to cell cycle arrest in human glioma cells18 and inhibit cell migration and invasion.19 MiR-124-3p (known as miR-124 or miR-124a) and miR-124-5p (known as miR-124*) are both mature forms of miR-124 (A putative miR-124-5p binding site in the 3'UTR of LAMB1 was mutated by replacing the cytosine with guanine [marked by an asterisk]. *P < .05; **P < .01). Restoring miR-124 expression in gliomas may slow tumor progression by repressing various miR-124 targets such as laminin γ1 and integrin β1.19–25 Based on the reduced miR-124-5p expression and high levels of laminin β1 protein that were observed in GBM cell lines and tissues, the present work investigated the potential regulation of laminin β1 by miR-124-5p. The effects of miR-124-5p overexpression and LAMB1 knockdown on cell proliferation, colony formation, and tumor growth and angiogenesis were also assessed in glioma cell lines to verify a possible interaction between these 2 factors. The results revealed the posttranscriptional, negative regulation of LAMB1 by miR-124-5p and the importance of this association in the regulation of angiogenesis in GBM. These findings suggested that miR-124-5p could represent a potential target for therapeutic strategies designed to inhibit the progression of gliomas to GBM.
Materials and Methods
Cell Lines, Tissue Samples, miRNA Oligonucleotides, and siRNA Oligonucleotides
Human glioma cell lines (U87 and U251) were cultured in high-glucose Dulbecco's Modified Eagle's Medium (DMEM; Gibco) supplemented with 10% (v/v) heat-inactivated fetal bovine serum (Gibco) at 37°C in an atmosphere of 5% CO2. Glioma tissue samples were obtained through Zhujiang Hospital (Guangzhou, China). The study was approved by the Zhujiang Hospital Institutional Review Board, and written informed consent was obtained from all patients prior to sample collection. Each sample was morphologically evaluated according to the World Health Organization26 and Daumas-Duport et al.27 classification of brain tumors. A miR-124-5p mimic and miRNA mimic negative control (NC) were used to examine the effects of miR-124-5p overexpression, while an miR-124-5p inhibitor and miRNA inhibitor negative control (NC inhibitor) were used to test the effects of miR-124-5p loss of function. Several siRNAs (siRNA-LAMB1-996, siRNA-LAMB1-1608, siRNA-LAMB1-3492, and siRNA-LAMB1-4125) targeting different regions of the LAMB1 gene (Table 1) were used, along with an siRNA negative control (siRNA-NC).
Table 1.
Sequences of miRNAs and siRNAs used in this study
| Sequence |
||
|---|---|---|
| Sense 5′-3′ | Antisense 5′-3′ | |
| miR-124-5p mimic | 5′-CGUGUUCACAGCGGACCUUGAU-3′ | 5′-AUCAAGGUCCGCUGUGAACACG-3′ |
| miR-124-5p inhibitor | 5′-AUCAAGGUCCGCUGUGAACACG-3′ | |
| miRNA mimic negative control | 5′-UUCUCCGAACGUGUC ACGUTT-3′ | 5′-ACGUGACACGUUCGGAGAATT-3′ |
| miRNA inhibitor negative control | 5′-UUGUACUACACAAAAGUA CUG-3′ | |
| siRNA NC | 5′-UUCUCCGAACGUGUCACGUTT-3′ | 5′-ACGUGACACGUUCGGAGAATT-3′ |
| siRNA-LAMB1-996 | 5′-GUGUCGGUGUAAAUUAAAUTT-3′ | 5′-AUUUAAUUUACACCGACACTT-3′ |
| siRNA-LAMB1-1608 | 5′-GUGUCGGUGUAAAUUAAAUTT-3′ | 5′-AUUUAAUUUACACCGACACTT-3′ |
| siRNA-LAMB1-3492 | 5′-GUGCUUGUGUCUUCCUAAUTT-3′ | 5′-AUUAGGAAGACACAAGCACTT-3′ |
| siRNA-LAMB1-4125 | 5′-GGCUCAAGUAGAAGUGAAATT-3′ | 5′-UUUCACUUCUACUUGAGCCTT-3′ |
Quantitative Polymerase Chain Reaction
Total RNA was prepared using the Trizol reagent (Invitrogen) according to the manufacturer's instructions. Expression of miR-124-5p and U6 snRNA (internal control) was quantitated using an ABI 7500 Real-Time PCR system (Applied Biosystems) and a TaqMan MicroRNA assay kit (Applied Biosystems). The expression level of miR-124-5p in each sample was normalized to the level of U6 snRNA. Quantiative PCR (qPCR) of LAMB1 and β-actin (internal control) mRNA was performed using the ABI 7500 Real-Time PCR System and a QuantiTect SYBR Green PCR Kit (Qiagen). LAMB1 expression level in each sample was normalized to the level of β-actin. All experiments were performed in duplicate. The primers used for qPCR are shown in Table 2.
Table 2.
Primers used for quantitative PCR
| Primer set | Sequence/assay ID | Target Gene |
|---|---|---|
| qmiR-124-5p | 002197, ABI | hsa-miR-124-5p (MIMAT0004591) |
| qU6 snRNA | 001973, ABI | U6 snRNA (NR_004394) |
| qLAMB1 | 5′-TGGCTGAAGTGGAACAGCTCTC-3′ | Laminin, beta 1(NM_002291) |
| 5′-TGTCTTCAACAGAATGTCTTCAGCA-3′ | ||
| qβ-actin | 5′-TGGCACCCAGCACAATGAA–3′ | Actin, beta (NM_001101 ) |
| 5′-CTAAGTCATAGTCCGCCTAGAAGCA-3′ |
Western Blot Analysis
For total protein extraction, cells were lysed in Laemmli buffer and quantified using a Bio-Rad Protein Assay Kit I (Bio-Rad), and 50 μg of protein were resolved by 10% SDS-PAGE following standard procedures. All antibodies were purchased from Santa Cruz Biotechnology, unless otherwise indicated. Primary antibodies against laminin β-1 (sc-17810; 1:200) and β-actin (sc-130301; 1:500) were used, along with a goat anti-mouse IgG-HRP secondary antibody (sc-2005; 1:2500). After incubation with the second antibody, the nitrocellulose membranes were treated with enhanced chemiluminescent light detection reagent (PerkinElmer). Immunoreactive bands were visualized by Fluorchem SP Gel Imaging System (Alpha Innotech) and quantified using AlphaEase software. β-actin was included as a loading control. All extracts were prepared in duplicate, and at least 3 independent experiments were conducted.
Luciferase Reporter Assay
Recombinant vectors harboring LAMB1 3′ untranslated region (UTR) sequences with wild-type (WT) or mutated (MUT) miR-124-5p binding sites were generated as follows. Total RNA was isolated from normal (ie, non-neoplastic) brain tissue using Trizol reagent. cDNA was generated using the PrimeScript RT-PCR Kit (Takara Bio Inc.). The WT and MUT LAMB1 3′ UTR were PCR-amplified from the cDNA template with the appropriate primer set (Table 3) and cloned into the XhoI/NotI site of the psiCHECK-2 vector (Promega) to generate psiCHECK-2-WT LAMB1 3′ UTR and psiCHECK-2-MUT LAMB1 3′ UTR. Cells were cotransfected with either miR-124-5p mimic, NC, miR-124-5p inhibitor, or NC inhibitor (50 nM) along with psi-CHECK2-WT LAMB1 3′ UTR or psi-CHECK2-MUT LAMB1 3′ UTR (500 ng). After 48 hours, firefly and Renilla luciferase activities were measured using the dual-luciferase assay (Promega). Three independent experiments were performed.
Table 3.
Primers used to generate LAMB1 3′ UTR reporter constructs
| Primer | Sequence | REN | Reporter Construct |
|---|---|---|---|
| WT-F | 5′-CCGCTCGAGCAGAGGAGAATAAAAAATGGCTGAGGTGAACAAGG-3′ | XhoI | psi-CHECKTM-2-WT LAMB1 3′UTR |
| WT-R | 5′-ATAAGAATGCGGCCGCATACAAAAGCACTGTACT-3′ | NotI | |
| MUT-F | 5′-CCGCTCGAGCAGAGGAGAATAAAAAATGGCTGAGGTGAAGAAGG-3′ | XhoI | psi-CHECKTM-2-MUT LAMB1 3′UTR |
| MUT-R | 5′-ATAAGAATGCGGCCGCATACAAAAGCACTGTACT-3′ | NotI |
Cell Proliferation and Cell Cycle Analyses
Cell proliferation was assessed using the MTT assay. Cells were plated at 2 × 10³ cells/well on 96-well plates. At 0, 24, 48, 72, and 96 hours, 20 μL MTT (5 mg/mL) was added to each well, followed by incubation for 4 hours at 37°C. The cells were then subcultured in medium containing 100 μL dimethyl sulfoxide. The absorbance of each well was determined at 492 nm. Cell cycle analysis was performed by propidium iodide staining and fluorescence-activated cell sorting analysis (BD FACS Calibur, BD Biosciences). All experiments were performed in duplicate and repeated twice.
Transwell Cell Migration Assay
BD Falcon 8-µm pore inserts (BD Biosciences) were coated with Matrigel (BD Biosciences) and placed in a 12-well plate containing 1 mL complete DMEM (lower chamber). Serum-starved cells were trypsinized and counted, and 0.5 mL cell suspensions were added to the coated inserts (1 × 10⁵ cells per well) (upper chamber) and incubated at 37°C for 24 hours. The cells were fixed by submerging the inserts in 4% paraformaldehyde in phosphate-buffered saline (PBS) and counterstained with cresyl violet (Sigma-Aldrich). Cells that had not migrated were removed from the top side of the membrane with moistened cotton swabs. Air-dried membranes were cut out of the inserts, mounted on microscope slides, and examined using an Imager upright fluorescence microscope (Olympus). Cells from 6 randomly selected fields were counted. All experiments were performed in duplicate and repeated twice.
Glioblastoma Xenografts
U87 and U251 cells were harvested, washed with PBS, and resuspended in normal culture medium at a concentration of 1 × 10⁷ cells/mL. Immunocompromised nu/nu mice (4 weeks old) were injected with 5 × 10⁶ viable cells mixed with Matrigel to establish a GBM model. Animals were routinely monitored for general health and tumor formation. Once tumors reached a volume of 150–200 mm3, mice were randomly assigned to one of 4 treatment groups: miR-124-5p mimic, NC, siRNA targeting LAMB1 gene, and siRNA-NC (n = 6 tumors per group). RNA oligonucleotides were prepared in Lipofectamine RNAiMAX (Invitrogen) according to the manufacturer's instructions. The oligonucleotides (1 optical density) were injected twice a week for 3 weeks into a xenograft tumor in 3 different locations. Tumor volumes were monitored every 3 to 4 days, and mice were euthanized and their tumors removed upon termination of the experiment. Pieces of each tumor were immediately fixed in 10% paraformaldehyde in PBS for paraffin embedding or flash-frozen in liquid nitrogen for frozen sections, RNA preparation, or Western blot analysis.
Immunohistochemistry
Paraffin-embedded tumor tissue samples were cut into 5-μm sections on a microtome (RM2235; Leica). Immunohistochemical staining was performed according to standard procedures. Slides were blocked with 10% goat serum at 26°C for 30 minutes and incubated with primary antibody directed against LAMB1 (1:50) at 4°C overnight. The following day, after washes with PBS, the slides were incubated in goat anti-mouse secondary antibody (P0447; Dako). After PBS washes, the slides were incubated with diaminobenzidine (K3467; Dako), and the colorimetric reaction was closely monitored under a light microscope. After the reaction was terminated, sections were briefly counterstained with hematoxylin, then dehydrated, mounted, and examined using an Imager upright fluorescence microscope (Olympus).
Determination of Microvessel Density
The flash-frozen tissue block was covered with cryoembedding medium, then immediately submerged in liquid nitrogen and stored at −80°C. Frozen sections were cut at a thickness of 5 μm using a cryostat and collected onto glass slides, which were stored at −80°C until processing. Immunofluorescence staining was performed according to standard procedures. Slides were blocked with 10% goat serum at 26°C for 30 minutes and incubated with primary antibody (1:100) generated against the endothelial marker CD31 (MEC 13.3, 557355, Rat (LEW) IgG2a, κ; BD Pharmingen), washed in PBS, and then incubated with FITC-conjugated goat anti-rat secondary antibody (554016; BD Pharmingen; 1:100), followed by washes in PBS. The sections were counterstained with 4’,6-diamidino-2-phenylindole, mounted on glass slides, and examined using a fluorescence microscope. To determine microvessel density, microvessels in 10 high-magnification fields (200×), (randomly selected in each section) were counted, and the data were expressed as mean number of microvessels per field.
Statistical Analysis
Comparisons between 2 groups were made using a paired sample t test, and one-way ANOVA was used to compare 3 or more experimental groups. Correlations between miR-124-5P expression and LAMB1 mRNA or protein expression were determined by rank correlation analysis. All data are presented as mean ± standard deviation. P < .05 was considered statistically significant unless otherwise indicated.
Results
LAMB1 Expression Is Upregulated in High-grade Gliomas
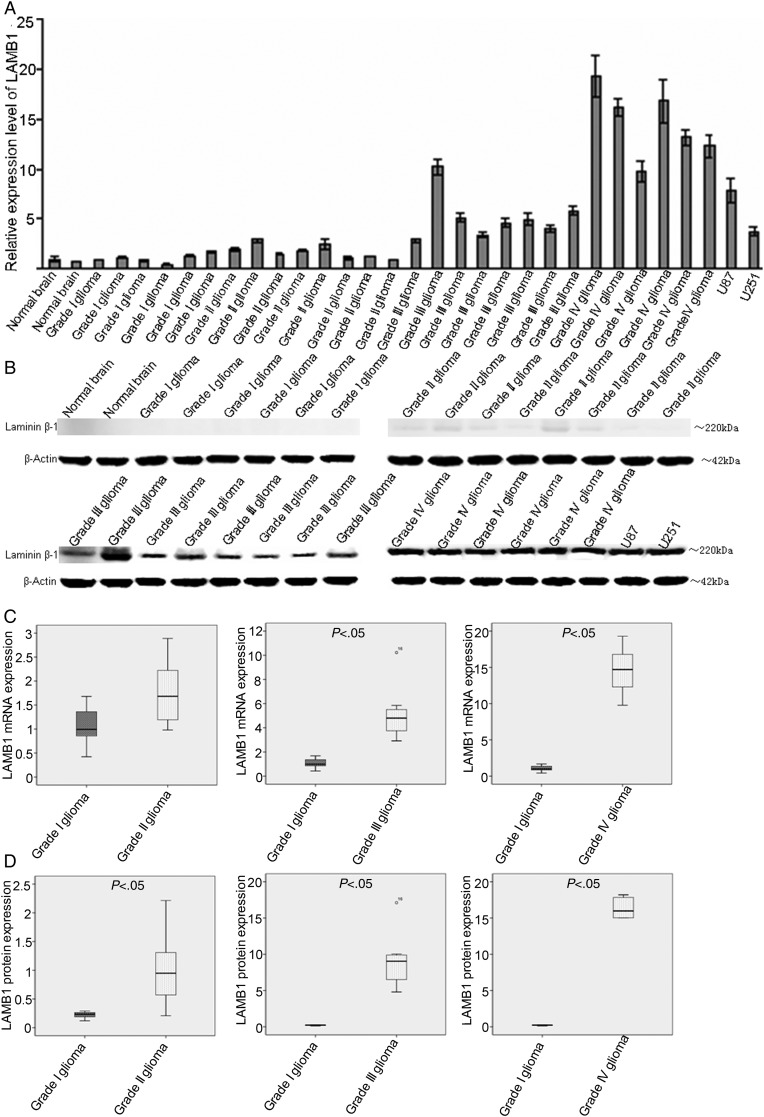
A switch from laminin-9 to laminin-8 expression, which involves the substitution of the β2 subunit with LAMB1, is associated with a gradual increase in laminin expression from low (in low-grade gliomas) to high (in GBMs), as well as neovascularization, which likely contribute to tumor aggressiveness.28 It is therefore useful to monitor the changes in expression of LAMB1 during the progression of gliomas. LAMB1 mRNA and protein expression levels were assessed by qPCR and Western blotting, respectively, in U87 and U251 cells, normal human brain tissue, grade I/II gliomas, anaplastic astrocytomas (AAs;, i.e, grade III gliomas), and GBMs (ie, grade IV gliomas). AA and GBM tissues showed significantly higher levels of LAMB1 mRNA and protein relative to normal brain tissue, and grade I/II gliomas, and GBM tissues had the highest level of LAMB1 gene expression (Fig. 1A and B). Progressive increases in the levels of LAMB1 mRNA and protein were observed with increasing glioma severity (Fig. 1C and D).
Fig. 1.
Upregulation of LAMB1 expression in high-grade gliomas. LAMB1 expression was determined by (A) quantitative PCR, and (B) Western blotting in normal brain tissues, glioma tissues (grades I–IV), and glioma cell lines (U251 and U87). (C and D) Normalized LAMB1 mRNA and protein expression in gliomas (grades I–IV) and normal brain tissue. β-actin was used as a loading control. Data are shown as mean ± SD.
MiR-124-5p is Downregulated in High-grade Gliomas
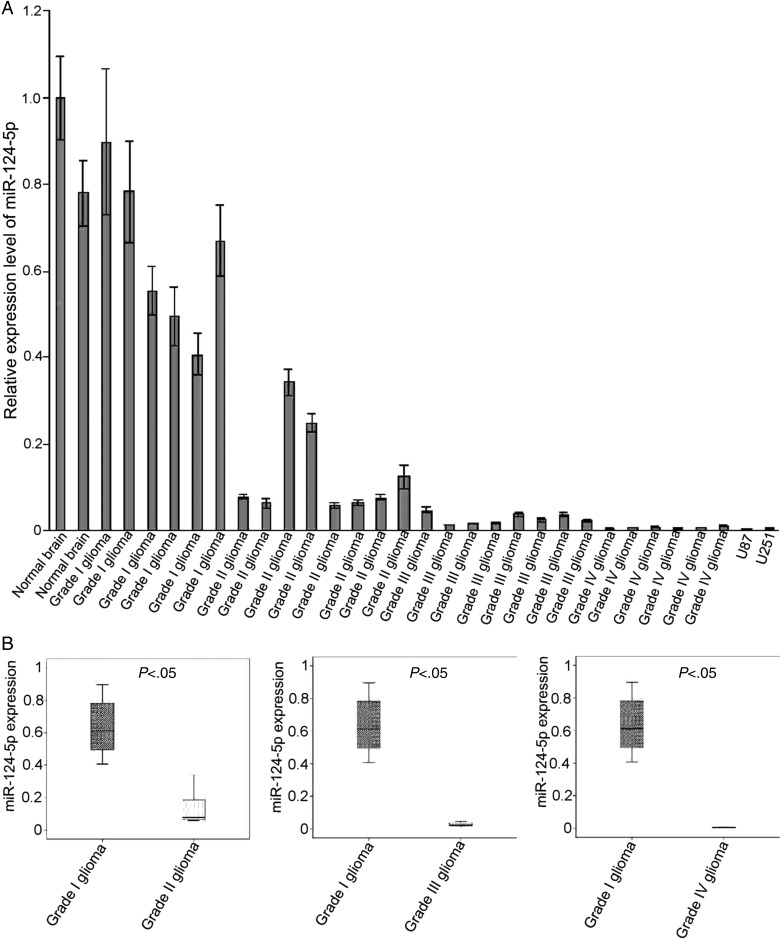
MiR-124-3p is downregulated in high-grade gliomas,18,19 but it is not known whether the same is true for miR-124-5p. The expression levels of miR-124-5p in U87 and U251 cells, normal human brain tissue, grade I/II gliomas, AAs, and GBMs were analyzed by qPCR. A significant decrease in miR-124-5p expression was observed in AAs and GBMs compared with normal brains and grade I/II gliomas (Fig. 2A). These data demonstrated that miR-124-5p expression was significantly downregulated during glioma progression (Fig. 2B).
Fig. 2.
Downregulation of miR-124–5p expression in high-grade gliomas. (A) MiR-124-5p expression was determined by quantitative PCR in normal brain tissues, glioma tissues (grades I–IV), and glioma cell lines (U251 and U87). (B) Normalized miR-124-5p expression in gliomas (grades I–IV) and normal brain tissue. U6 was included as an internal control. Data are shown as mean ± SD.
MiR-124-5p Regulates LAMB1 Expression at the Posttranscriptional Level
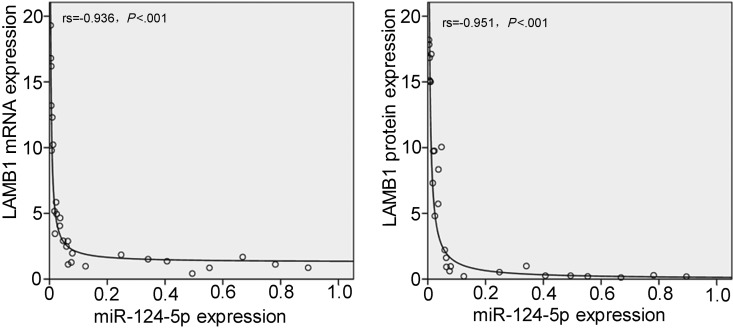
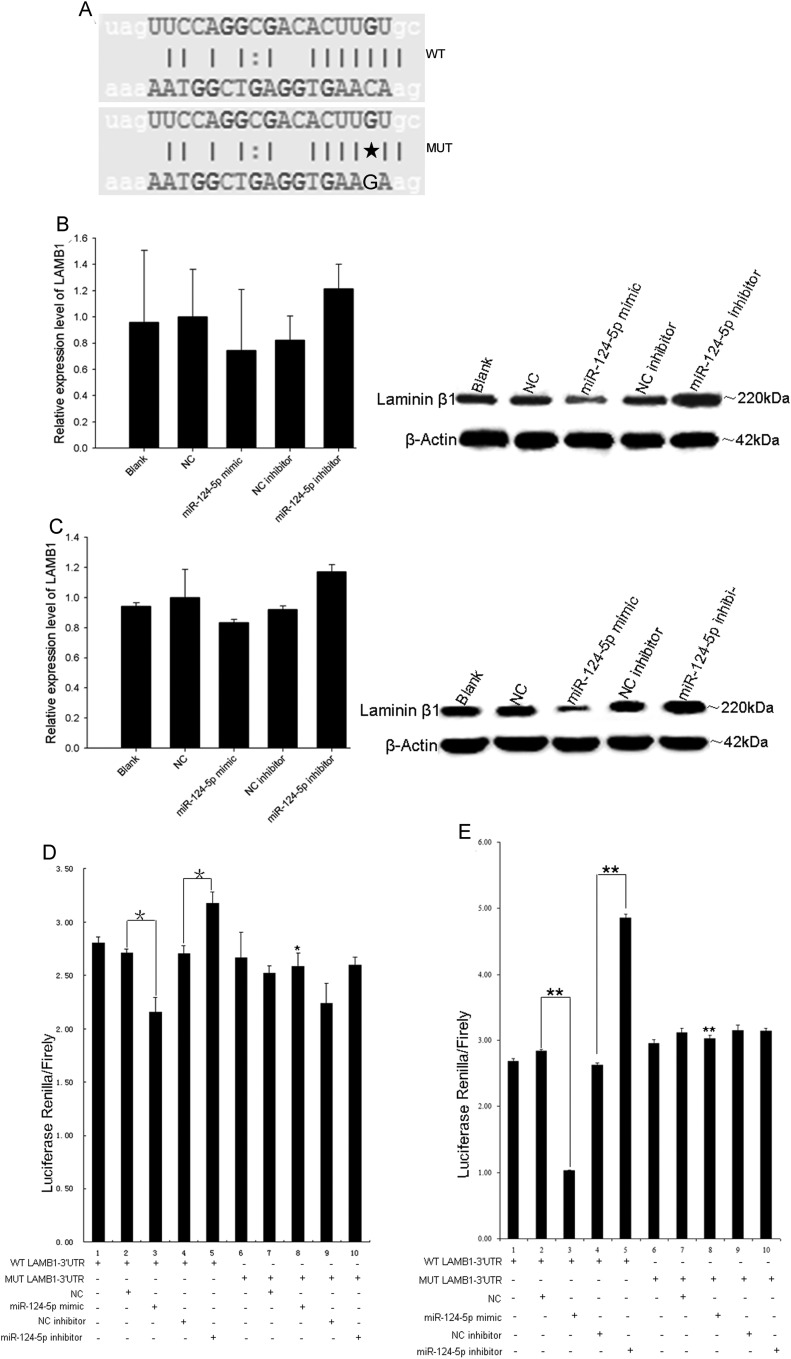
It was interesting to note that glioma progression was associated with the downregulation of miR-124-5p and the upregulation of LAMB1 protein levels, suggesting that these factors dictate the degree of tumor malignancy. Rank correlations calculated between miR-124-5P expression level and LAMB1 mRNA or protein levels indicated that elevated LAMB1 mRNA (rs = −0.936, P < .001) or protein (rs = −0.951, P < .001) expression occurred concomitantly with reduced miR-124-5p expression (Fig. 3). An in silico analysis using MicroCosm Targets Version 5 (http://www.ebi.ac.uk/enright-srv/microcosm/htdocs/targets/v5/) revealed a potential miR-124-5p binding site in the 3′ UTR of LAMB1 (Fig. 4A). To test whether LAMB1 mRNA is a bona fide target of miR-124-5p, miR-124-5p was overexpressed in U87 and U251 cells by transfecting a miR-124-5p mimic and NC or was suppressed in these cells by transfecting the miR-124-5p inhibitor and miRNA NC inhibitor. After 72 hours, LAMB1 protein expression was reduced in cells overexpressing miR-124-5p compared with NC-transfected cells (Fig. 4B and C). Furthermore, suppression of miR-124-5p resulted in higher levels of LAMB1 protein compared with cells transfected with NC inhibitor (Fig. 4B and C). Significantly, the levels of LAMB1 mRNA were unaffected by miR-124-5p overexpression or inhibition. To confirm that LAMB1 is a direct target of miR-124-5p regulation, reporter constructs containing a LAMB1 3′ UTR with WT or MUT miR-124-5p binding sites downstream of the luciferase gene were used to transfect U87 (Fig. 4D) or U251 (Fig. 4E) cells along with the miR-124-5p mimic or NC. A decrease in luciferase activity was observed in cells cotransfected with the WT LAMB1 3′ UTR and the miR-124-5p mimic compared with cells cotransfected with the WT LAMB1 3′ UTR and the NC, or with the MUT LAMB1 3′ UTR and miR-124-5p mimic. In contrast, cells cotransfected with the WT LAMB1 3′UTR and miR-124-5p inhibitor showed an increase in luciferase activity compared with cells cotransfected with the WT LAMB1 3′ UTR and NC inhibitor. Taken together, these results provide evidence that LAMB1 (protein) expression is directly and negatively regulated by miR-124-5p.
Fig. 3.
Inverse correlation between miR-124-5p and LAMB1 expression in GBM. Correlations between miR-124-5P expression and LAMB1 mRNA or protein expression were assessed by rank correlation.
Fig. 4.
Posttranscriptional regulation of LAMB1 by miR-124-5p. (A) A putative miR-124-5p binding site in the 3′ UTR of LAMB1 was mutated by replacing the cytosine with guanine (marked by an asterisk). (B and C) LAMB1 mRNA and protein expression in U87 and U251 cells cotransfected with the wild-type (WT) or mutated (MUT) LAMB1 3′ UTR, along with miR-124-5p mimic, miRNA mimic negative control (NC), miR-124-5p inhibitor, or miRNA inhibitor negative control (NC inhibitor), as determined by quantitative PCR (left) and Western blotting (right). (D and E) Normalized luciferase activity in U87 and U251 cells cotransfected with the WT or MUT LAMB1 3′ UTR, along with miR-124-5p mimic, NC, miR-124-5p inhibitor, or NC inhibitor as determined using the dual-luciferase reporter assay system. Data are shown as mean ± SD. *P < .05; **P < .01.
Restoration of miR-124-5p Expression in Glioma Cells Inhibits Tumor Growth
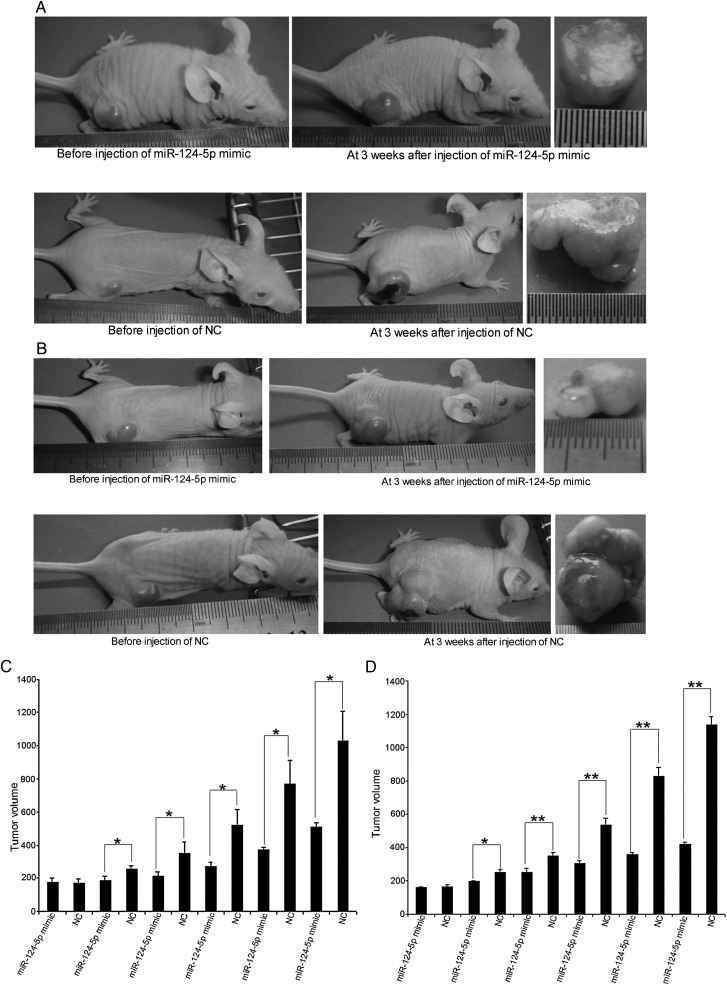
To determine whether miR-124-5p functions as a tumor suppressor, the effect of restoring miR-124-5p expression in glioma cells on tumor growth was assessed. Immunocompromised nu/nu mice were injected with U87 or U251 cells to induce tumor formation. The tumors were injected with miR-124-5p mimic or NC. A significant growth inhibition of U87 (Fig. 5A) and U251 (Fig. 5B) xenograft tumors injected with miR-124-5p mimic was observed, compared with tumors injected with the NC. The mean tumor volume for tumors injected with miR-124-5p mimic was 511.23 ± 26.92 mm3 (U87) or 419.58 ± 9.96 mm3 (U251) compared with 1028.87 ± 178.43 mm3 (U87) or 1136.36 ± 51.45 mm3 (U251) for tumors injected with the NC (Fig. 5C and D; P < .05).
Fig. 5.
Growth inhibition of glioma xenografts after restoration of miR-124-5p expression. Tumors induced in immunocompromised nu/nu mice were injected with miR-124-5p mimic or miRNA mimic negative control (NC) for 3 weeks. (A and B) Growth of U87 or U251 xenografts was assessed at the beginning and end of the experiment. (C and D) Volume of U87 or U251 xenografts was measured every 3 to 4 days. Data are shown as mean ± SD. *P < .05; **P < .01.
Microvessel Density in Glioma Xenografts Is Reduced by Restoration of miR-124-5p Expression
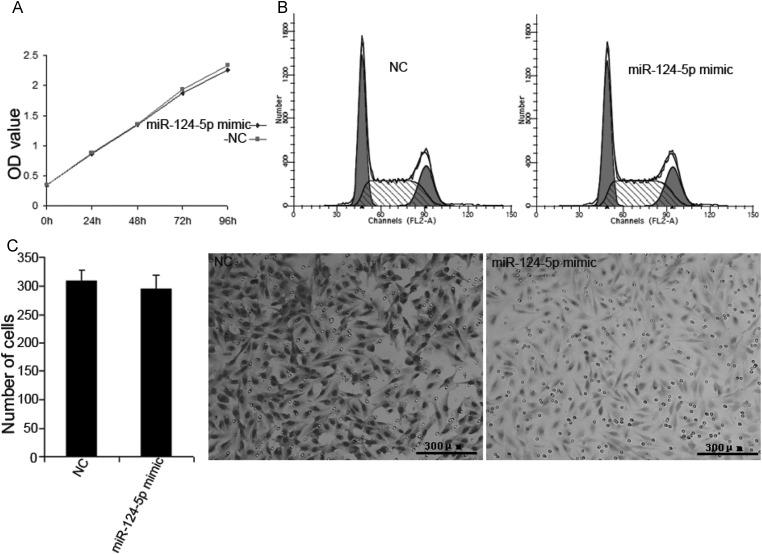
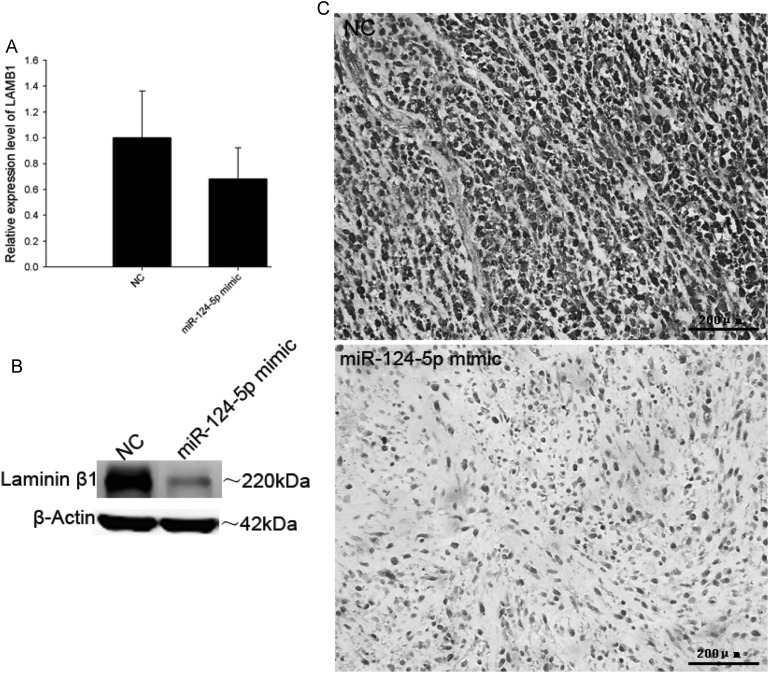
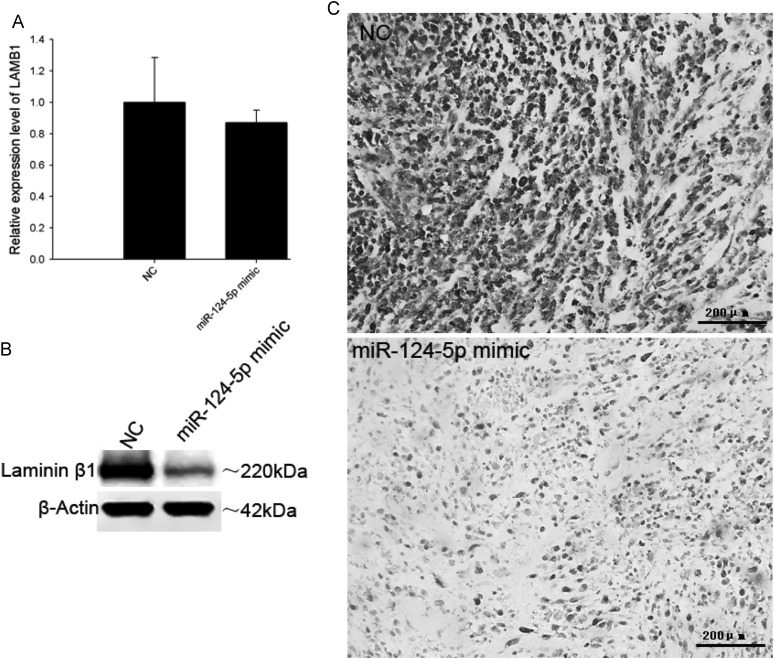
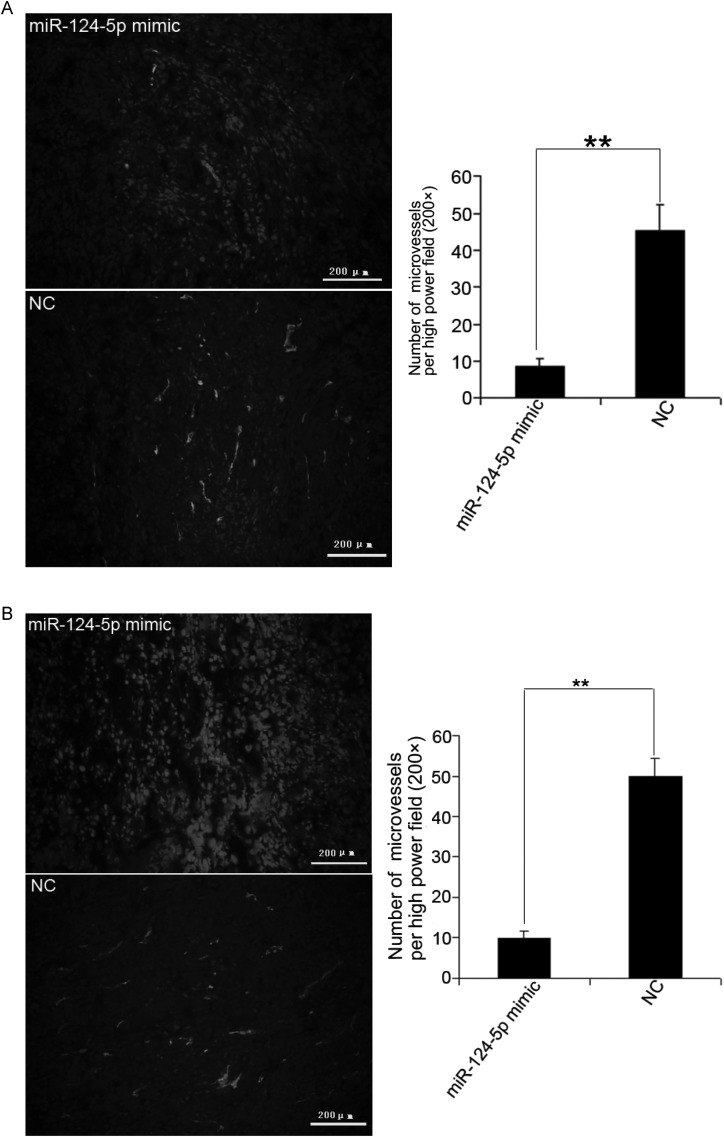
Although the results from the xenograft tumor model indicated that miR-124-5p restoration can suppress tumor growth, it did not significantly inhibit proliferation (Fig. 6A and B) or invasion (Fig. 6C) in transfected U87 cells. This would imply that miR-124-5p regulation of LAMB1 has no effect on cell cycling or cell migration. Since laminin-8 (with LAMB1) is expressed in vascular endothelial cell BM, it was hypothesized that the absence of a vascular network in the U87 cell culture environment could account for the lack of an effect on tumor growth that was so prominently observed in the xenograft model. Therefore, tumors were analyzed for LAMB1 expression and microvessel density. A decrease in LAMB1 protein level was detected in the U87 (Fig. 7) and U251 (Fig. 8) tumors injected with the miR-124-5p mimic in contrast to mRNA levels, which were comparable to those in NC-injected tumors. Immunohistochemical staining of xenograft tissue sections with an antibody against the endothelial cell marker CD31 revealed that injection of the miR-124-5p mimic to restore miR-124-5p expression led to a dramatic reduction in microvessel density in U87 (Fig. 9A) and U251 xenografts (Fig. 9B).
Fig. 6.
Effects of miR-124-5p on cell proliferation and invasion. U87 cells were transfected with miR-124-5p mimic or miRNA mimic negative control (NC). (A and B) Effect on cell proliferation as assessed by the MTT assay and cell cycle analysis. (C) Effect on cell migration as assessed by the transwell migration assay. Data are shown as mean ± SD. Scale bar = 300 μm.
Fig. 7.
Downregulation of LAMB1 in U87 xenografts upon restoration of miR-124-5p expression. LAMB1 mRNA and protein expression levels in U87 xenografts injected with miR-124-5p mimic or miRNA mimic negative control (NC) were determined by (A) quantitative PCR, (B) Western blotting, and (C) immunohistochemistry. Data are shown as mean ± SD. Scale bar = 200 μm.
Fig. 8.
Downregulation of LAMB1 in U251 xenografts upon restoration of miR-124-5p expression. LAMB1 mRNA and protein expression levels in U251 xenografts injected with miR-124-5p mimic or miRNA mimic negative control (NC) were determined by (A) quantitative PCR, (B) Western blotting, and (C) immunohistochemistry. Data are shown as mean ± SD. Scale bar = 200 μm.
Fig. 9.
Reduction in microvessel density upon restoration of miR-124-5p expression. (A and B) Microvessel density in U87 and U251 xenografts injected with miR-124-5p mimic or miRNA mimic negative control (NC), as determined by immunohistochemical staining for the vascular endothelial cell marker CD31. The number of vessels per field (200×) was counted. Data are shown as mean ± SD. **P < .01. Scale bar = 200 μm.
LAMB1 Knockdown Suppresses Growth Inhibition and Reduces Microvessel Density in Glioma Xenografts
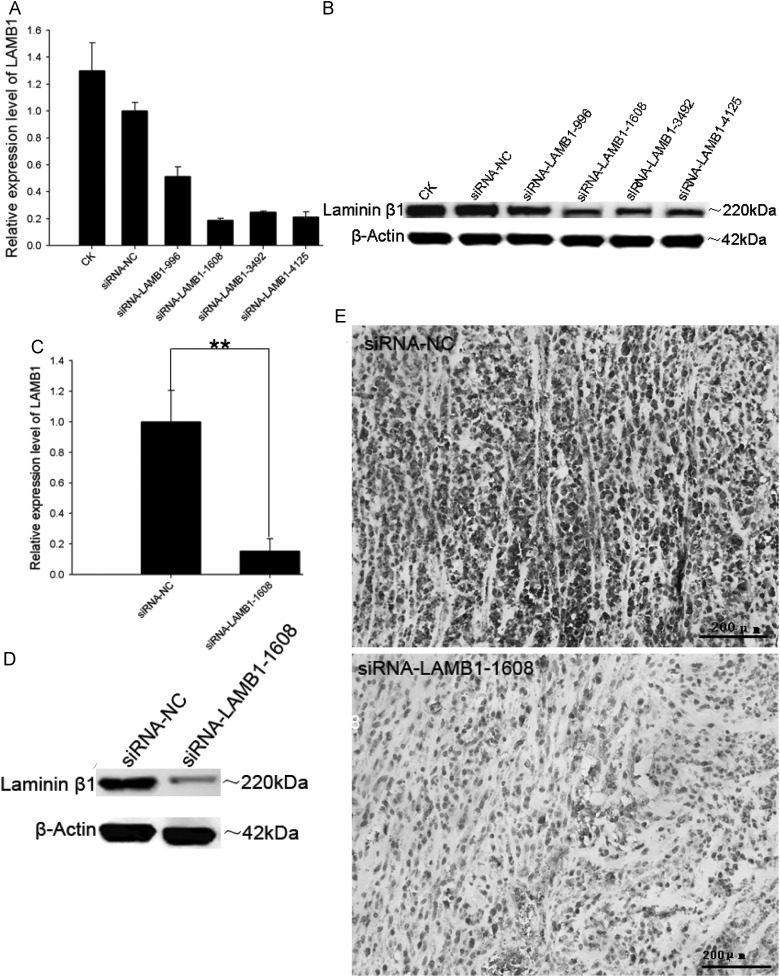
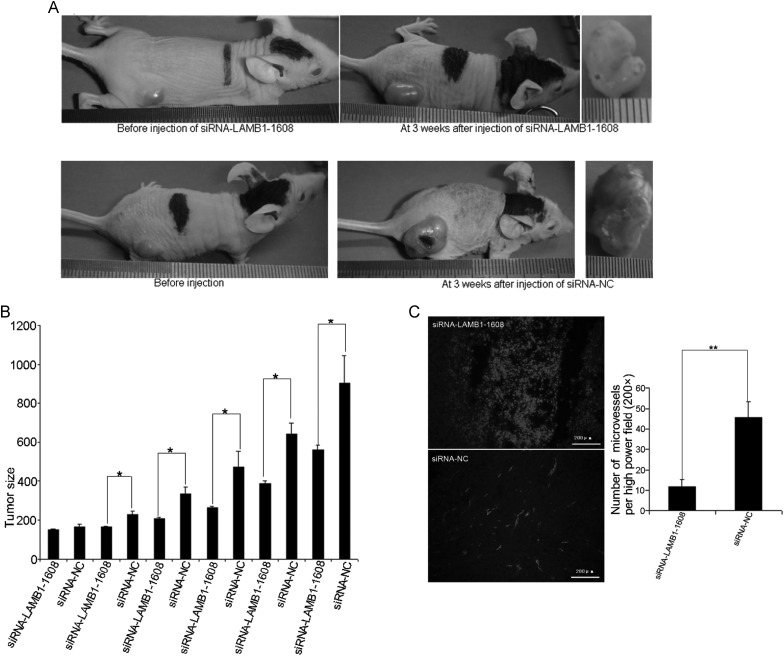
To examine whether LAMB1 mediates the miR-124-5p-induced growth inhibition and decrease in microvessel density observed in glioma xenografts, siRNA constructs were used to knock down LAMB1 expression. SiRNAs targeting different regions of LAMB1 were transfected into U87 cells, and LAMB1 expression was assessed by qPCR and Western blotting 48 hours later. SiRNA-LAMB1-1608 most effectively suppressed LAMB1 expression (Fig. 10A and B) and was therefore used in the subsequent experiments. LAMB1 expression was suppressed when siRNA-LAMB1-1608 was injected into U87 xenograft tumors compared with the expression level after injection of siRNA-NC (Fig. 10C–E). Moreover, the growth of U87 xenograft tumors injected with siRNA-LAMB1-1608 was suppressed compared with tumors treated with siRNA-NC (mean tumor volume, 561.73 ± 20.84 mm3 vs 904.89 ± 140.07 mm3; P < .05; Fig. 11A and B), and microvessel density was also significantly reduced (Fig. 11C).
Fig. 10.
Suppression of LAMB1 expression by siRNA. U87 cells were transfected with siRNA-LAMB1-996, siRNA-LAMB1-1608, siRNA-LAMB1-3492, siRNA-LAMB1-4125, or siRNA-NC (negative control), and LAMB1 expression was analyzed by (A) quantitative PCR, and (B) Western blotting 48 hours later. U87 xenografts were injected with siRNA-LAMB1-1608 or siRNA-NC, and LAMB1 expression was evaluated by (C) quantitative PCR, (D) Western blotting, and (E) immunohistochemistry. β-actin was used as a loading control. Data are shown as mean ± SD. **P < .01. Scale bars. Scale bar = 200 μm.
Fig. 11.
Inhibition of tumor growth and angiogenesis by LAMB1 knockdown in glioma xenografts. Tumors induced in immunocompromised nu/nu mice were injected with siRNA-LAMB1-1608 or siRNA-NC (negative control) for 3 weeks. (A) Growth of U87 or U251 xenografts was assessed at the beginning and end of the experiment. (B) Volume of U87 or U251 xenografts was measured every 3 to 4 days. (C) Microvessel density in U251 xenografts injected with siRNA-LAMB1-1608 or siRNA-NC, as determined by immunohistochemical staining for the vascular endothelial cell marker CD31. The number of vessels per field (200×) was counted. Data are shown as mean ± SD. *P < .05; **P < .01. Scale bar = 200 μm.
Discussion
Despite recent improvements in treatment approaches, the prognosis for GBM patients remains poor due to the sudden onset, aggressive proliferation, and susceptibility to metastasis associated with GBM.29,30 The successful management of GBM depends on the identification of factors that are misexpressed in tumorigenic tissues and the elucidation of mechanisms that lead to the dysregulation of genes promoting tumor formation.
A switch from laminin-9 to laminin-8 expression accompanies glioma progression and predicts tumor recurrence.28 The present study showed that LAMB1 protein is expressed at high levels in high-grade gliomas, suggesting that it could be involved in tumor progression. Upregulation of laminin-8 expression in tumor-adjacent tissues may facilitate the spread of glioma foci not removed by surgery or available therapies, leading to disease recurrence; indeed, inhibiting laminin-8 expression in vivo reduces glioma angiogenesis.31 Therefore, LAMB1 is likely an important mediator of glioma progression.
MiR-124-3p is significantly downregulated in AA and GBM tumors,18,19 which is correlated with poor prognosis in glioma patients. The discovery that miRNAs are capable of regulating multiple target genes simultaneously could explain the complex mechanisms underlying GBM. The expression of miR-124-3p target genes, namely the Ras GTPase activating protein 1 (IQGAP1), and the cytoskeletal proteins laminin c1 (LAMC1) and integrin β1 (ITGB1) was upregulated and thus inversely correlated with miR-124-3p expression in GBM samples. Transfection of GBM cells with miR-124-3p mimic inhibited cell migration and invasion as well as the expression of IQGAP1, LAMC1, and ITGB1. These results suggest that the altered expression of miR-124-3p may underlie the emergence of migratory behavior and other metastatic properties in gliomas.
The findings of the present study indicate that miR-124-5p may have a similar role in GBM progression. A downregulation of miR-124-5p expression was observed in high-grade gliomas and was inversely correlated with LAMB1 expression (Figs. 1–3). LAMB1 protein expression was inhibited by miR-124-5p (Fig. 4), and restoration of miR-124-5p expression strongly inhibited the growth of glioma xenografts (Figs. 7 and 8). Moreover, overexpressing miR-124-5p led to a reduction in microvessel density in tumors, accompanied by downregulation of LAMB1 protein expression. Suppression of LAMB1 by siRNA knockdown inhibited tumor growth and angiogenesis (as evidenced by the reduction in microvessel density in tumors) as effectively as miR-124-5p restoration/overexpression (Fig. 11). Taken together, these results provide evidence that the changes in growth and migratory properties in GBM are mediated through the posttranscriptional, negative regulation of LAMB1 by miR-124-5p and reveal a possible tumor-suppressor function for miR-124-5p. Therefore, miR-124-5p may serve as a useful prognostic marker for GBM, and could be a potential target of new therapeutic strategies.
Authorship Contributions
Qiang Chen and Guohui Lu designed and performed the experiments, analyzed the data, and wrote the first draft of the paper. Shizhong Zhang wrote the final version of the paper and directed the study along with Ruxiang Xu. Assistance in performing the experiments was provided by Yufa Li (evaluation of brain samples), Ruxiang Xu (Western blots), Yingqian Cai (reporter assays), and Yiquan Ke (qPCR). All authors read and approved the final manuscript.
Funding
This work was funded by Science Projects (Nos. 30772232/C1608, 81371397, 81172416), National Natural Science Foundation of China, and Sci-Tech Research Projects (2009B030801375) of Guangdong Province.
Acknowledgments
The authors thank Dr. Fengsheng Chen in the Department of Oncology at Southern Hospital for providing diagnoses of glioma tissue samples.
Conflict of interest statement. None declared.
References
- 1.Stupp R, Mason WP, van den Bent MJ, et al. Radiotherapy plus concomitant and adjuvant temozolomide for glioblastoma. N Engl J Med. 2005;352(10):987–996. doi: 10.1056/NEJMoa043330. [DOI] [PubMed] [Google Scholar]
- 2.Louis DN, Ohgaki H, Wiestler OD, et al. The 2007 WHO classification of tumours of the central nervous system. Acta Neuropathol. 2007;114(2):97–109. doi: 10.1007/s00401-007-0243-4. [DOI] [PMC free article] [PubMed] [Google Scholar]
- 3.Tait CR, Jones PF. Angiopoietins in tumours: the angiogenic switch. J Pathol. 2004;204(1):1–10. doi: 10.1002/path.1618. [DOI] [PubMed] [Google Scholar]
- 4.Folkman J. How is blood vessel growth regulated in normal and neoplastic tissue?. G.H.A. Clowes memorial Award lecture. Cancer Res. 1986;46(2):467–473. [PubMed] [Google Scholar]
- 5.Folkman J. What is the evidence that tumors are angiogenesis dependent? J Natl Cancer Inst. 1990;82(1):4–6. doi: 10.1093/jnci/82.1.4. [DOI] [PubMed] [Google Scholar]
- 6.Timpl R, Brown JC. The laminins. Matrix Biol. 1994;14(4):275–281. doi: 10.1016/0945-053x(94)90192-9. [DOI] [PubMed] [Google Scholar]
- 7.Engvall E, Wewer UM. Domains of laminin. J Cell Biochem. 1996;61(4):493–501. doi: 10.1002/(SICI)1097-4644(19960616)61:4%3C493::AID-JCB2%3E3.0.CO;2-J. [DOI] [PubMed] [Google Scholar]
- 8.Burgeson RE, Chiquet M, Deutzmann R, et al. A new nomenclature for the laminins. Matrix Biol. 1994;14(3):209–211. doi: 10.1016/0945-053x(94)90184-8. [DOI] [PubMed] [Google Scholar]
- 9.Ryan MC, Christiano AM, Engvall E, et al. The functions of laminins: lessons from in vivo studies. Matrix Biol. 1996;15(6):369–381. doi: 10.1016/s0945-053x(96)90157-2. [DOI] [PubMed] [Google Scholar]
- 10.Frieser M, Nockel H, Pausch F, et al. Cloning of the mouse laminin alpha 4 cDNA. Expression in a subset of endothelium. Eur J Biochem. 1997;246(3):727–735. doi: 10.1111/j.1432-1033.1997.t01-1-00727.x. [DOI] [PubMed] [Google Scholar]
- 11.Iivanainen A, Kortesmaa J, Sahlberg C, et al. Primary structure, developmental expression, and immunolocalization of the murine laminin alpha4 chain. J Biol Chem. 1997;272(44):27862–27868. doi: 10.1074/jbc.272.44.27862. [DOI] [PubMed] [Google Scholar]
- 12.Sixt M, Engelhardt B, Pausch F, et al. Endothelial cell laminin isoforms, laminins 8 and 10, play decisive roles in T cell recruitment across the blood-brain barrier in experimental autoimmune encephalomyelitis. J Cell Biol. 2001;153(5):933–946. doi: 10.1083/jcb.153.5.933. [DOI] [PMC free article] [PubMed] [Google Scholar]
- 13.Fujiwara H, Gu J, Sekiguchi K. Rac regulates integrin-mediated endothelial cell adhesion and migration on laminin-8. Exp Cell Res. 2004;292(1):67–77. doi: 10.1016/j.yexcr.2003.08.010. [DOI] [PubMed] [Google Scholar]
- 14.Thyboll J, Kortesmaa J, Cao R, et al. Deletion of the laminin alpha4 chain leads to impaired microvessel maturation. Mol Cell Biol. 2002;22(4):1194–1202. doi: 10.1128/MCB.22.4.1194-1202.2002. [DOI] [PMC free article] [PubMed] [Google Scholar]
- 15.Ljubimova JY, Lakhter AJ, Loksh A, et al. Overexpression of alpha4 chain-containing laminins in human glial tumors identified by gene microarray analysis. Cancer Res. 2001;61(14):5601–5610. [PubMed] [Google Scholar]
- 16.Landgraf P, Rusu M, Sheridan R, et al. A mammalian microRNA expression atlas based on small RNA library sequencing. Cell. 2007;129(7):1401–1414. doi: 10.1016/j.cell.2007.04.040. [DOI] [PMC free article] [PubMed] [Google Scholar]
- 17.Lagos-Quintana M, Rauhut R, Yalcin A, et al. Identification of tissue-specific microRNAs from mouse. Curr Biol. 2002;12(9):735–739. doi: 10.1016/s0960-9822(02)00809-6. [DOI] [PubMed] [Google Scholar]
- 18.Silber J, Lim DA, Petritsch C, et al. miR-124 and miR-137 inhibit proliferation of glioblastoma multiforme cells and induce differentiation of brain tumor stem cells. BMC Med. 2008;6:14. doi: 10.1186/1741-7015-6-14. [DOI] [PMC free article] [PubMed] [Google Scholar]
- 19.Fowler A, Thomson D, Giles K, et al. miR-124a is frequently down-regulated in glioblastoma and is involved in migration and invasion. Eur J Cancer. 2011;47(6):953–963. doi: 10.1016/j.ejca.2010.11.026. [DOI] [PubMed] [Google Scholar]
- 20.Lee MR, Kim JS, Kim KS. miR-124a is important for migratory cell fate transition during gastrulation of human embryonic stem cells. Stem Cells. 2010;28(9):1550–1559. doi: 10.1002/stem.490. [DOI] [PubMed] [Google Scholar]
- 21.Lim LP, Lau NC, Garrett-Engele P, et al. Microarray analysis shows that some microRNAs downregulate large numbers of target mRNAs. Nature. 2005;433(7027):769–773. doi: 10.1038/nature03315. [DOI] [PubMed] [Google Scholar]
- 22.Piao Y, Lu L, de GJ. AMPA receptors promote perivascular glioma invasion via beta1 integrin-dependent adhesion to the extracellular matrix. Neuro Oncol. 2009;11(3):260–273. doi: 10.1215/15228517-2008-094. [DOI] [PMC free article] [PubMed] [Google Scholar]
- 23.Chi SW, Zang JB, Mele A, et al. Argonaute HITS-CLIP decodes microRNA-mRNA interaction maps. Nature. 2009;460(7254):479–486. doi: 10.1038/nature08170. [DOI] [PMC free article] [PubMed] [Google Scholar]
- 24.Cao X, Pfaff SL, Gage FH. A functional study of miR-124 in the developing neural tube. Genes Dev. 2007;21(5):531–536. doi: 10.1101/gad.1519207. [DOI] [PMC free article] [PubMed] [Google Scholar]
- 25.Kawataki T, Yamane T, Naganuma H, et al. Laminin isoforms and their integrin receptors in glioma cell migration and invasiveness: Evidence for a role of alpha5-laminin(s) and alpha3beta1 integrin. Exp Cell Res. 2007;313(18):3819–3831. doi: 10.1016/j.yexcr.2007.07.038. [DOI] [PubMed] [Google Scholar]
- 26.Kleihues P, Burger PC, Scheithauer BW. The new WHO classification of brain tumours. Brain Pathol. 1993;3(3):255–268. doi: 10.1111/j.1750-3639.1993.tb00752.x. [DOI] [PubMed] [Google Scholar]
- 27.Umas-Duport C, Beuvon F, Varlet P, et al. [Gliomas: WHO and Sainte-Anne Hospital classifications] Ann Pathol. 2000;20(5):413–428. [PubMed] [Google Scholar]
- 28.Ljubimova JY, Fugita M, Khazenzon NM, et al. Association between laminin-8 and glial tumor grade, recurrence, and patient survival. Cancer. 2004;101(3):604–612. doi: 10.1002/cncr.20397. [DOI] [PubMed] [Google Scholar]
- 29.Stupp R, Hegi ME, Mason WP, et al. Effects of radiotherapy with concomitant and adjuvant temozolomide versus radiotherapy alone on survival in glioblastoma in a randomised phase III study: 5-year analysis of the EORTC-NCIC trial. Lancet Oncol. 2009;10(5):459–466. doi: 10.1016/S1470-2045(09)70025-7. [DOI] [PubMed] [Google Scholar]
- 30.Ohgaki H, Kleihues P. Genetic alterations and signaling pathways in the evolution of gliomas. Cancer Sci. 2009;100(12):2235–2241. doi: 10.1111/j.1349-7006.2009.01308.x. [DOI] [PMC free article] [PubMed] [Google Scholar]
- 31.Fujita M, Khazenzon NM, Ljubimov AV, et al. Inhibition of laminin-8 in vivo using a novel poly(malic acid)-based carrier reduces glioma angiogenesis. Angiogenesis. 2006;9(4):183–191. doi: 10.1007/s10456-006-9046-9. [DOI] [PMC free article] [PubMed] [Google Scholar]


