Abstract
Background
MRI group analysis is a powerful tool for elucidating pathological conditions in the brain that are challenging to reveal from single subject analysis. This research aimed to elucidate special distribution characteristics of primary central nervous system lymphoma (PCNSL) within the brain with respect to molecular marker expression patterns.
Methods
MR images from 100 treatment-naive PCNSL patients were collected and registered onto averaged standard anatomical MRI (MNI152). Gadolinium-enhanced lesions were extracted, and a lesion frequency map was created. Lymphoma subtypes were classified as germinal center B (GCB) or non-GCB by immunohistochemistry in 90 patients.
Results
A PCNSL frequency map showed that these tumors tended to occur around the lateral, third and fourth ventricles. Moreover, GCB (27 cases) and non-GCB (63 cases) PCNSL frequency maps showed GCB lymphomas located at the upper tegmentum and cerebellum around the fourth ventricle, while non-GCB lymphomas tended to occupy the anterior fornix. These differences were significant and confirmed by the existence of voxels with P values <.05 (random permutation analysis with voxel-wise Fisher' exact test). This is the very first report to address phenotypical and spatial distributional differences between GCB and non-GCB PCNSL using an MR group analytical method.
Keywords: germinal center, MRI, primary central nervous system lymphoma
Primary central nervous system lymphoma (PCNSL) is confined within the brain, with occasional involvement of the ocular structures.1,2 Previous reports have suggested that this neoplasm tends to arise in deep-seated locations such as the basal ganglia and white matter surrounding the ventricles.1 These investigations, however, have mainly been performed using individual anatomical identification of the lesions. Individual differences in size and shape of the brain hamper cross-patient analysis of lesion location. With the advent of image registration and 3-dimensional structural deformation algorithms, it is now possible to manipulate and register individual brain images onto an averaged standard brain image,3 allowing objective and statistically verifiable cross-patient analyses of lesion location. This technique has the potential to elucidate regions within the brain that are likely to be affected by a disease. Moreover, by incorporating biological information such as gene expression patterns, group analyses of diseases will become possible, thus revealing differences in locations prone to be affected by different subtypes of the disease.4,5 Although PCNSL is reported to arise in specific locations within the brain, as mentioned above,1 no previous studies have attempted such cross-patient analysis of lesion location.
In this study, MR images from 100 consecutive treatment-naive PCNSL patients were retrospectively collected and analyzed. In addition, 90 cases were classified as either germinal center B-cell (GCB) or non-GCB lymphoma according to molecular expression patterns based on immunohistochemistry. Lesion locations were then compared between these 2 groups, and statistical analyses were applied to clarify lymphoma subtype-specific patterns of lesion occurrence.
Materials and Methods
Patients and Data Collection
MR images from 100 consecutive treatment-naive PCNSL patients treated between 2000 and 2013 at 3 institutions were retrospectively collected for analysis. MR imaging was performed using either 1.5- or 3.0-T scanners, and axial gadolinium-enhanced T1-weighted images were used for all analyses. As gadolinium-enhanced lesions could indicate both pre- and present-existing PCNSL lesions, treatment-naive PCNSL patients were chosen for analysis to exclude lesions where the blood-brain barrier would be impaired with no evident tumor cell infiltration. Slice thickness ranged from 0.8 to 5 mm. In all 100 patients, diffuse large B-cell lymphoma (DLBCL) was confirmed by board-certified pathologists using hematoxylin-eosin staining along with immunohistochemistry. In 90 patients, lymphoma subtype was determined and classified as either GCB or non-GCB lymphoma according to CD10, BCL-6, and MUM-1 expressions based on the algorithm proposed by Hans et al.6,7 The internal review board of each institution approved the clinical data to be used for this research.
Immunohistochemistry
In all cases, standard hematoxylin-eosin staining and immunohistochemical studies of CD-79a (Dako), CD-20 (L26; Dako), and CD-45RO (Nichirei) were performed. CD-79a and CD-20 were used as B-cell markers,8 while CD-45RO was used as a T-cell marker.9 All staining was performed on formalin-fixed paraffin-embedded tissue (FFPET). In addition, immunostaining for CD10 (clone 56C6; Abcam), BCL-6 (clone PG-B6P; Abcam or polyclonal; Dako), and MUM-1 (clone MUM1p; Abcam) was also performed. For all antigens, a cutoff of 30% was set as positive.6,7 CD10, BCL-6, and MUM-1 were used for classifying DLBCL into either GCB or non-GCB lymphoma, as previously described by Hans et al.6,7
Image Registration, Lesion Extraction, and Frequency Map Reconstruction
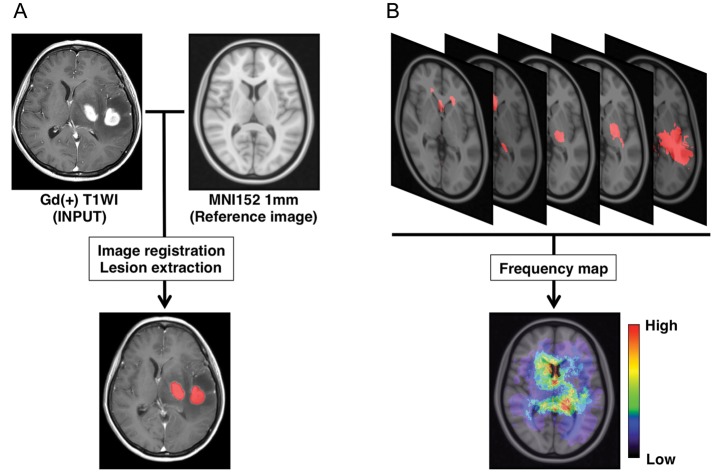
All Digital Imaging and Communications in Medicine (DICOM) format images were first converted to Neuroimaging Informatics Technology Initiative (NIfTI) format using MRIconvert (University of Oregon Lewis Center for Neuroimaging: http://lcni.uoregon.edu/~jolinda/MRIConvert/). NIfTI data were registered to a 1.0 mm isotropic, high-resolution T1-weighted brain atlas provided by the Montreal Neurological Institute (MNI152) using a mutual information algorithm with a 12-degree of freedom transformation with FSL-FLIRT (FMRIB: http://fsl.fmrib.ox.ac.uk/fsl/fslwiki/FSL). Image registrations were visually confirmed in all cases, with the manual adjustment required in one case performed using Multi-image Analysis GUI (Mango: University of Texas Health Science Center: http://ric.uthscsa.edu/mango/index.html) (Fig. 1A).
Fig. 1.
Image registration, lesion extraction, and frequency map reconstruction. (A) Gadolinium-enhanced T1-weighted images are registered onto a standard averaged MRI (MNI152) using a normalized mutual information algorithm. Gd-enhanced lesions are extracted and assigned a value of “1” to voxels within the lesion and “0” to voxels not within the lesion. (B) Binary data containing the locations of Gd-enhanced lesions are summed, and a lesion frequency map is reconstructed.
After the above-mentioned image registrations were completed, gadolinium-enhancing lesions were semi-automatically segmented using software developed in-house on Matlab (MathWorks). The gadolinium-enhancing lesion was first roughly segmented by manual segmentation performed in 3 different orientations (axial, coronal, and sagittal), followed by threshold-based segmentation of the lesion. The segmented lesion was assigned a value of 1, the nonsegmented lesion a value of 0, and saved as 3-dimensional voxels-of-interest (VOIs). When multiple lesions were present, as is often the case with PCNSL, those lesions were combined and considered as one VOI per patient.
For frequency map reconstruction, all VOIs among the group of interest were summed and averaged by the number of patients. A heat-map for the frequency of lesion occurrence was reconstructed and superimposed on the reference MNI152 (Figs. 1B and 2).
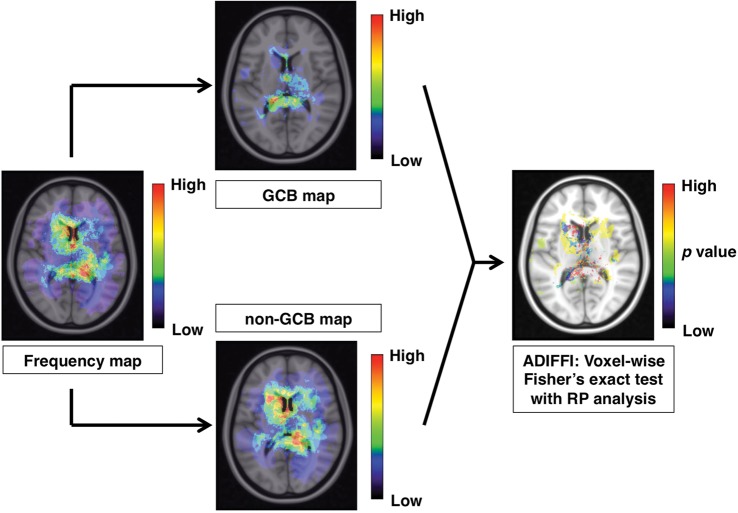
Fig. 2.
Analysis of differential involvement (ADIFFI) analysis. The frequency map is divided into 2 groups, for GCB and for non-GCB PCNSL. In the final step, an ADIFFI map is created to identify locations that show significant extreme patterns of GCB or non-GCB PCNSL occurrence.
Analysis of Differential Involvement with Random Permutation Analysis
Analysis of differential involvement (ADIFFI) with random permutation analysis was performed to test the statistical significance of differences in lesion occurrence between GCB and non-GCB, according to the method described by Ellingson et al.4,5 In short, voxel-wise 2-tailed Fisher' exact test for a 2 by 2 contingency table, which compared GCB with non-GCB and lesion-positive with lesion-negative, was conducted within all voxels containing at least one lesion occurrence; the P value threshold was set at.05. A cluster-based permutation correction was performed for multiple comparison correction, where the statistical testing was repeated 500 times with PCNSL lesions randomly reassigned to GCB or non-GCB for each iteration. More specifically, all lesions were uncategorized and reassigned randomly to either “GCB” or “non-GCB” groups according to the same proportions (ie, 27 GCB, 63 non-GCB), Fisher' exact test was performed, and all contiguous clusters >2 voxels surviving at P < .05 were stored. This cluster-size information was pooled across all 500 permutations similar to previous methods.10 Results from random permutation analysis performed 500 times suggested that the chance of obtaining clusters larger than 48 voxels was <5%. A cluster size of more than 48 voxels (or 48 mL) was considered statistically significant (Fig. 2). This technique was reported to be useful in studying the localization of IDH1 mutation-positive or MGMT promoter methylated gliomas.4,5
Results
PCNSL Frequency Map Construction
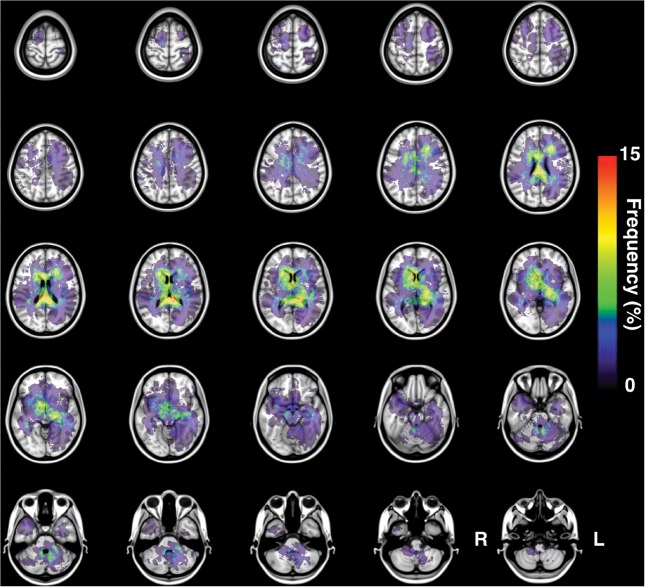
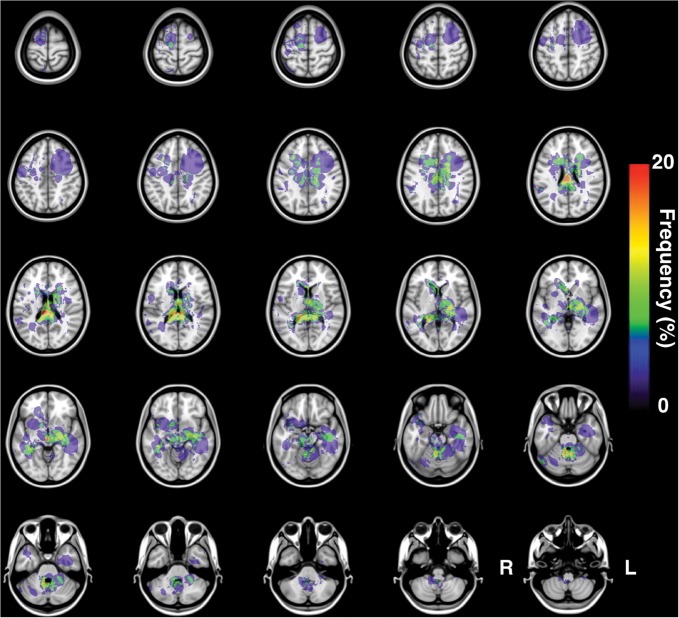
One hundred MR images were successfully transformed and registered onto MNI152, a standard averaged brain MR image set developed at the Montreal Neurological Institute. All gadolinium-enhanced lesions were successfully extracted in 3 dimensions, and a lesion occurrence frequency map was created using this data set (Fig. 3). The resulting frequency map confirmed that DLBCL-PCNSL typically arises at the basal ganglia and white matter surrounding the ventricles. In addition to those locations, the frequency map also showed the corpus callosum and splenium as being frequently affected by PCNSL.
Fig. 3.
Frequency map for all 100 PCNSLs. The present image shows the frequency map of lesion occurrence for all 100 PCNSLs.
GCB Versus non-GCB Frequency Map
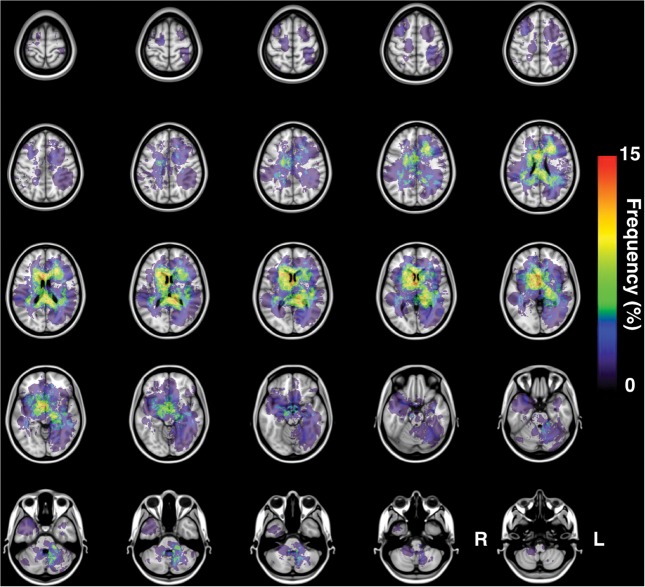
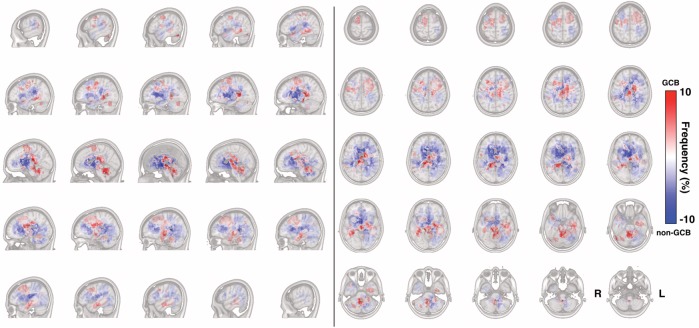
Next, immunohistochemistry profiles of the tumors were available for 90 patients, and those patients were divided into either GCB (n = 27) or non-GCB (n = 63) lymphomas according to the lymphoma classification system proposed by Hans et al.6,7 This classification system has been reported to correspond well with lymphoma profiles classified by genomic microarrays. The occurrence frequency map for each group of PCNSL is presented in Fig. 4 (non-GCB) and Fig. 5 (GCB). A distinct difference in spatial distribution was seen between the 2 groups of PCNSL. While non-GCB tends to occupy the outer segment of the supratentorial white matter of the brain, GCB tends to occupy the midline posterior portion of the supratentorial white matter along with the white matter around the fourth ventricle. A subtraction image of the lesion occurrence frequency map of these 2 groups was created to visualize the difference in spatial distribution between these 2 groups (Fig. 6). GCB tended to occupy the midline and central portion, including the posterior fossa, while non-GCB showed a different spatial distribution occupying the outer white matter of the lateral ventricles.
Fig. 4.
Frequency map of 63 non-GCB PCNSLs. The present image shows the frequency map of lesion occurrence for all 63 non-GCB PCNSLs. Non-GCB tends to occupy the outer segment of the supratentorial white matter of the brain.
Fig. 5.
Frequency map of 27 GCB PCNSLs. The present image shows the frequency map of lesion occurrence for all 27 GCB PCNSLs. GCB tends to occupy the midline posterior portion of the supratentorial white matter along with the white matter around the fourth ventricle.
Fig. 6.
Different spatial distributions of GCB and non-GCB PCNSL. Frequency of GCB and non-GCB occurrence is calculated in a voxel-wise manner. A positive value (red voxel) suggests a location more likely to be affected by GCB PCNSL, while a negative value (blue voxel) suggests a location more likely to be affected by non-GCB PCNSL.
ADIFFI Map for PCNSL
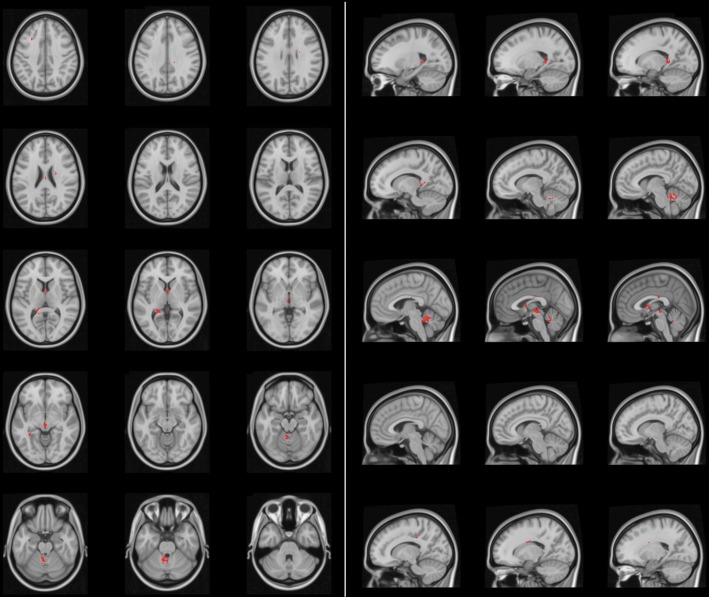
Finally, these differences were statistically challenged. As each voxel had a 2 by 2 contingency table comprising tumor versus nontumor and GCB versus non-GCB subtype, the Fisher exact test was applied voxel-wise, and any voxel that showed a significant difference was identified by setting a P value <.05. In addition, correction for cluster size was performed using random permutation analysis to obtain an ADIFFI map. This technique has already been demonstrated for elucidating spatial distribution differences of glioblastoma according to its MGMT promoter methylation or IDH1 mutation status.4,5 The ADIFFI map of PCNSL showed hotspots that exhibited significant differences in spatial distribution of the lesion between GCB and non-GCB PCNSL. Those hotspots clustered at specific locations such as the anterior portion of the fornix, upper tegmentum, and superior medullary velum (Fig. 7). Incorporating the information on GCB and non-GCB PCNSL spatial distribution patterns, the anterior portion of the fornix is the location most typical for non-GCB PCNSL, while the upper tegmentum and superior medullary velum are the locations most typical for GCB PCNSL.
Fig. 7.
Analysis of differential involvement (ADIFFI) analysis. The ADIFFI map for PCNSL shows hotspots that exhibit statistically significant differences in spatial distribution of the lesion between GCB and non-GCB PCNSL. Those hotspots cluster at specific locations, such as the anterior portion of the fornix, upper tegmentum, and superior medullary velum.
Discussion
Group analysis of disease subtype is useful for elucidating and uncovering slight biological differences between disease subtypes. This type of approach is often used for analyzing biological characteristics of surgically obtained tissues such as gene expression profiles. Although radiological images, such as MR images of each patient, provide characteristic features of the disease, group analysis has not been widely used for analyzing neoplastic lesions within the brain. Before performing any analysis, different sizes and shapes of individual brains must be reconciled so that cross-patient comparison can be possible. In this research, standardization of individual MR brain images was performed, followed by statistical spatial distribution analysis (the ADIFFI analysis) of PCNSL subtypes.
In the case of extracranial diffuse large B-cell lymphoma, these 2 groups are considered to entail different biological properties of the tumor. For example, GCB and non-GCB lymphomas have been demonstrated to behave differently, and patient prognoses differ when treated by cyclophosphamide, doxorubicin, vincristine, prednisone (CHOP)-based chemotherapy with or without rituximab.11,12 Whether this classification system works for differentiating treatment outcomes in cases of PCNSL remains controversial, and quite a few conflicting results have been reported.13–15 However, conventional analysis may have been overlooking differences in biological properties between these 2 groups of PCNSL.
The main goal of this study was to test the hypothesis that GCB and non-GCB PCNSL exhibit different biological properties in terms of the locations of tumor occurrence within the brain. As clearly shown in Figs 6 and 7, these 2 groups showed distinct differences in the spatial distribution of locations frequently affected by tumor. GCB PCNSL showed an extremely high frequency of arising at posterior midline regions of the brain, including the upper tegmentum and superior medullary velum. These locations were proven to be statistically significant locations at which GCB PCNSL tended to occur. Non-GCB PCNSL, on the other hand, tended to occur at the anterior portion of the fornix, the center of which was shown to be a statistically significant location for non-GCB PCNSL occurrence.
Two significant observations that have been elucidated by this study need to be addressed. First, this is the very first study to uncover location tendencies for PCNSL within the brain. Previous studies have analyzed and documented anatomical locations within the brain at which PCNSL tends to arise, while the current study showed a more robust and objective spatial distribution, as can be appreciated by the frequency map for PCNSL (Fig. 3). The obtained results are in line with previous findings addressing the tendency of PCNSL to occur around the ventricles and basal ganglia but offer more certainty and objectivity.
Second, this is the very first report to reveal different spatial distributions of PCNSL between GCB and non-GCB subtypes. The biological mechanisms involved in this difference remain completely unknown. However, different subtypes of glioma have been reported to arise at different locations within the brain. More specifically, glioblastoma occurs at different locations according to the specific MGMT promoter methylation or IDH1 mutation status.4,5 Although the main source of lymphoma cells for PCNSL remains contentious, it seems fair to hypothesize that different locations of white matter provide different background properties for tumor cells to engraft into, propagate, and develop into space-occupying lesions such as gliomas. As PCNSL usually involves microvessels in the form of perivascular cuffing, the microvessel architecture or adhesion molecule expression may differ depending on the location within the brain.
From a critical point of view, there are several points that should be addressed as limitations of this study. First, the prognostic impact of the observed location distribution difference between GCB and non-GCB PCNSL was not assessed in the current study. Because of the retrospective nature of the study, treatment protocol was not uniform between each institution, making it difficult to cross-correlate treatment outcomes and location distribution difference or GCB versus non-GCB status. The impact of location distribution of PCNSL on treatment outcome of the disease should be evaluated in future studies in a more prospective setting. The second point is the interpretation of gadolinium-enhancement in PCNSL. Contrast or gadolinium enhancements in neuroradiological examinations merely indicate blood-brain barrier disruption and are not identical to tumor cell existence. The correlation of neuroradiological images and histopathology of PCNSL is not well studied compared with gliomas and requires a more careful interpretation of the data presented in this study compared with previous ADIFFI studies performed on gliomas.4,5
In conclusion, however, the current study clearly showed that GCB and non-GCB PCNSL entail different biological properties in terms of the locations at which they arise. Further investigation that links molecular biological and spatial distribution properties of this tumor is warranted to further elucidate the biology of this tumor.
Funding
This investigation was supported by the Aichi Cancer Research Foundation, the SENSIN Medical Research Foundation, the Life Science Foundation of Japan and JSPS KAKENHI (25462256). This investigation was also supported by a Grant-in-Aid for Scientific Research on Innovative Areas (Comprehensive Brain Science Network) from the Ministry of Education, Science, Sports and Culture of Japan.
Conflict of interest statement. None declared.
References
- 1.Bataille B, Delwail V, Menet E, et al. Primary intracerebral malignant lymphoma: report of 248 cases. J Neurosurg. 2000;92(2):261–266. doi: 10.3171/jns.2000.92.2.0261. [DOI] [PubMed] [Google Scholar]
- 2.Hong JT, Chae JB, Lee JY, Kim J-G, Yoon YH. Ocular involvement in patients with primary CNS lymphoma. J Neurooncol. 2011;102(1):139–145. doi: 10.1007/s11060-010-0303-9. [DOI] [PubMed] [Google Scholar]
- 3.Lancaster JL, Tordesillas-Gutiérrez D, Martinez M, et al. Bias between MNI and Talairach coordinates analyzed using the ICBM-152 brain template. Hum Brain Mapp. 2007;28(11):1194–1205. doi: 10.1002/hbm.20345. [DOI] [PMC free article] [PubMed] [Google Scholar]
- 4.Ellingson BM, Cloughesy TF, Pope WB, et al. Anatomic localization of O6-methylguanine DNA methyltransferase (MGMT) promoter methylated and unmethylated tumors: A radiographic study in 358 de novo human glioblastomas. NeuroImage. 2012;59(2):908–916. doi: 10.1016/j.neuroimage.2011.09.076. [DOI] [PubMed] [Google Scholar]
- 5.Lai A, Kharbanda S, Pope WB, et al. Evidence for sequenced molecular evolution of IDH1 mutant glioblastoma from a distinct cell of origin. J Clin Oncol. 2011;29(34):4482–4490. doi: 10.1200/JCO.2010.33.8715. [DOI] [PMC free article] [PubMed] [Google Scholar]
- 6.Hans CP, Weisenburger DD, Greiner TC, et al. Confirmation of the molecular classification of diffuse large B-cell lymphoma by immunohistochemistry using a tissue microarray. Blood. 2004;103(1):275–282. doi: 10.1182/blood-2003-05-1545. [DOI] [PubMed] [Google Scholar]
- 7.Camilleri-Broët S, Crinière E, Broët P, et al. A uniform activated B-cell-like immunophenotype might explain the poor prognosis of primary central nervous system lymphomas: analysis of 83 cases. Blood. 2006;107(1):190–196. doi: 10.1182/blood-2005-03-1024. [DOI] [PubMed] [Google Scholar]
- 8.Chu PG, Arber DA. CD79: a review. Appl Immunohistochem Mol Morphol. 2001;9(2):97–106. doi: 10.1097/00129039-200106000-00001. [DOI] [PubMed] [Google Scholar]
- 9.Weiss LM, Arber DA, Strickler JG. Nasal T-cell lymphoma. Ann Oncol. 1994;5(Suppl 1):39–42. doi: 10.1093/annonc/5.suppl_1.s39. [DOI] [PubMed] [Google Scholar]
- 10.Bullmore ET, Suckling J, Overmeyer S, et al. Global, voxel, and cluster tests, by theory and permutation, for a difference between two groups of structural MR images of the brain. IEEE Trans Med Imaging. 1999;18(1):32–42. doi: 10.1109/42.750253. [DOI] [PubMed] [Google Scholar]
- 11.Perry AM, Cardesa-Salzmann TM, Meyer PN, et al. A new biologic prognostic model based on immunohistochemistry predicts survival in patients with diffuse large B-cell lymphoma. Blood. 2012;120(11):2290–2296. doi: 10.1182/blood-2012-05-430389. [DOI] [PMC free article] [PubMed] [Google Scholar]
- 12.Winter JN. Prognostic significance of Bcl-6 protein expression in DLBCL treated with CHOP or R-CHOP: a prospective correlative study. Blood. 2006;107(11):4207–4213. doi: 10.1182/blood-2005-10-4222. [DOI] [PMC free article] [PubMed] [Google Scholar]
- 13.Kinoshita M, Hashimoto N, Izumoto S, et al. Immunohistological profiling by B-cell differentiation status of primary central nervous system lymphoma treated by high-dose methotrexate chemotherapy. J Neurooncol. 2010;99(1):95–101. doi: 10.1007/s11060-010-0112-1. [DOI] [PubMed] [Google Scholar]
- 14.Momota H, Narita Y, Maeshima AM, et al. Prognostic value of immunohistochemical profile and response to high-dose methotrexate therapy in primary CNS lymphoma. J Neurooncol. 2010;98(3):341–348. doi: 10.1007/s11060-009-0078-z. [DOI] [PubMed] [Google Scholar]
- 15.Lin C-H, Kuo K-T, Chuang S-S, et al. Comparison of the expression and prognostic significance of differentiation markers between diffuse large B-cell lymphoma of central nervous system origin and peripheral nodal origin. Clin Cancer Res. 2006;12(4):1152–1156. doi: 10.1158/1078-0432.CCR-05-1699. [DOI] [PubMed] [Google Scholar]


